Process Chart
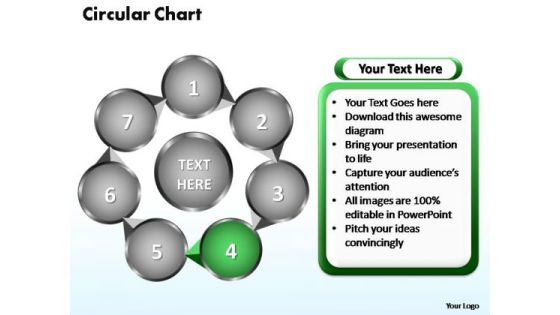
PowerPoint Designs Circular Flow Chart Ppt Designs
PowerPoint Designs Circular Flow Chart PPT Designs-Flowchart is a simple mapping tool that shows the sequence of actions within a process. Flowchart is widely used in business, education and economic presentations to help the audience visualize the content better, or to find flaws in a process.-PowerPoint Designs Circular Flow Chart PPT Designs

PowerPoint Designs Circular Flow Chart Ppt Slide
PowerPoint Designs Circular Flow Chart PPT Slide-Flowchart is a simple mapping tool that shows the sequence of actions within a process. Flowchart is widely used in business, education and economic presentations to help the audience visualize the content better, or to find flaws in a process.-PowerPoint Designs Circular Flow Chart PPT Slide
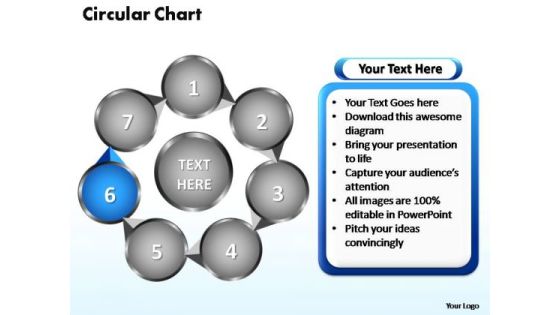
PowerPoint Designs Circular Flow Chart Ppt Slides
PowerPoint Designs Circular Flow Chart PPT Slides-Flowchart is a simple mapping tool that shows the sequence of actions within a process. Flowchart is widely used in business, education and economic presentations to help the audience visualize the content better, or to find flaws in a process.-PowerPoint Designs Circular Flow Chart PPT Slides
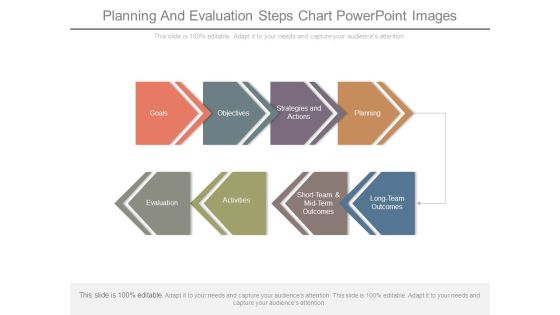
Planning And Evaluation Steps Chart Powerpoint Images
This is a planning and evaluation steps chart powerpoint images. This is a eight stage process. The stages in this process are goals, objectives, strategies and actions, planning, evaluation, activities, short team and mid term outcomes, long team outcomes.
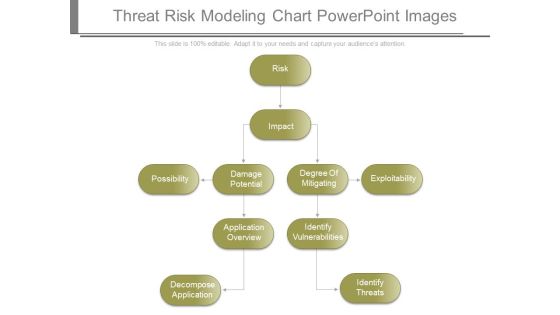
Threat Risk Modeling Chart Powerpoint Images
This is a threat risk modeling chart powerpoint images. This is a five stage process. The stages in this process are risk, impact, possibility, damage potential, degree of mitigating, exploitability, application overview, identify vulnerabilities, decompose application, identify threats.
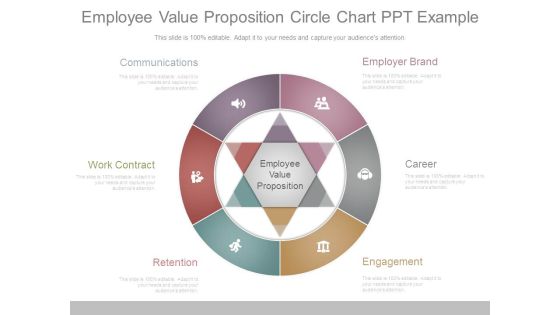
Employee Value Proposition Circle Chart Ppt Example
This is a employee value proposition circle chart ppt example. This is a six stage process. The stages in this process are employer brand, career, engagement, retention, work contract, communications.
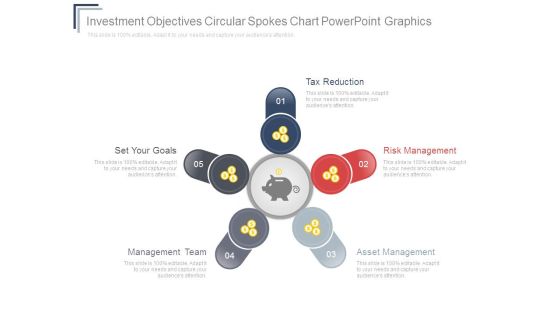
Investment Objectives Circular Spokes Chart Powerpoint Graphics
This is a investment objectives circular spokes chart powerpoint graphics. This is a five stage process. The stages in this process are tax reduction, set your goals, management team, asset management, risk management.

Economic Development Administration Organization Chart Ppt Slides
This is a economic development administration organization chart ppt slides. This is a five stage process. The stages in this process are economic development, business assistance center, business development, enterprise zone, district organizing.
Tracking Sales Performance Chart Ppt Example
This is a tracking sales performance chart ppt example. This is a eight stage process. The stages in this process are efficiency, effectiveness, profits, cost per sale, roi, profit sale, convert to sale, cost contact, conversion, contacts.
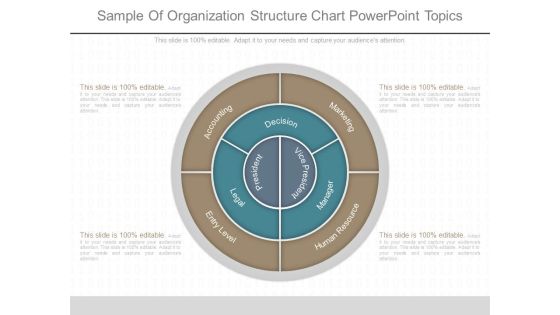
Sample Of Organization Structure Chart Powerpoint Topics
This is a sample of organization structure chart powerpoint topics. This is a four stage process. The stages in this process are president, vice president, decision, entry level, human resource, marketing, accounting.

Area Chart Ppt PowerPoint Presentation Portfolio Templates
This is a area chart ppt powerpoint presentation portfolio templates. This is a two stage process. The stages in this process are sales in percentage, chart, business, marketing, finance.

Area Chart Ppt PowerPoint Presentation Pictures Template
This is a area chart ppt powerpoint presentation pictures template. This is a two stage process. The stages in this process are sales in percentage, chart, business, marketing, strategy.

Area Chart Ppt PowerPoint Presentation Icon Summary
This is a area chart ppt powerpoint presentation icon summary. This is a two stage process. The stages in this process are financial year, area chart, in percentage, product.

Area Chart Ppt PowerPoint Presentation Inspiration Demonstration
This is a area chart ppt powerpoint presentation inspiration demonstration. This is a two stage process. The stages in this process are sales in percentage, chart, percentage, business, marketing.

Area Chart Ppt PowerPoint Presentation Styles Show
This is a area chart ppt powerpoint presentation styles show. This is a two stage process. The stages in this process are business, marketing, area chart, sales in percentage, percentage.

Scatter Chart Ppt PowerPoint Presentation Microsoft
This is a scatter chart ppt powerpoint presentation microsoft. This is a one stage process. The stages in this process are x values, scatter chart, bar graph, growth, business.

Combo Chart Ppt PowerPoint Presentation Design Ideas
This is a combo chart ppt powerpoint presentation design ideas. This is a eight stage process. The stages in this process are market size, combo chart, in years, product, growth rate.

Line Chart Ppt PowerPoint Presentation Deck
This is a line chart ppt powerpoint presentation deck. This is a two stage process. The stages in this process are business, strategy, marketing, analysis, growth, line chart.
Supply Chain Flow Chart Template Ppt Icon
This is a supply chain flow chart template ppt icon. This is a five stage process. The stages in this process are retailer, customer, supplier, manufacturer, manufacturing units, distributor, supply chain management.

Business Plan Circle Chart Powerpoint Slides Templates
This is a business plan circle chart powerpoint slides templates. This is a six stage process. The stages in this process are information technology plan, human resources plan, production plan, marketing plan, marketing plan, financial plan, management plan.

Market Research Tools Chart Presentation Visual Aids
This is a market research tools chart presentation visual aids. This is a eight stage process. The stages in this process are price analysis, target market analysis, deontic correction, corrective analysis, location analysis report, analysis report, marketing plans, identify trends.

Market Research Methodology Chart Template Ppt Sample
This is a market research methodology chart template ppt sample. This is a five stage process. The stages in this process are industry expertise, proprietary contacts, surveys, industry events, management access.
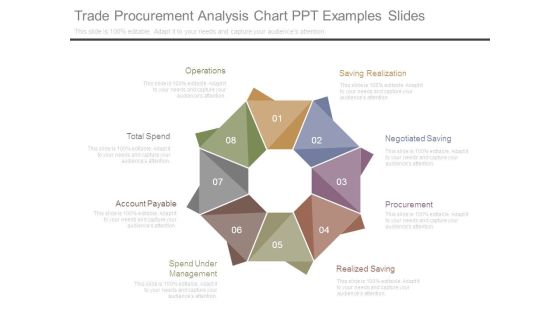
Trade Procurement Analysis Chart Ppt Examples Slides
This is a trade procurement analysis chart ppt examples slides. This is a eight stage process. The stages in this process are operations, total spend, account payable, spend under management, realized saving, procurement, negotiated saving, saving realization.

Financial Investments Pie Chart Design Powerpoint Show
This is a financial investments pie chart design powerpoint show. This is a eight stage process. The stages in this process are stocks, real estate, mutual funds, precious metal, bonds, art, collectibles, antiques.
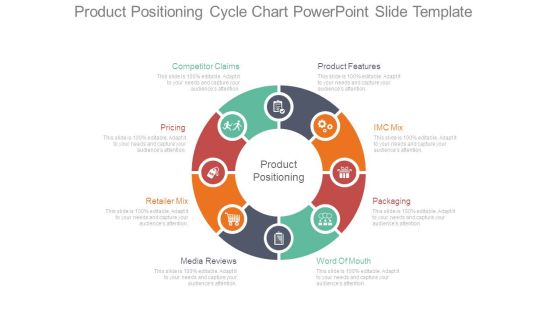
Product Positioning Cycle Chart Powerpoint Slide Template
This is a product positioning cycle chart powerpoint slide template. This is a eight stage process. The stages in this process are product features, imc mix, packaging, word of mouth, media reviews, retailer mix, pricing, competitor claims, product positioning.

Organization Chart Ppt PowerPoint Presentation Portfolio Show
Presenting this set of slides with name organization chart ppt powerpoint presentation portfolio show. This is a two stage process. The stages in this process are organization chart. This is a completely editable PowerPoint presentation and is available for immediate download. Download now and impress your audience.
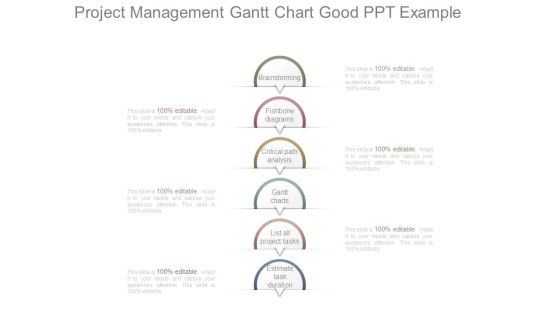
Project Management Gantt Chart Good Ppt Example
This is a project management gantt chart good ppt example. This is a six stage process. The stages in this process are brainstorming, fishbone diagrams, critical path analysis, gantt charts, list all project tasks, estimate task duration.

Area Chart Ppt PowerPoint Presentation Model Influencers
This is a area chart ppt powerpoint presentation model influencers. This is a two stage process. The stages in this process are sales in percentage, chart, business, marketing, finance.

PowerPoint Layout Circular Chart Company Ppt Theme
PowerPoint Layout circular chart Company PPT Theme-This PowerPoint Layout Circular chart can be customized and can strengthen your company's corporate design.-Access, arrow, background, banner, bright, business, chart, circle, colorful, conceptual, connection, corporate, creative, cycle, design, different, element, form, frame, graphic, idea, illustration, match, order, part, piece, process, shapes, solution, strategy, symbol, template, website-PowerPoint Layout circular chart Company PPT Theme

PowerPoint Layout Circle Puzzle Chart Ppt Backgrounds
PowerPoint Layout Circle Puzzle Chart PPT Backgrounds-Each Circle chart will vary depending on the specific subject matter, the majority of Circle charts diagram a process from start to finish.
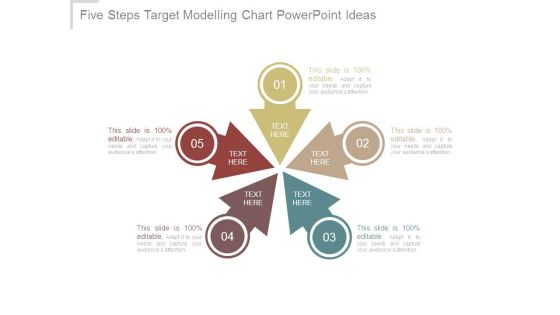
Five Steps Target Modelling Chart Powerpoint Ideas
This is a five steps target modelling chart powerpoint ideas. This is a five stage process. The stages in this process are business, process, marketing, arrows, management.
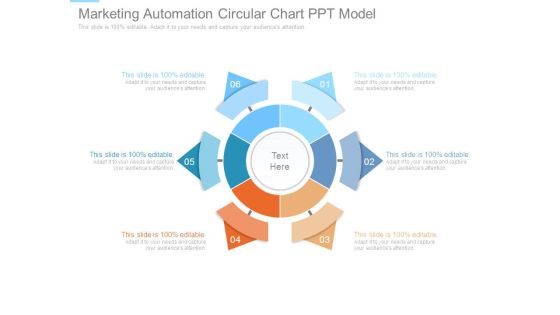
Marketing Automation Circular Chart Ppt Model
This is a marketing automation circular chart ppt model. This is a six stage process. The stages in this process are business, marketing, strategy, process, presentation.
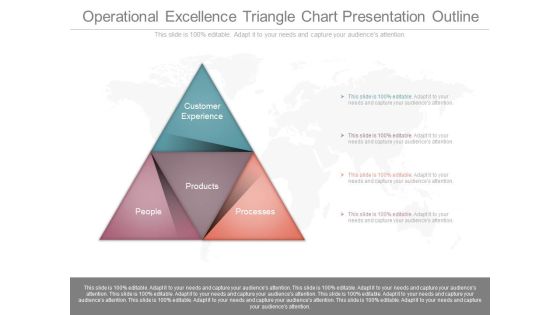
Operational Excellence Triangle Chart Presentation Outline
This is a operational excellence triangle chart presentation outline. This is a four stage process. The stages in this process are customer experience, products, processes, people.
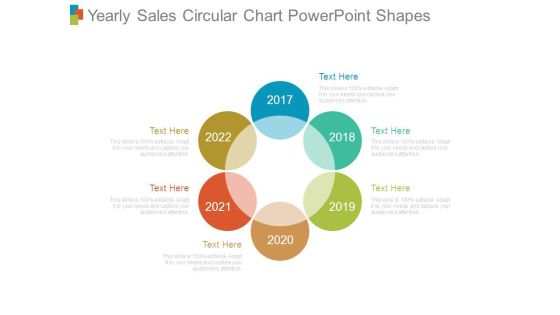
Yearly Sales Circular Chart Powerpoint Shapes
This is a yearly sales circular chart powerpoint shapes. This is a six stage process. The stages in this process are year, planning, business, process, success.

Organizational Design And Structure Chart Powerpoint Images
This is a organizational design and structure chart powerpoint images. This is a five stage process. The stages in this process are strategy, structure, rewards, people, processes.

Target Achievement Pie Chart Powerpoint Shapes
This is a target achievement pie chart powerpoint shapes. This is a three stage process. The stages in this process are business, marketing, strategy, process, presentation.

Area Chart Ppt PowerPoint Presentation Model Introduction
This is a area chart ppt powerpoint presentation model introduction. This is a two stage process. The stages in this process are sales in percentage, area chart, percentage, business, marketing.

Bubble Chart Ppt PowerPoint Presentation Outline Deck
This is a bubble chart ppt powerpoint presentation outline deck. This is a two stage process. The stages in this process are in percentage, profit, bubble chart, business, marketing.

Column Chart Ppt PowerPoint Presentation Gallery Layouts
This is a column chart ppt powerpoint presentation gallery layouts. This is a two stage process. The stages in this process are business, strategy, analysis, pretention, chart and graph, growth.
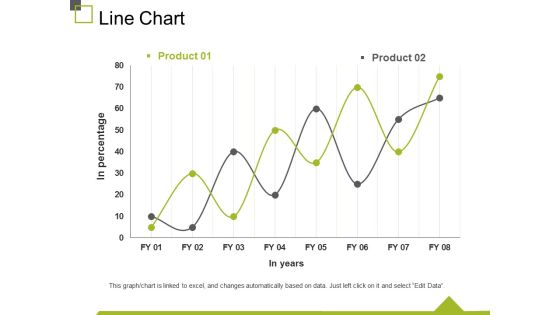
Line Chart Ppt PowerPoint Presentation Infographics Display
This is a line chart ppt powerpoint presentation infographics display. This is a two stage process. The stages in this process are in percentage, in years, chart, business, marketing.

Column Chart Ppt PowerPoint Presentation Gallery Portfolio
This is a column chart ppt powerpoint presentation gallery portfolio. This is a two stage process. The stages in this process are in months, product, column chart, growth, success.

Area Chart Ppt PowerPoint Presentation Show Professional
This is a area chart ppt powerpoint presentation show professional. This is a two stage process. The stages in this process are product, in percentage, area chart, growth, success.
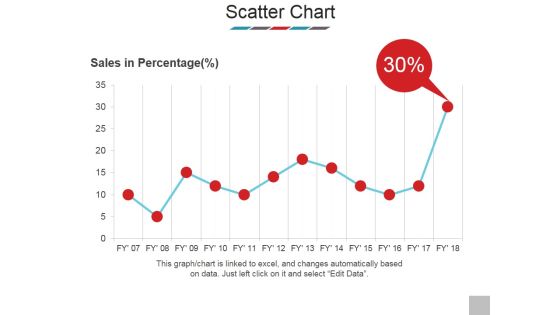
Scatter Chart Ppt PowerPoint Presentation Model Show
This is a scatter chart ppt powerpoint presentation model show. This is a one stage process. The stages in this process are sales in percentage, scatter chart, business, bar graph, marketing.

Lesson Learned Procedure Gantt Chart Topics PDF
This slide showcases the lesson learned process Gantt chart for projects, to conduct and save lessons learned. It also includes project name , date , future work , issues , etc. Showcasing this set of slides titled Lesson Learned Procedure Gantt Chart Topics PDF. The topics addressed in these templates are SEARCH TASKS, Gantt, Workload. All the content presented in this PPT design is completely editable. Download it and make adjustments in color, background, font etc. as per your unique business setting.

Activity Planning Chart Ppt PowerPoint Presentation Backgrounds
This is a activity planning chart ppt powerpoint presentation backgrounds. This is a five stage process. The stages in this process are business, strategy, analysis, marketing, chart and graph, compare.

Combo Chart Ppt PowerPoint Presentation Infographics Summary
This is a combo chart ppt powerpoint presentation infographics summary. This is a three stage process. The stages in this process are market size, product, combo chart, years, business.
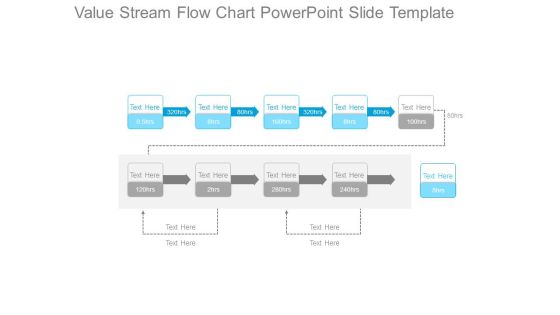
Value Stream Flow Chart Powerpoint Slide Template
This is a value stream flow chart powerpoint slide template. This is a ten stage process. The stages in this process are business, marketing, process, arrows, management.

Sipoc Procedure Chart Sample Ppt Files
This is a sipoc procedure chart sample ppt files. This is a five stage process. The stages in this process are suppliers, process, customers, input, output.

Market Size Segmentation Chart Powerpoint Templates Download
This is a market size segmentation chart powerpoint templates download. This is a five stage process. The stages in this process are business, marketing, process, management, diagram.

Product Line Depth Chart Sample Of Ppt
This is a product line depth chart sample of ppt. This is a three stage process. The stages in this process are business, marketing, management, process.

Bar Chart Ppt PowerPoint Presentation Layouts Visuals
This is a bar chart ppt powerpoint presentation layouts visuals. This is a two stage process. The stages in this process are business, strategy, marketing, planning, chart and graph.

Column Chart Ppt PowerPoint Presentation Designs
This is a column chart ppt powerpoint presentation designs. This is a two stage process. The stages in this process are business, strategy, analysis, marketing, chart and graph, growth.

Combo Chart Ppt PowerPoint Presentation Examples
This is a combo chart ppt powerpoint presentation examples. This is a three stage process. The stages in this process are business, strategy, analysis, marketing, chart and graph, growth.
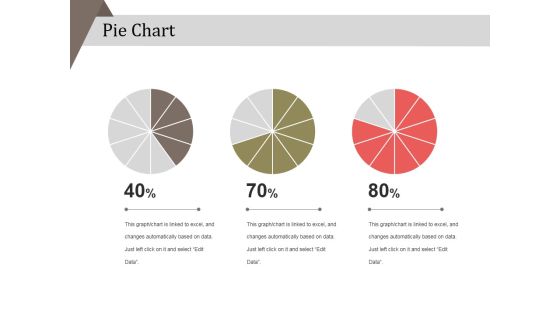
Pie Chart Ppt PowerPoint Presentation Layouts Example
This is a pie chart ppt powerpoint presentation layouts example. This is a three stage process. The stages in this process are business, strategy, analysis, pie chart, finance, marketing.
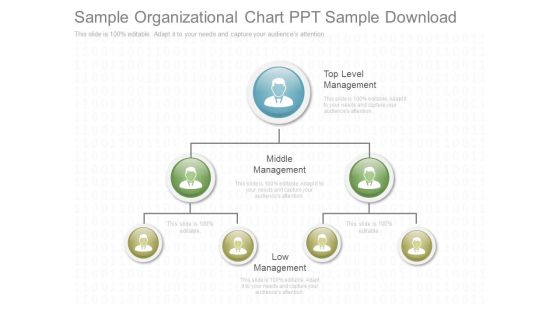
Sample Organizational Chart Ppt Sample Download
This is a sample organizational chart ppt sample download. This is a one stage process. The stages in this process are top level management, middle management, low management.

Contingency Plan Flow Chart Ppt Slides
This is a contingency plan flow chart ppt slides. This is a one stage process. The stages in this process are business, marketing.

Change Management Flow Chart Ppt Presentation
This is a change management flow chart ppt presentation. This is a four stage process. The stages in this process are defined goals, implementation, diagnosis, learning.

Cause Mapping Arrow Chart Powerpoint Presentation
This is a cause mapping arrow chart powerpoint presentation. This is a three stage process. The stages in this process are arrows, icons, business, marketing, management.

The Value Proposition Flow Chart Ppt Slides
This is a the value proposition flow chart ppt slides. This is a two stage process. The stages in this process are business, success.
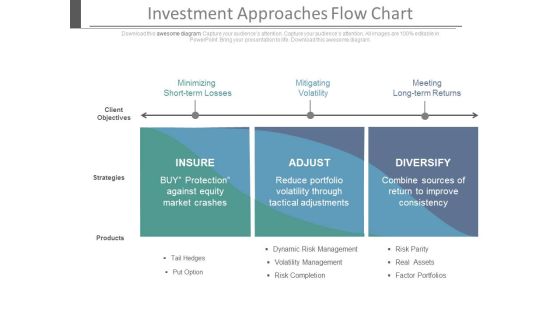
Investment Approaches Flow Chart Ppt Slides
This is an investment approached flow chart ppt slides. This is a three stage process. The stages in this process are marketing, business, success.

Brand Drivers Flow Chart Powerpoint Layout
This is a brand drivers flow chart powerpoint layout. This is a four stage process. The stages in this process are difference, value, awareness, emotion, the brand drivers.

Value Production Flow Chart Presentation Powerpoint
This is a value production flow chart presentation powerpoint. This is a three stage process. The stages in this process are value production, cost, revenue, profit.

Data Analysis Workflow Chart Powerpoint Slides
This is a data analysis workflow chart powerpoint slides. This is a three stage process. The stages in this process are connect, visualize, share.
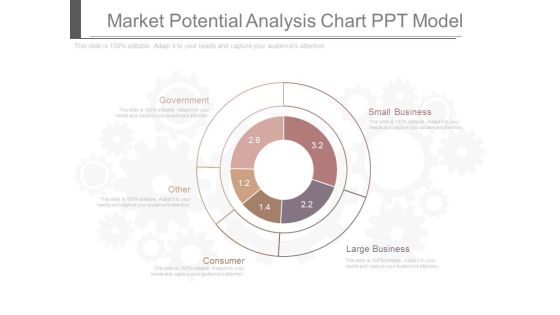
Market Potential Analysis Chart Ppt Model
This is a market potential analysis chart ppt model. This is a five stage process. The stages in this process are small business, large business, consumer, other, government.

Target Modelling Bar Chart Ppt Slides
This is a target modelling bar chart ppt slides. This is a six stage process. The stages in this process are arrows, business, success.
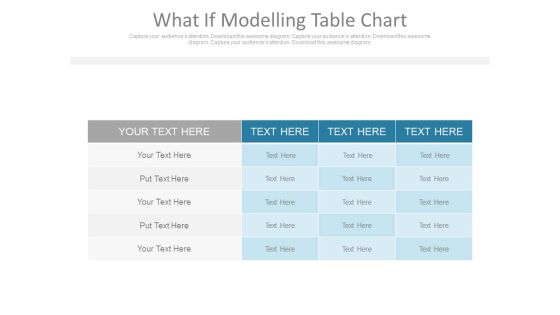
What If Modelling Table Chart Ppt Slides
This is a what if modelling table chart ppt slides. This is a one stage process. The stages in this process are business, success, marketing.
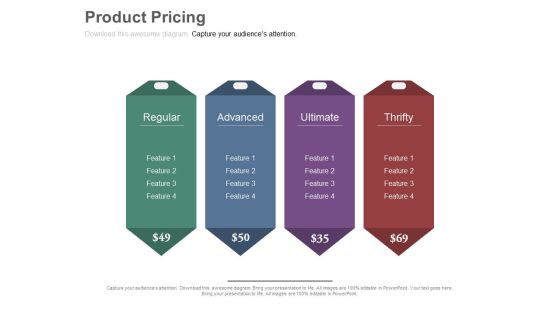
Product Pricing List Chart Ppt Slides
This is a product pricing list chart ppt slides. This is a four stage process. The stages in this process are arrows, business, marketing.

Five Steps Portfolio Management Chart Powerpoint Guide
This is a five steps portfolio management chart powerpoint guide. This is a five stage process. The stages in this process are define, measure, analyze, improve, control.

Talent Management Consulting Arrow Chart Presentation Outline
This is a talent management consulting arrow chart presentation outline. This is a three stage process. The stages in this process are development planning, future talent, capacity enhancement.\n\n\n\n\n\n\n\n\n\n\n\n\n\n\n\n
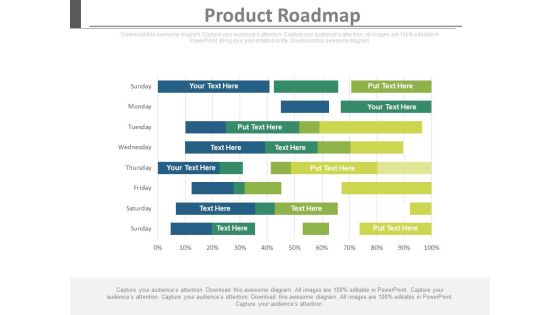
Product Roadmap Analysis Chart Ppt Slides
This is a product roadmap analysis chart ppt slides. This is a one stage process. The stages in this process are success, business, marketing.
Project Management Resource Allocation Chart Ppt Icon
This is a project management resource allocation chart ppt icon. This is a five stage process. The stages in this process are team, table, business, management, format, diagram.

Productivity Systems Sample Chart Ppt Design
This is a productivity systems sample chart ppt design. This is a seven stage process. The stages in this process are time, energy, attention, assesse, transition, manage, productivity.
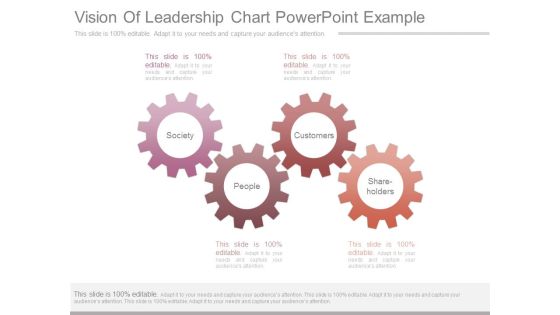
Vision Of Leadership Chart Powerpoint Example
This is a vision of leadership chart powerpoint example. This is a four stage process. The stages in this process are society, customers, people, shareholders.

Referral Report Pie Chart Ppt Summary
This is a referral report pie chart ppt summary. This is a three stage process. The stages in this process are received referrals, sent referrals, calendar events.

Cost Benefit Analysis Infographic Chart Powerpoint Themes
This is a cost benefit analysis infographic chart powerpoint themes. This is a two stage process. The stages in this process are balance, icons, finance, strategy, business.

Cost Benefit Assessment Arrow Chart Presentation Outline
This is a cost benefit assessment arrow chart presentation outline. This is a two stage process. The stages in this process are compare, arrows, finance, money, strategy.
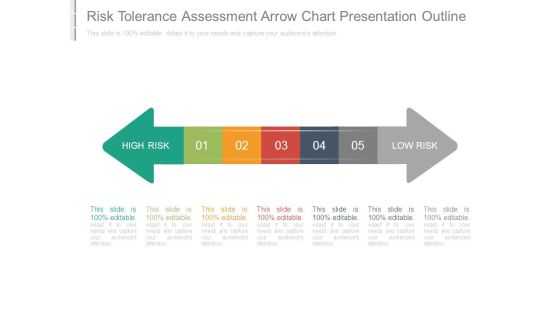
Risk Tolerance Assessment Arrow Chart Presentation Outline
This is a risk tolerance assessment arrow chart presentation outline. This is a five stage process. The stages in this process are high risk, low risk.

Health Scorecard Table Chart Powerpoint Ideas
This is a health scorecard table chart powerpoint ideas. This is a two stage process. The stages in this process are overall score, qualitative aspects, quantitative aspects.
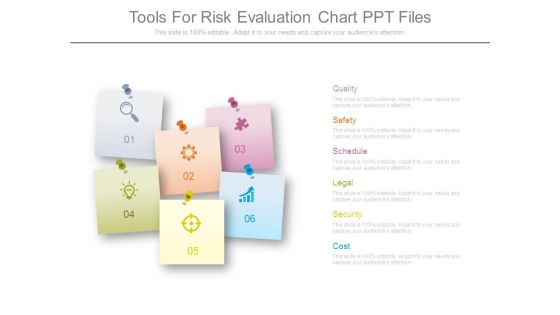
Tools For Risk Evaluation Chart Ppt Files
This is a tools for risk evaluation chart ppt files. This is a six stage process. The stages in this process are quality, safety, schedule, legal, security, cost.
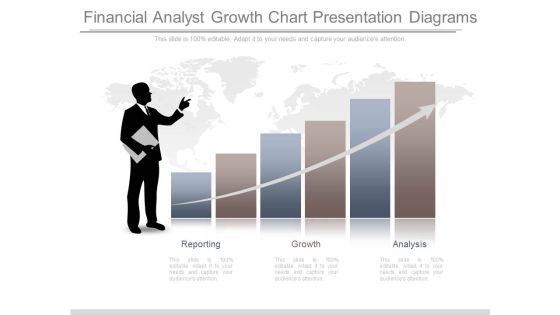
Financial Analyst Growth Chart Presentation Diagrams
This is a financial analyst growth chart presentation diagrams. This is a three stage process. The stages in this process are reporting, growth, analysis.
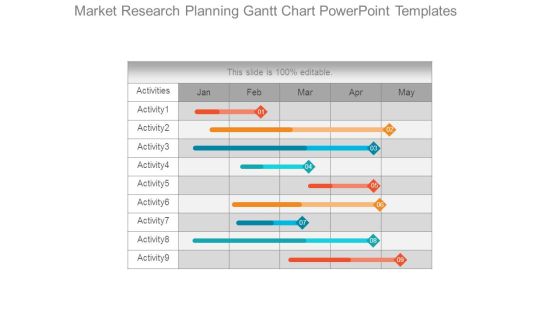
Market Research Planning Gantt Chart Powerpoint Templates
This is a market research planning gantt chart powerpoint templates. This is a five stage process. The stages in this process are jan, feb, mar, apr, may.

Resource Capacity Planning Percentage Chart Ppt Slides
This is a resource capacity planning percentage chart ppt slides. This is a four stage process. The stages in this process are business, finance, marketing.

Advisor Financial Marketing Plan Chart Presentation Ideas
This is a advisor financial marketing plan chart presentation ideas. This is a two stage process. The stages in this process are product service price, feature, benefit.

Information Management Consulting Chart Presentation Portfolio
This is a information management consulting chart presentation portfolio. This is a three stage process. The stages in this process are technology, strategy, governance, chance management.

Human Capital Management Chart Powerpoint Topics
This is a human capital management chart powerpoint topics. This is a four stage process. The stages in this process are talent, success, career, opportunity.
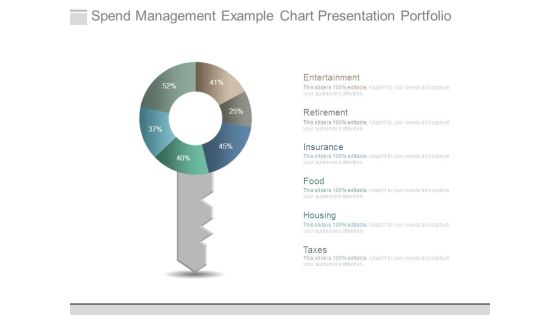
Spend Management Example Chart Presentation Portfolio
This is a spend management example chart presentation portfolio. This is a six stage process. The stages in this process are entertainment, retirement, insurance, food, housing, taxes.
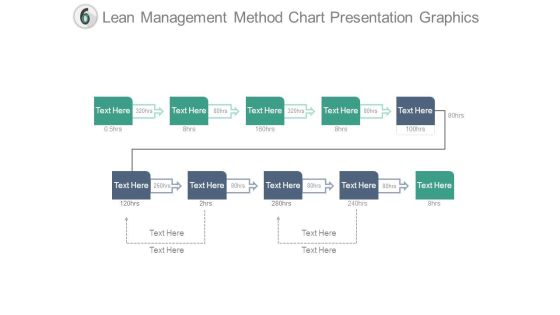
Lean Management Method Chart Presentation Graphics
This is a lean management method chart presentation graphics. This is a ten stage process. The stages in this process are management, presentation, analysis, strategy, business.
Operating Expenses Analysis Pie Chart Ppt Icon
This is a operating expenses analysis pie chart ppt icon. This is a seven stage process. The stages in this process are finance, success, business, marketing, percentage.
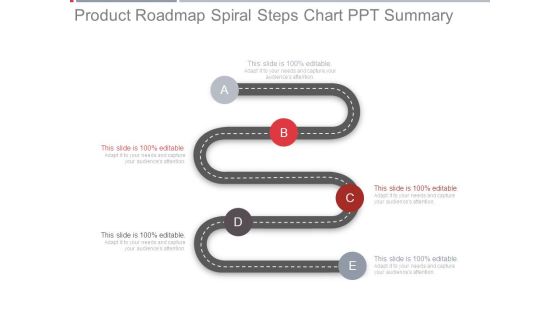
Product Roadmap Spiral Steps Chart Ppt Summary
This is a product roadmap spiral steps chart ppt summary. This is a five stage process. The stages in this process are roadmap, time planning, business, strategy, management.

Voc Semi Circle Chart Presentation Graphics
This is a voc semi circle chart presentation graphics. This is a six stage process. The stages in this process are business, marketing, management, success, diagram.

Media Kpi Development Chart Ppt Slides
This is a media KPI development chart ppt slides. This is a one stage process. The stages in this process are business, media, success.
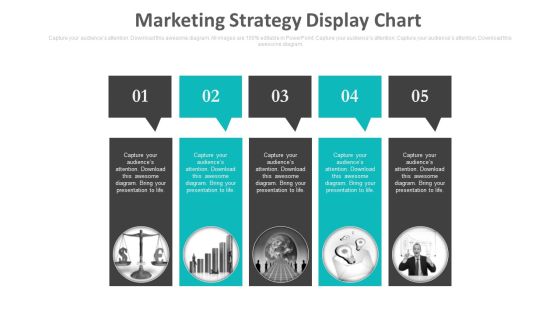
Marketing Strategy Display Chart Ppt Slides
This is a marketing strategy display chart ppt slides. This is a five stage process. The stages in this process are business, marketing, success.

Project Description Infographic Chart Powerpoint Templates
This is a project description infographic chart powerpoint templates. This is a three stage process. The stages in this process are icons, strategy, business, marketing, triangle.
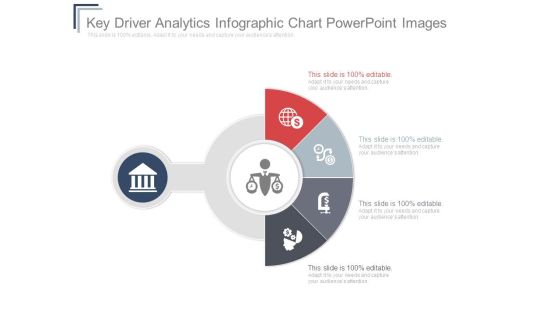
Key Driver Analytics Infographic Chart Powerpoint Images
This is a key driver analytics infographic chart powerpoint images. This is a five stage process. The stages in this process are business, marketing, semicircle, icons, strategy.

Profit And Loss Balance Chart Ppt Design
This is a profit and loss balance chart ppt design. This is a two stage process. The stages in this process are business, management, success, presentation, marketing.

About The Product Pie Chart Ppt Slides
This is a about the product pie chart ppt slides. This is a five stage process. The stages in this process are business, success, marketing.

Geographical Segmentation Gender Ratio Chart Ppt Slides
This is a geographical segmentation gender ratio chart ppt slides. This is a one stage process. The stages in this process are global, geographical, business, success.

Marketing Strategy Pie Chart Ppt Slides
This is a marketing strategy pie chart ppt slides. This is a five stage process. The stages in this process are business, marketing, success.

Media Mix Optimization Bar Chart Ppt Slides
This is a media mix optimization bar chart ppt slides. This is a one stage process. The stages in this process are business, media, success.
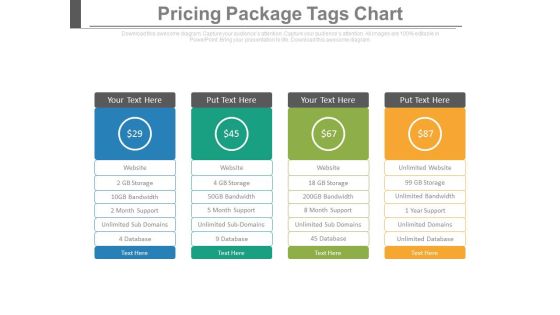
Pricing Package Tags Chart Ppt Slides
This is a pricing package tags chart ppt slides. This is a four stage process. The stages in this process are business, symbol, marketing, finance, success.

Industry Overview Percentage Chart Ppt Slides
This is a industry overview percentage chart ppt slides. This is a two stage process. The stages in this process are business, marketing.

Market Gap Analysis Chart Ppt Slides
This is a market gap analysis chart ppt slides. This is a one stage process. The stages in this process are business, marketing.
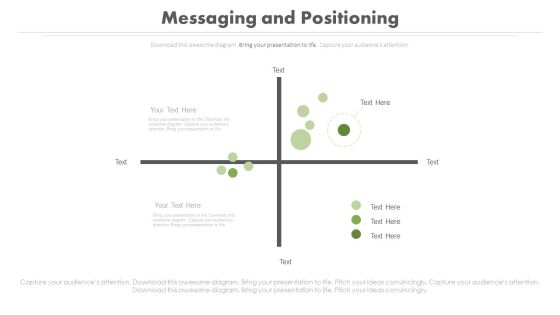
Messaging And Positioning Line Chart Ppt Slides
This is a messaging and positioning line chart ppt slides. This is a two stage process. The stages in this process are business, marketing.

Product Pricing Tabulation Chart Ppt Slides
This is a product pricing tabulation chart ppt slides. This is a five stage process. The stages in this process are arrows, business, marketing.
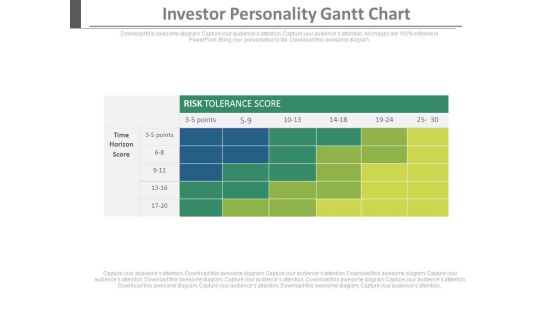
Investor Personality Gantt Chart Ppt Slides
This is an investor personality gantt chart ppt slides. This is a one stage process. The stages in this process are marketing, business, success.
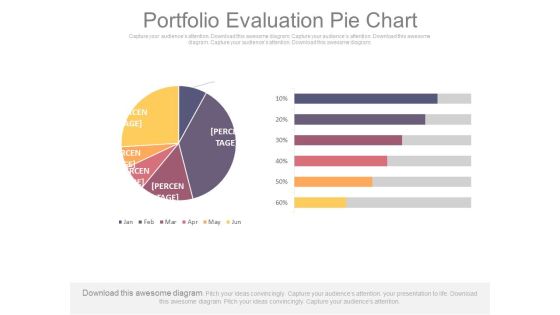
Portfolio Evaluation Pie Chart Ppt Slides
This is a portfolio evolution pie chart ppt slides. This is a six stage process. The stages in this process are business, finance, marketing.
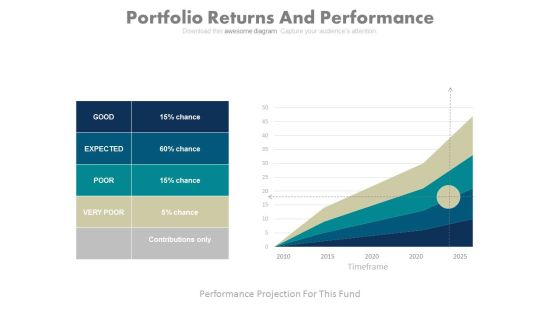
Portfolio Returns And Performance Chart Ppt Slides
This is a portfolio returns and performance chart ppt slides. This is a five stage process. The stages in this process are business, finance, marketing.
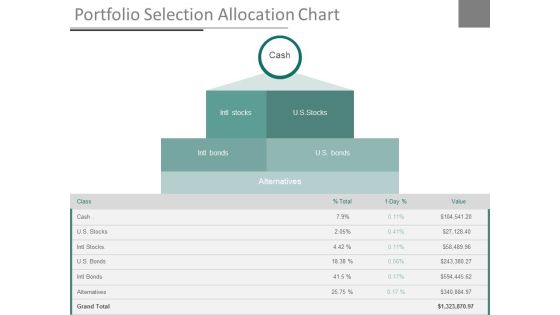
Portfolio Selection Allocation Chart Ppt Slides
This is a portfolio selection allocation chart ppt slides. This is a one stage process. The stages in this process are business, finance, marketing.

Risk Reward Matrix Chart Ppt Slides
This is a risk reward matrix chart ppt slides. This is a four stage process. The stages in this process are business, marketing, success.
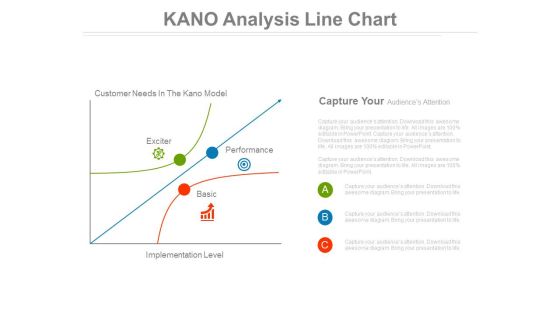
Kano Analysis Line Chart Ppt Slides
This is a kano analysis line chart ppt slides. This is a three stage process. The stages in this process are marketing, business.\n\n
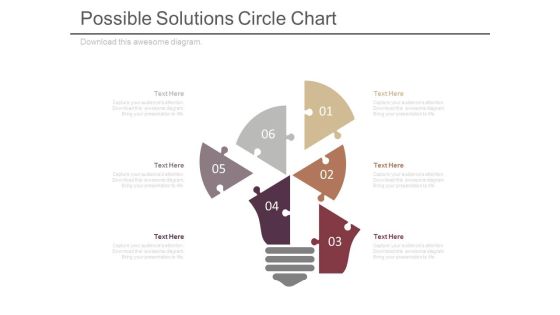
Possible Solutions Circle Chart Ppt Slides
This is a possible solutions circle chart ppt slides. This is a six stage process. The stages in this process are puzzles or jigsaws, business, technology, light bulbs.\n\n\n\n
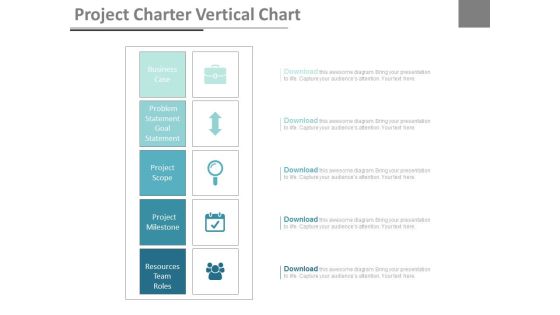
Project Charter Vertical Chart Ppt Slides
This is a project charter vertical chart ppt slides. This is a five stage process. The stages in this process are marketing, business, success.\n\n

Customer Service Benchmarking Chart Ppt Slides
This is a customer service benchmarking chart ppt slides. This is a eight stage process. The stages in this process are finance, business, marketing.

Sales Performance Measures Chart Ppt Sample
This is a sales performance measures chart ppt sample. This is a three stage process. The stages in this process are product, relationship, service, sales.
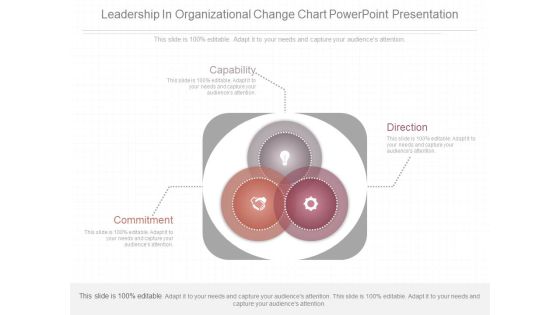
Leadership In Organizational Change Chart Powerpoint Presentation
This is a leadership in organizational change chart powerpoint presentation. This is a three stage process. The stages in this process are capability, direction, commitment.

Customer Centered Capabilities Chart Ppt Slides
This is a customer centered capabilities chart ppt slides. This is a five stage process. The stages in this process are community, operations, people, finance, customer.

Great Team Building Ideas Chart Presentation Graphics
This is a great team building ideas chart presentation graphics. This is a four stage process. The stages in this process are goal, reality, options, way forward.

Continuous Strategic Adaptation Chart Ppt Slide
This is a continuous strategic adaptation chart ppt slide. This is a five stage process. The stages in this process are creating, producing, selling, delivering, supporting.
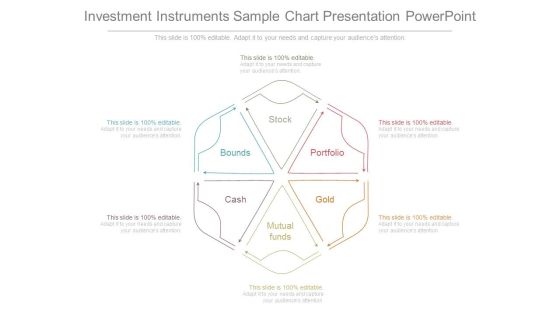
Investment Instruments Sample Chart Presentation Powerpoint
This is a investment instruments sample chart presentation powerpoint. This is a six stage process. The stages in this process are stock, portfolio, gold, mutual funds, cash, bounds.
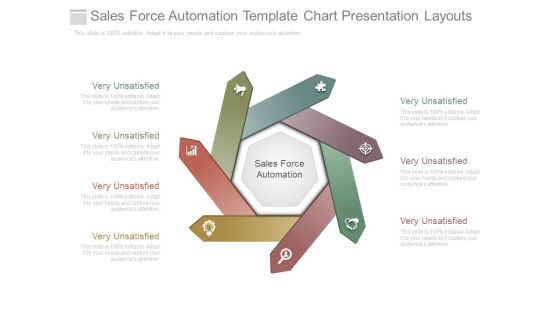
Sales Force Automation Template Chart Presentation Layouts
This is a sales force automation template chart presentation layouts. This is a seven stage process. The stages in this process are sales force automation, very unsatisfied.

Continuous Strategic Adaptation Chart Powerpoint Slides
This is a continuous strategic adaptation chart powerpoint slides. This is a four stage process. The stages in this process are market performance, market, strategy, culture, talent, leadership.

Innovation Finance Networks Chart Ppt Sample
This is a innovation finance networks chart ppt sample. This is a four stage process. The stages in this process are equality, crowdsourcing, construction, medical device.

Customer Satisfaction Dashboard Chart Presentation Layouts
This is a customer satisfaction dashboard chart presentation layouts. This is a five stage process. The stages in this process are very satisfied, satisfied, unsatisfied, natural, very unsatisfied.
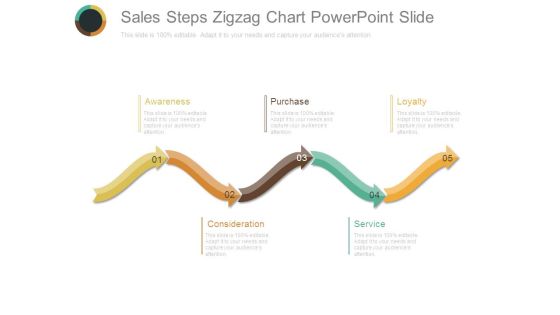
Sales Steps Zigzag Chart Powerpoint Slide
This is a sales steps zigzag chart powerpoint slide. This is a five stage process. The stages in this process are awareness, purchase, loyalty, consideration, service.
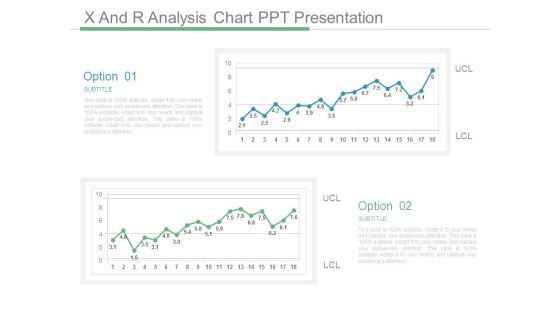
X And R Analysis Chart Ppt Presentation
This is a x and r analysis chart ppt presentation. This is a two stage process. The stages in this process are subtitle, ucl, lcl, option.

Key Skills Circle Chart Ppt Infographics
This is a key skills circle chart ppt infographics. This is a five stage process. The stages in this process are questioning, researching, analyzing, evaluating, communicating, key skills.

Demographic Segmentation Timeline Chart Ppt Background
This is a demographic segmentation timeline chart ppt background. This is a five stage process. The stages in this process are industry, company size, location.

Aim Of Mission Statement Chart Ppt Samples
This is a aim of mission statement chart ppt samples. This is a three stage process. The stages in this process are vision, values, mission.

Engineering Team Target Chart Powerpoint Show
This is a engineering team target chart powerpoint show. This is a four stage process. The stages in this process are areas of focus, result, metric, area.
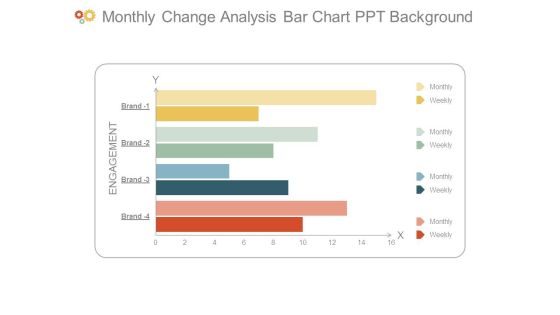
Monthly Change Analysis Bar Chart Ppt Background
This is a monthly change analysis bar chart ppt background. This is a four stage process. The stages in this process are engagement, monthly, weekly, brand.
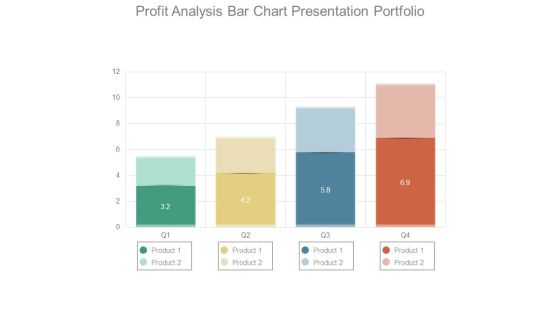
Profit Analysis Bar Chart Presentation Portfolio
This is a profit analysis bar chart presentation portfolio. This is a four stage process. The stages in this process are product.
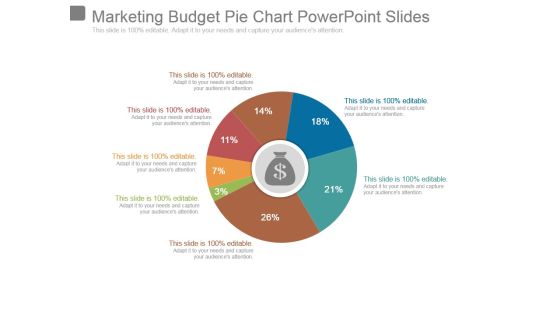
Marketing Budget Pie Chart Powerpoint Slides
This is a marketing budget pie chart powerpoint slides. This is a seven stage process. The stages in this process are business, marketing, strategy, finance, percentage.
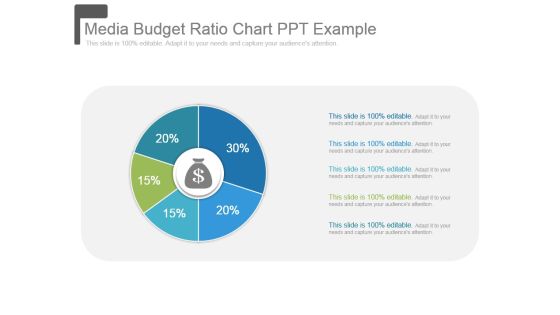
Media Budget Ratio Chart Ppt Example
This is a media budget ratio chart ppt example. This is a five stage process. The stages in this process are strategy, finance, percentage, business, marketing.
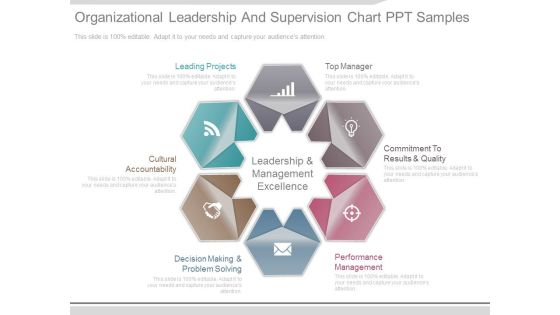
Organizational Leadership And Supervision Chart Ppt Samples
This is a organizational leadership and supervision chart ppt samples. This is a six stage process. The stages in this process are leading projects, top manager, commitment to results and quality, performance management, decision making and problem solving, cultural accountability, leadership and management excellence.

Behavioral Segmentation Flow Chart Powerpoint Graphics
This is a behavioral segmentation flow chart powerpoint graphics. This is a six stage process. The stages in this process are target market, negative opinion, neutral, favorable opinion, unaware, aware, not tried, rejecter, not yet repeated, loyal to other brand, switcher, light user, regular user.
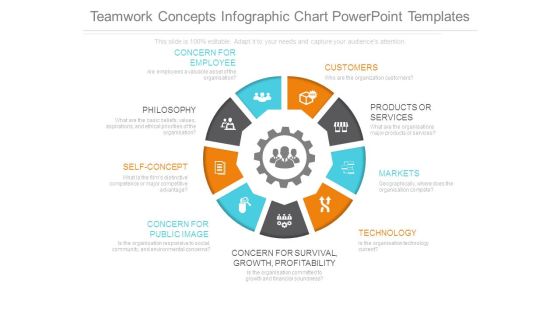
Teamwork Concepts Infographic Chart Powerpoint Templates
This is a teamwork concepts infographic chart powerpoint templates. This is a nine stage process. The stages in this process are concern for survival growth profitability, concern for employee, customers, products or services, markets, technology, concern for public image, self concept, philosophy.

Area Chart Ppt PowerPoint Presentation Model Slides
This is a area chart ppt powerpoint presentation model slides. This is a two stage process. The stages in this process are business, marketing, sales in percentage, chart, percentage, finance.

Area Chart Ppt PowerPoint Presentation Model Inspiration
This is a area chart ppt powerpoint presentation model inspiration. This is a two stage process. The stages in this process are financial year, in percentage, area chart, business, marketing.

Area Chart Ppt PowerPoint Presentation Layouts Images
This is a area chart ppt powerpoint presentation layouts images. This is a two stage process. The stages in this process are product, sales in percentage, area chart, percentage, finance.

Area Chart Ppt PowerPoint Presentation Inspiration Professional
This is a area chart ppt powerpoint presentation inspiration professional. This is a two stage process. The stages in this process are financial year, in percentage, area chart, finance, business, marketing.

Area Chart Ppt PowerPoint Presentation Infographics Good
This is a area chart ppt powerpoint presentation infographics good. This is a two stage process. The stages in this process are sales in percentage, product, area chart, business, percentage.

Area Chart Ppt PowerPoint Presentation Ideas Professional
This is a area chart ppt powerpoint presentation ideas professional. This is a two stage process. The stages in this process are business, sales in percentage, area chart, marketing, finance.

Area Chart Ppt PowerPoint Presentation Inspiration Themes
This is a area chart ppt powerpoint presentation inspiration themes. This is a two stage process. The stages in this process are sales in percentage, product, area chart, business, marketing.

Combo Chart Ppt PowerPoint Presentation Inspiration Information
This is a combo chart ppt powerpoint presentation inspiration information. This is a eight stage process. The stages in this process are business, strategy, analysis, planning, combo chart, market size, growth rate.

Banking Management Hierarchy Chart Powerpoint Slide Ideas
This is a banking management hierarchy chart powerpoint slide ideas. This is a three stage process. The stages in this process are board of directors, chief executive officer, chief operating, general managers, deputy general managers, assistant general managers, principal officers, senior officers, clerical staff members, non clerical staff members.
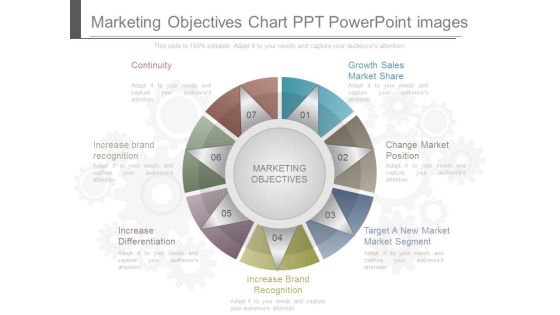
Marketing Objectives Chart Ppt Powerpoint Images
This is a marketing objectives chart ppt powerpoint images. This is a seven stage process. The stages in this process are continuity, growth sales market share, change market position, target a new market market segment, increase brand recognition, increase differentiation, increase brand recognition, marketing objectives.
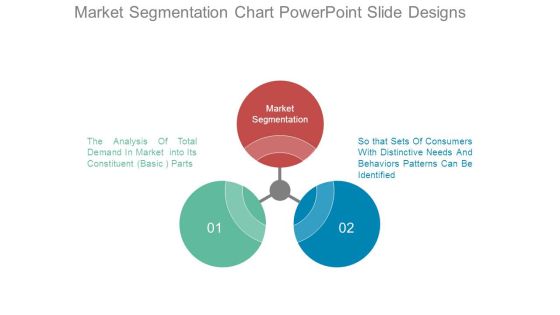
Market Segmentation Chart Powerpoint Slide Designs
This is a market segmentation chart powerpoint slide designs. This is a three stage process. The stages in this process are market segmentation, so that sets of consumers with distinctive needs and behaviors patterns can be identified, the analysis of total demand in market into its constituent basic parts.

Staffing Solution Flow Chart Ppt Background Template
This is a staffing solution flow chart ppt background template. This is a five stage process. The stages in this process are business, success, strategy, management, icons.
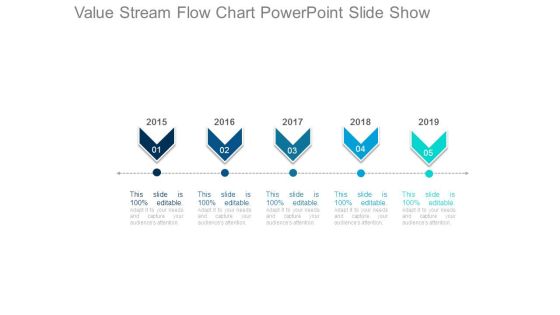
Value Stream Flow Chart Powerpoint Slide Show
This is a value stream flow chart powerpoint slide show. This is a five stage process. The stages in this process are timeline, future, years, planning, marketing, business.
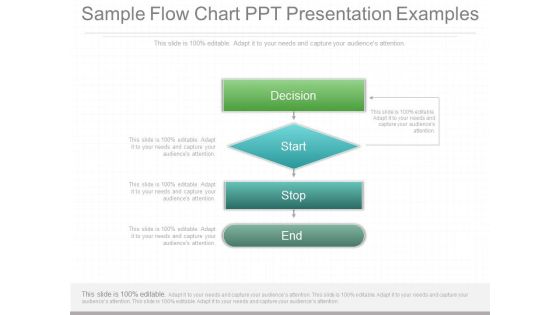
Sample Flow Chart Ppt Presentation Examples
This is a sample flow chart ppt presentation examples. This is a four stage process. The stages in this process are decision, start, stop, end.

Competitors Mapping Chart Ppt Examples Professional
This is a competitors mapping chart ppt examples professional. This is a six stage process. The stages in this process are competitor, series.

Business Model Chart Powerpoint Slide Show
This is a business model chart powerpoint slide show. This is a four stage process. The stages in this process are free.

Economic Order Quantity Chart Ppt Example File
This is a economic order quantity chart ppt example file. This is a four stage process. The stages in this process are inventory cost, ordering, carrying, eoq model.

Project Construction Schedule Chart Powerpoint Slide Backgrounds
This is a project construction schedule chart powerpoint slide backgrounds. This is a five stage process. The stages in this process are approach, inventory, analysis, construction, concepts.
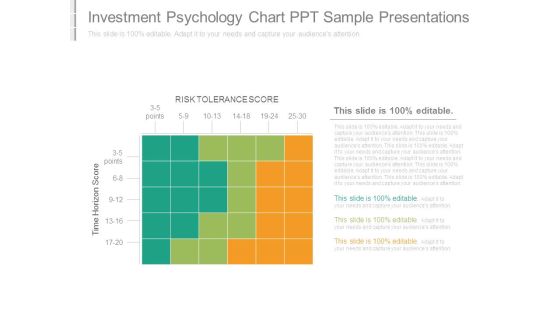
Investment Psychology Chart Ppt Sample Presentations
This is a investment psychology chart ppt sample presentations. This is a three stage process. The stages in this process are risk tolerance score, time horizon score.

Big Data Solution Chart Diagram Ppt Slides
This is a big data solution chart diagram ppt slides. This is a four stage process. The stages in this process are design, decide, deposit, discover.
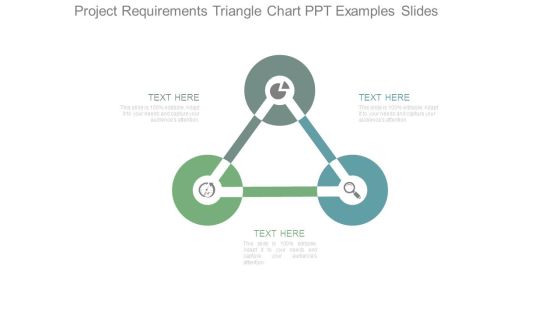
Project Requirements Triangle Chart Ppt Examples Slides
This is a project requirements triangle chart ppt examples slides. This is a three stage process. The stages in this process are triangle, business, marketing, management, icons, diagram.
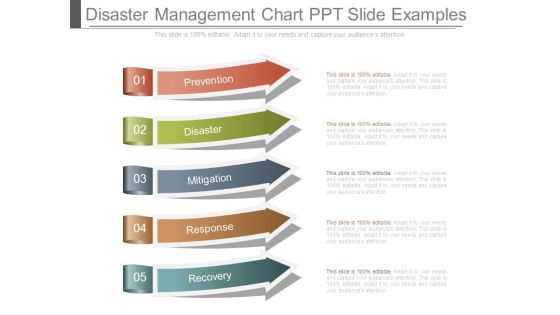
Disaster Management Chart Ppt Slide Examples
This is a disaster management chart ppt slide examples. This is a five stage process. The stages in this process are prevention, disaster, mitigation, response, recovery.
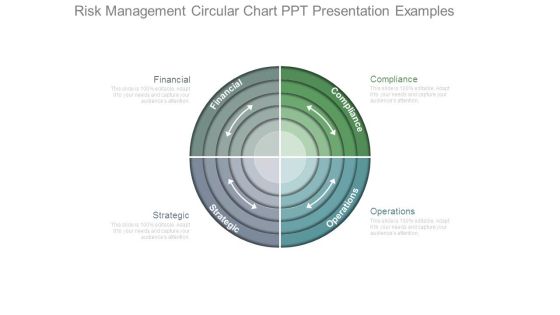
Risk Management Circular Chart Ppt Presentation Examples
This is a risk management circular chart ppt presentation examples. This is a four stage process. The stages in this process are financial, compliance, strategic, operations.
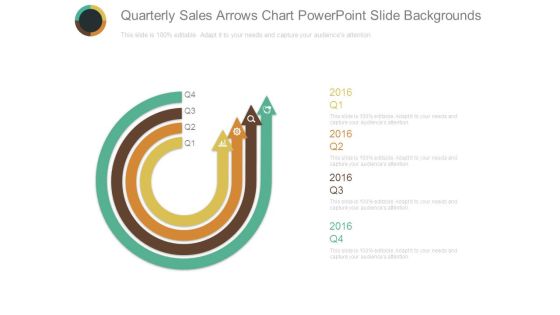
Quarterly Sales Arrows Chart Powerpoint Slide Backgrounds
This is a quarterly sales arrows chart powerpoint slide backgrounds. This is a four stage process. The stages in this process are arrows, business, management, marketing, icons.

Money Expenditure Analysis Chart Ppt Background Graphics
This is a money expenditure analysis chart ppt background graphics. This is a twelve stage process. The stages in this process are icons, strategy, business, marketing, presentation.

Win Loss Analysis Chart Powerpoint Presentation Templates
This is a win loss analysis chart powerpoint presentation templates. This is a two stage process. The stages in this process are business, management, marketing, sales, funnel.
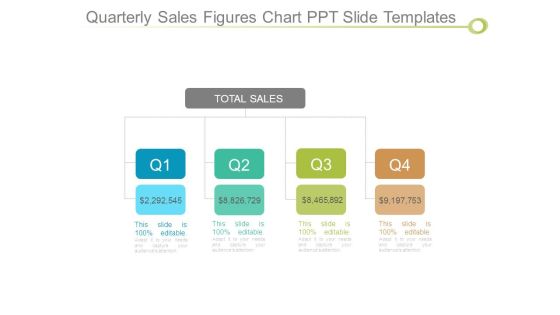
Quarterly Sales Figures Chart Ppt Slide Templates
This is a quarterly sales figures chart ppt slide templates. This is a four stage process. The stages in this process are total sales, business, management, marketing, success.

Three Arrows Voc Chart Powerpoint Presentation Examples
This is a three arrows voc chart powerpoint presentation examples. This is a three stage process. The stages in this process are business, management, marketing, arrow, strategy.
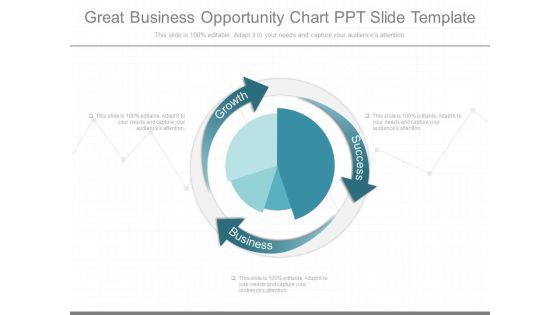
Great Business Opportunity Chart Ppt Slide Template
This is a great business opportunity chart ppt slide template. This is a four stage process. The stages in this process are growth, success, business.

Financial Growth Chart Ppt Background Designs
This is a financial growth chart ppt background designs. This is a five stage process. The stages in this process are financial growth.\n\n\n\n\n\n\n\n\n\n\n\n\n\n\n\n\n\n

Best Business Accounting Chart Example Ppt Slides
This is a best business accounting chart example ppt slides. This is a four stage process. The stages in this process are tax, audit, balances, book keeping.

Business Training Components Chart Sample Presentation Ppt
This is a business training components chart sample presentation ppt. This is a three stage process. The stages in this process are training, knowledge, skills, competencies.

Business Organizational Chart Powerpoint Templates Download
This is a business organizational chart powerpoint templates download. This is a four stage process. The stages in this process are marketing, sales, production, finance.
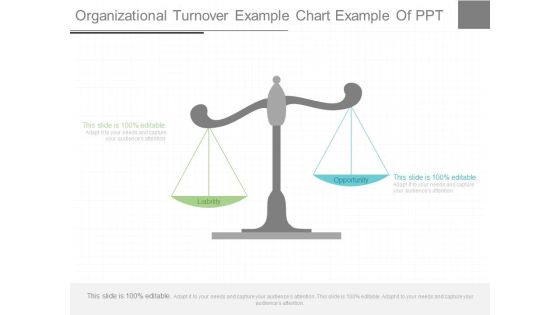
Organizational Turnover Example Chart Example Of Ppt
This is a organizational turnover example chart example of ppt. This is a two stage process. The stages in this process are liability, opportunity.

Cost Structure Analysis Chart Ppt Slides Download
This is a cost structure analysis chart ppt slides download. This is a three stage process. The stages in this process are cost analysis, benefit, cost tracking.
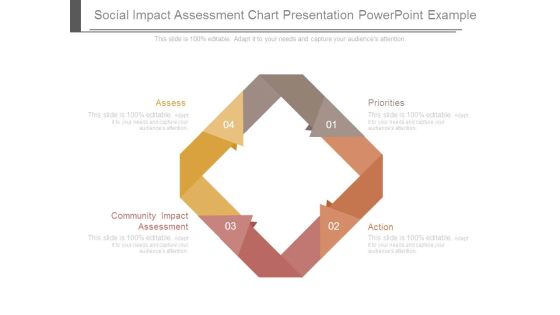
Social Impact Assessment Chart Presentation Powerpoint Example
This is a social impact assessment chart presentation powerpoint example. This is a four stage process. The stages in this process are assess, community impact assessment, priorities, action.
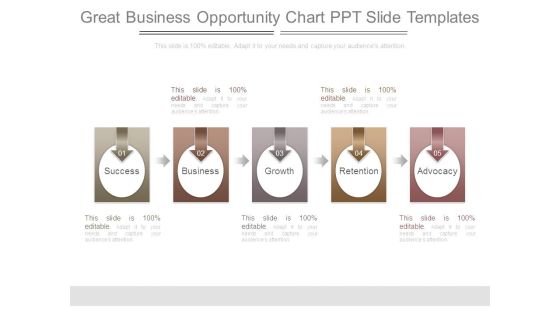
Great Business Opportunity Chart Ppt Slide Templates
This is a great business opportunity chart ppt slide templates. This is a five stage process. The stages in this process are success, business, growth, retention, advocacy.

Trading Mark Strategy Chart Ppt Examples Professional
This is a trading mark strategy chart ppt examples professional. This is a three stage process. The stages in this process are strategic analysis, strategy implementation, strategic choice.
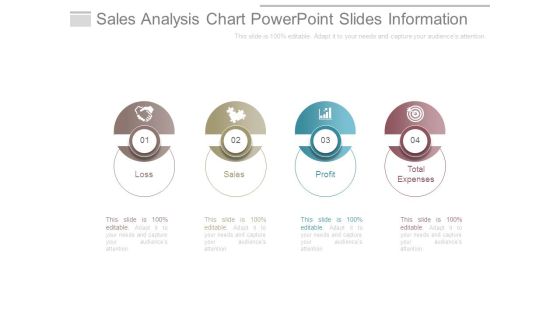
Sales Analysis Chart Powerpoint Slides Information
This is a sales analysis chart powerpoint slides information. This is a four stage process. The stages in this process are loss, sales, profit, total expenses.

Alternative Assessment Chart Powerpoint Slide Designs
This is a alternative assessment chart powerpoint slide designs. This is a two stage process. The stages in this process are business, marketing, percentage, finance, success.
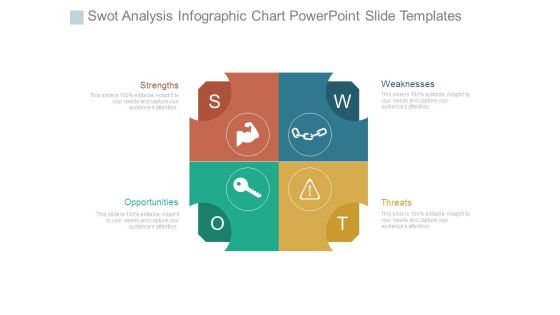
Swot Analysis Infographic Chart Powerpoint Slide Templates
This is a swot analysis infographic chart powerpoint slide templates. This is a four stage process. The stages in this process are strengths, opportunities, threats, weaknesses.

Sales Steps Arrow Chart Presentation Background Images
This is a sales steps arrow chart presentation background images. This is a five stage process. The stages in this process are awareness, consideration, purchase, service, loyalty.
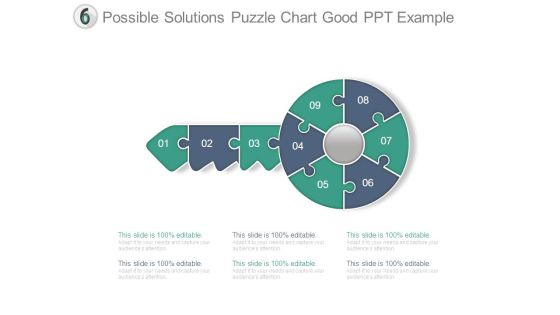
Possible Solutions Puzzle Chart Good Ppt Example
This is a possible solutions puzzle chart good ppt example. This is a nine stage process. The stages in this process are solution, puzzle, key, strategy, game, marketing.

Personal Characteristics Chart Ppt Slides Download
This is a personal characteristics chart ppt slides download. This is a two stage process. The stages in this process are loyalty, attitude, personal characteristics.

 Home
Home