Plan

Iot Applications For Manufacturing Industry Column Chart Ideas PDF
This slide highlights the IoT implementation drivers for manufacturing and production sector which showcases it will improve operational efficiency, asset utilization and business process development. Do you have an important presentation coming up Are you looking for something that will make your presentation stand out from the rest Look no further than Iot Applications For Manufacturing Industry Column Chart Ideas PDF. With our professional designs, you can trust that your presentation will pop and make delivering it a smooth process. And with Slidegeeks, you can trust that your presentation will be unique and memorable. So why wait Grab Iot Applications For Manufacturing Industry Column Chart Ideas PDF today and make your presentation stand out from the rest.

Overall Cost Associated To B2B Demand Generation Optimization And Sales Enablement Initiatives Pictures PDF
This slide provides information regarding overall cost associated to B2B demand generation optimization and sales enablement initiatives such as training expenses, social media campaigns execution costs, etc. Coming up with a presentation necessitates that the majority of the effort goes into the content and the message you intend to convey. The visuals of a PowerPoint presentation can only be effective if it supplements and supports the story that is being told. Keeping this in mind our experts created Overall Cost Associated To B2B Demand Generation Optimization And Sales Enablement Initiatives Pictures PDF to reduce the time that goes into designing the presentation. This way, you can concentrate on the message while our designers take care of providing you with the right template for the situation.

Determining Most Successful Market Leader In The Industry Ppt PowerPoint Presentation File Professional PDF
The following slide showcases a matrix through which executives can find out the most successful competitor in the same industry. The comparison is drawn on the basis of product offerings, headquartered, number of offices, established in, total employees, previous year annual sales, and total market share. Find highly impressive Determining Most Successful Market Leader In The Industry Ppt PowerPoint Presentation File Professional PDF on Slidegeeks to deliver a meaningful presentation. You can save an ample amount of time using these presentation templates. No need to worry to prepare everything from scratch because Slidegeeks experts have already done a huge research and work for you. You need to download Determining Most Successful Market Leader In The Industry Ppt PowerPoint Presentation File Professional PDF for your upcoming presentation. All the presentation templates are 100 percent editable and you can change the color and personalize the content accordingly. Download now.

Quarter Wise Gross Margin Improvement Chart Ppt Slide
This is a quarter wise gross margin improvement chart ppt slide. This is a two stage process. The stages in this process are graph, business, growth, marketing.
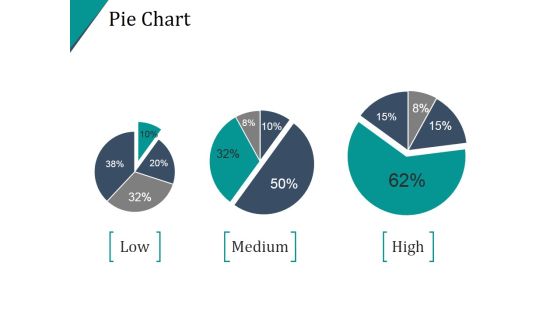
Pie Chart Template Ppt PowerPoint Presentation Example 2015
This is a pie chart template ppt powerpoint presentation example 2015. This is a four stage process. The stages in this process are pie, division, percentage, finance, analysis.

Scatter Chart Ppt PowerPoint Presentation Visual Aids Deck
This is a scatter chart ppt powerpoint presentation visual aids deck. This is a five stage process. The stages in this process are scatter, business, marketing, success, growth.

Bar Chart Ppt PowerPoint Presentation Visual Aids Files
This is a bar chart ppt powerpoint presentation visual aids files. This is a seven stage process. The stages in this process are bar, graph, finance, business, marketing.
Pie Chart Ppt PowerPoint Presentation Icon Graphics Download
This is a pie chart ppt powerpoint presentation icon graphics download. This is a four stage process. The stages in this process are pie, finance, analysis, marketing, percentage.
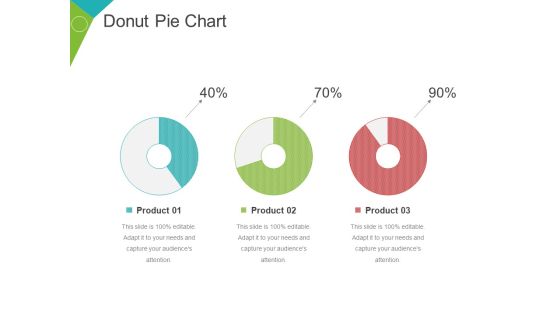
Donut Pie Chart Ppt PowerPoint Presentation Inspiration Guidelines
This is a donut pie chart ppt powerpoint presentation inspiration guidelines. This is a three stage process. The stages in this process are finance, percentage, business, marketing, management.

Bar Chart Ppt PowerPoint Presentation Show Example File
This is a bar chart ppt powerpoint presentation show example file. This is a two stage process. The stages in this process are product, business, marketing, graph, percentage.

High Low Close Chart Ppt PowerPoint Presentation Portfolio Gridlines
This is a high low close chart ppt powerpoint presentation portfolio gridlines. This is a one stage process. The stages in this process are high, product, volume, low.

Donut Pie Chart Ppt PowerPoint Presentation Portfolio Vector
This is a donut pie chart ppt powerpoint presentation portfolio vector. This is a four stage process. The stages in this process are percentage, finance, donut, business.
Scatter Bubble Chart Ppt PowerPoint Presentation Gallery Icons
This is a scatter bubble chart ppt powerpoint presentation gallery icons. This is a three stage process. The stages in this process are product, finance, business, marketing.

Bubble Chart Ppt PowerPoint Presentation Pictures Slide Download
This is a bubble chart ppt powerpoint presentation pictures slide download. This is a three stage process. The stages in this process are product, business, graph, finance.
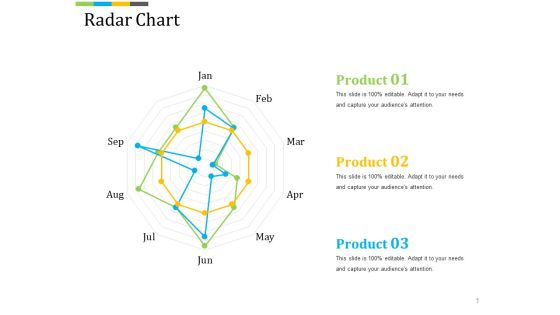
Radar Chart Ppt PowerPoint Presentation Summary Master Slide
This is a radar chart ppt powerpoint presentation summary master slide. This is a three stage process. The stages in this process are product, business, marketing, finance.
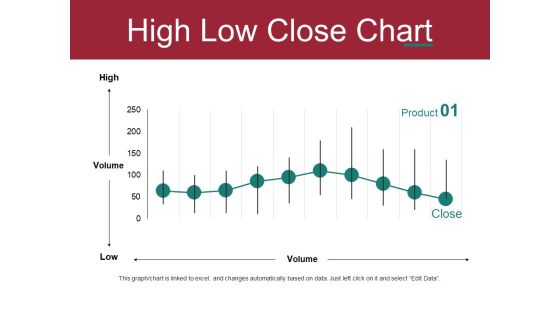
High Low Close Chart Ppt PowerPoint Presentation Deck
This is a high low close chart ppt powerpoint presentation deck. This is a one stage process. The stages in this process are high, volume, low, business, finance.
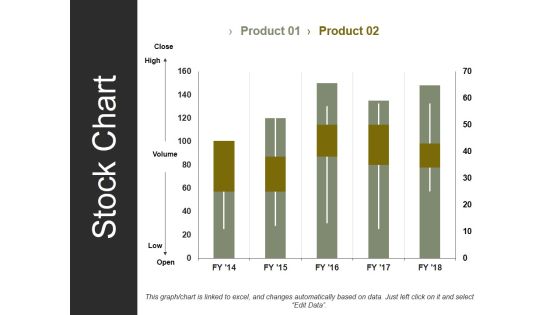
Stock Chart Ppt PowerPoint Presentation Infographic Template Infographics
This is a stock chart ppt powerpoint presentation infographic template infographics. This is a two stage process. The stages in this process are high, volume, low, business, marketing.

Pie Chart Ppt PowerPoint Presentation Professional Graphic Images
This is a pie chart ppt powerpoint presentation professional graphic images. This is a four stage process. The stages in this process are product, percentage, pie, finance, business.
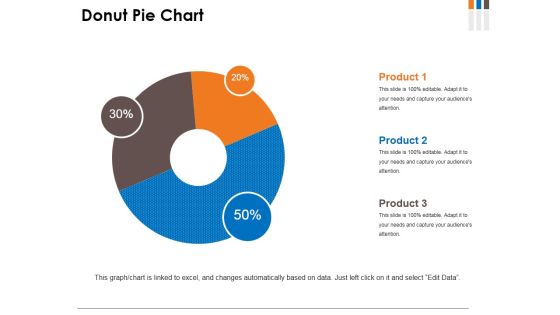
Donut Pie Chart Ppt PowerPoint Presentation Infographics Model
This is a donut pie chart ppt powerpoint presentation infographics model. This is a three stage process. The stages in this process are donut, business, marketing, percentage, finance.

Donut Pie Chart Ppt PowerPoint Presentation Professional Influencers
This is a donut pie chart ppt powerpoint presentation professional influencers. This is a five stage process. The stages in this process are product, percentage, finance, donut, business.

Radar Chart Ppt PowerPoint Presentation Styles Layout Ideas
This is a radar chart ppt powerpoint presentation styles layout ideas. This is a two stage process. The stages in this process are business, marketing, graph, finance, analysis.
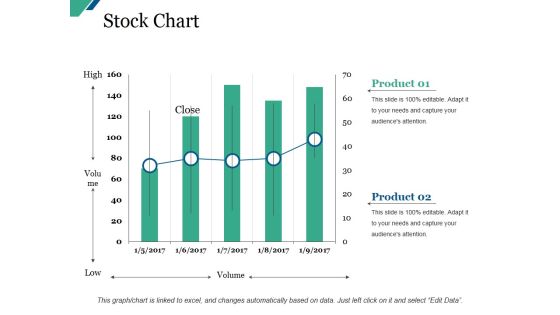
Stock Chart Ppt PowerPoint Presentation Inspiration Background Image
This is a stock chart ppt powerpoint presentation inspiration background image. This is a five stage process. The stages in this process are business, marketing, graph, finance, analysis.
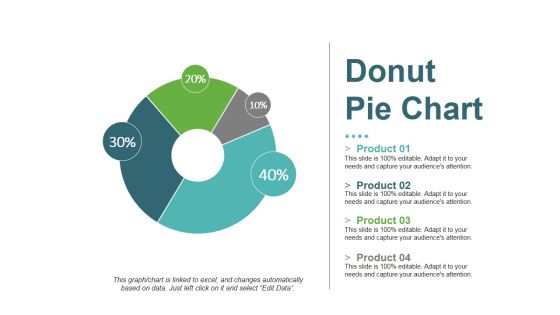
Donut Pie Chart Ppt PowerPoint Presentation Portfolio Sample
This is a donut pie chart ppt powerpoint presentation portfolio sample. This is a four stage process. The stages in this process are product, donut, percentage, finance, process.
Volume High Low Close Chart Ppt PowerPoint Presentation Pictures Icons
This is a volume high low close chart ppt powerpoint presentation pictures icons. This is a two stage process. The stages in this process are high, volume, low.

Donut Pie Chart Ppt PowerPoint Presentation Layouts Visuals
This is a donut pie chart ppt powerpoint presentation layouts visuals. This is a five stage process. The stages in this process are product, donut, percentage, finance, business.

Donut Pie Chart Ppt PowerPoint Presentation Ideas Guide
This is a donut pie chart ppt powerpoint presentation ideas guide. This is a four stage process. The stages in this process are percentage, finance, donut, business, shapes.

Combo Chart Ppt PowerPoint Presentation Summary Graphics Example
This is a combo chart ppt powerpoint presentation summary graphics example. This is a three stage process. The stages in this process are product, growth, marketing.

Stacked Line Chart Ppt PowerPoint Presentation Styles Graphics
This is a stacked line chart ppt powerpoint presentation styles graphics. This is a two stage process. The stages in this process are product, year, profit, percentage, growth.

Column Chart Ppt PowerPoint Presentation Model Graphics Example
This is a column chart ppt powerpoint presentation model graphics example. This is a two stage process. The stages in this process are expenditure in, product, years.

Donut Pie Chart Ppt PowerPoint Presentation Show Introduction
This is a donut pie chart ppt powerpoint presentation show introduction. This is a five stage process. The stages in this process are percentage, finance, donut, business, product.

Donut Pie Chart Ppt PowerPoint Presentation Styles Example
This is a donut pie chart ppt powerpoint presentation styles example. This is a four stage process. The stages in this process are percentage, finance, donut, business, product.

Pareto Chart Template 2 Ppt PowerPoint Presentation Gallery Microsoft
This is a pareto chart template 2 ppt powerpoint presentation gallery microsoft. This is a eight stage process. The stages in this process are failure time, observations, category.

Scatter Bubble Chart Ppt PowerPoint Presentation Summary Slides
This is a scatter bubble chart ppt powerpoint presentation summary slides. This is a one stage process. The stages in this process are product, profit, in percentage.
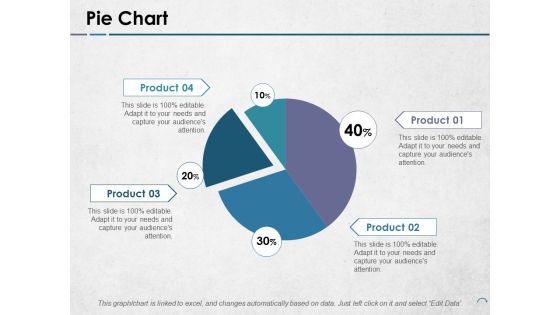
Pie Chart Ppt PowerPoint Presentation Infographics Example Topics
This is a pie chart ppt powerpoint presentation infographics example topics. This is a four stage process. The stages in this process are product, pie, process, percentage, finance.

Bar Chart Ppt PowerPoint Presentation Professional Clipart Images
This is a bar chart ppt powerpoint presentation professional clipart images. This is a three stage process. The stages in this process are business, finance, analysis, investment, marketing.

Area Chart Finance Ppt PowerPoint Presentation Gallery Elements
This is a area chart finance ppt powerpoint presentation gallery elements. This is a two stage process. The stages in this process are finance, marketing, management, investment, analysis.
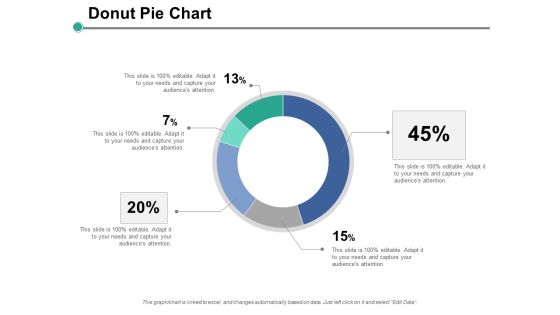
Donut Pie Chart Ppt PowerPoint Presentation Layouts Backgrounds
This is a donut pie chart ppt powerpoint presentation layouts backgrounds. This is a five stage process. The stages in this process are finance, marketing, management, investment, analysis.

Bar Chart Financial Ppt PowerPoint Presentation Pictures Files
This is a bar chart financial ppt powerpoint presentation pictures files. This is a five stage process. The stages in this process are finance, marketing, management, investment, analysis.

Column Chart Ppt PowerPoint Presentation Slides Example Topics
This is a column chart ppt powerpoint presentation slides example topics. This is a two stage process. The stages in this process are finance, marketing, management, investment, analysis.

Area Chart Financial Ppt PowerPoint Presentation Layouts Slide
This is a area chart financial ppt powerpoint presentation layouts slide. This is a three stage process. The stages in this process are finance, marketing, management, investment, analysis.

Clustered Bar Chart Ppt PowerPoint Presentation Layouts Infographics
This is a clustered bar chart ppt powerpoint presentation layouts infographics. This is a three stage process. The stages in this process are finance, marketing, management, investment, analysis.

Area Chart Financial Ppt PowerPoint Presentation Inspiration Topics
This is a area chart financial ppt powerpoint presentation inspiration topics. This is a three stage process. The stages in this process are finance, marketing, management, investment, analysis.

Combo Chart Ppt PowerPoint Presentation Visual Aids Pictures
This is a combo chart ppt powerpoint presentation visual aids pictures. This is a three stage process. The stages in this process are finance, marketing, management, investment, analysis.
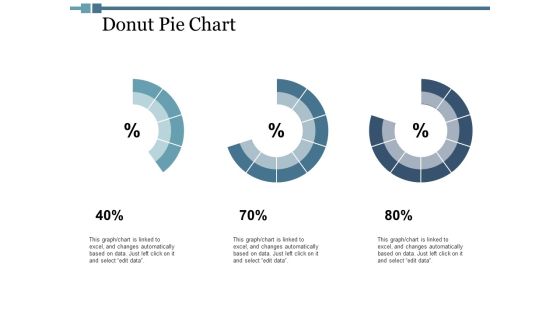
Donut Pie Chart Ppt PowerPoint Presentation Inspiration Brochure
This is a donut pie chart ppt powerpoint presentation inspiration brochure. This is a three stage process. The stages in this process are finance, marketing, management, investment, analysis.

Scatter Chart Finance Ppt PowerPoint Presentation Ideas Show
This is a scatter chart finance ppt powerpoint presentation ideas show. This is a two stage process. The stages in this process are finance, marketing, analysis, business, investment.

Pareto Chart Ppt PowerPoint Presentation Styles File Formats
This is a pareto chart ppt powerpoint presentation styles file formats. This is a ten stage process. The stages in this process are Product, Percentage, Business, Marketing.

Area Chart Finance Ppt PowerPoint Presentation Slides Layout
This is a area chart finance ppt powerpoint presentation slides layout. This is a two stage process. The stages in this process are finance, marketing, management, investment, analysis.

Clustered Bar Chart Ppt PowerPoint Presentation Professional Good
This is a clustered bar chart ppt powerpoint presentation professional good. This is a three stage process. The stages in this process are finance, marketing, management, investment, analysis.

Combo Chart Ppt PowerPoint Presentation Visual Aids Files
This is a combo chart ppt powerpoint presentation visual aids files. This is a three stage process. The stages in this process are finance, marketing, management, investment, analysis.

Area Chart Financial Ppt PowerPoint Presentation Model Background
This is a area chart financial ppt powerpoint presentation model background. This is a two stage process. The stages in this process are finance, marketing, management, investment, analysis.

Area Chart Investment Ppt PowerPoint Presentation Infographics Summary
This is a area chart investment ppt powerpoint presentation infographics summary. This is a three stage process. The stages in this process are finance, marketing, management, investment, analysis.

Clustered Bar Chart Ppt PowerPoint Presentation Summary Templates
This is a clustered bar chart ppt powerpoint presentation summary templates. This is a three stage process. The stages in this process are finance, marketing, management, investment, analysis.

Pie Chart Finance Ppt PowerPoint Presentation Inspiration Introduction
This is a pie chart finance ppt powerpoint presentation inspiration introduction. This is a three stage process. The stages in this process are finance, marketing, analysis, business, investment.

Bar Chart Slide Ppt PowerPoint Presentation Summary Example File
This is a bar chart slide ppt powerpoint presentation summary example file. This is a three stage process. The stages in this process are percentage, marketing, management, product.

Clustered Column Chart Ppt PowerPoint Presentation Slides Information
This is a clustered column chart ppt powerpoint presentation slides information. This is a two stage process. The stages in this process are percentage, product, business, marketing.
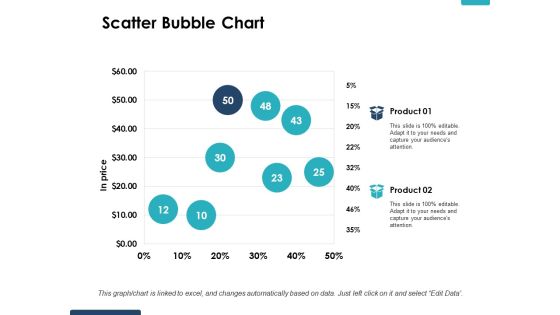
Scatter Bubble Chart Ppt PowerPoint Presentation Layouts Gridlines
This is a scatter bubble chart ppt powerpoint presentation layouts gridlines. This is a two stage process. The stages in this process are percentage, product, business, marketing.

Combo Chart Ppt PowerPoint Presentation Styles Format Ideas
This is a combo chart ppt powerpoint presentation styles format ideas. This is a three stage process. The stages in this process are percentage, product, marketing.
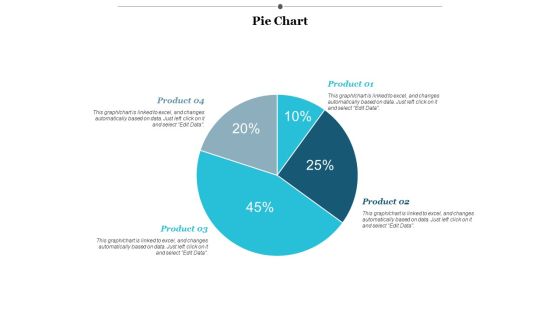
Pie Chart Finance Ppt PowerPoint Presentation Layouts Designs
This is a Pie Chart Finance Ppt PowerPoint Presentation Layouts Designs. This is a four stage process. The stages in this process are finance, marketing, management, investment, analysis.

Column Chart Investment Ppt PowerPoint Presentation Show Diagrams
This is a column chart investment ppt powerpoint presentation show diagrams. This is a three stage process. The stages in this process are finance, analysis, business, investment, marketing.

Column Chart Investment Ppt PowerPoint Presentation Professional Pictures
This is a column chart investment ppt powerpoint presentation professional pictures. This is a three stage process. The stages in this process are finance, analysis, business, investment, marketing.

Donut Pie Chart Ppt PowerPoint Presentation Gallery Design Ideas
This is a donut pie chart ppt powerpoint presentation gallery design ideas. This is a five stage process. The stages in this process are business, marketing, percentage, product.

Bar Chart Finance Ppt PowerPoint Presentation Portfolio Model
This is a bar chart finance ppt powerpoint presentation portfolio model. This is a two stage process. The stages in this process are finance, marketing, management, investment, analysis.

Pie Chart Finance Ppt PowerPoint Presentation Model Ideas
This is a pie chart finance ppt powerpoint presentation model ideas. This is a four stage process. The stages in this process are finance, marketing, management, investment, analysis.

Stacked Bar Chart Ppt PowerPoint Presentation Gallery Outfit
This is a stacked bar chart ppt powerpoint presentation gallery outfit. This is a three stage process. The stages in this process are finance, marketing, management, investment, analysis.
Pie Chart Ppt PowerPoint Presentation Icon Infographic Template
This is a pie chart ppt powerpoint presentation icon infographic template. This is a three stage process. The stages in this process are percentage, product, management, business.

Area Chart Ppt PowerPoint Presentation File Design Inspiration
This is a area chart ppt powerpoint presentation file design inspiration. This is a three stage process. The stages in this process are percentage, product, business, management, marketing.

Donut Pie Chart Ppt PowerPoint Presentation Inspiration Elements
This is a donut pie chart ppt powerpoint presentation inspiration elements. This is a three stage process. The stages in this process are percentage, product, business, management, marketing.

Combo Chart Financial Ppt PowerPoint Presentation Layouts Layouts
This is a combo chart financial ppt powerpoint presentation layouts layouts. This is a three stage process. The stages in this process are finance, marketing, management, investment, analysis.
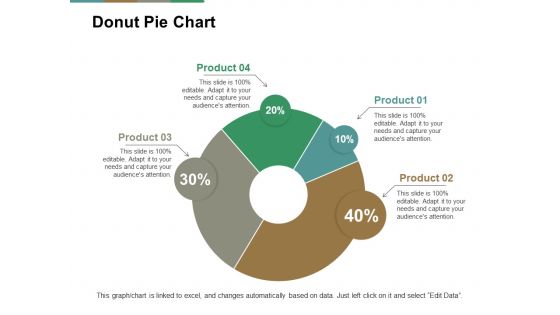
Donut Pie Chart Ppt PowerPoint Presentation Pictures Summary
This is a donut pie chart ppt powerpoint presentation pictures summary. This is a four stage process. The stages in this process are percentage, product, business, management, marketing.

Combo Chart Finance Ppt PowerPoint Presentation Portfolio Templates
This is a combo chart finance ppt powerpoint presentation portfolio templates. This is a three stage process. The stages in this process are finance, analysis, business, investment, marketing.

Area Chart Financial Ppt PowerPoint Presentation Styles Templates
This is a area chart financial ppt powerpoint presentation styles templates. This is a two stage process. The stages in this process are finance, marketing, management, investment, analysis.

Bar Chart Product Ppt PowerPoint Presentation Summary Diagrams
This is a bar chart product ppt powerpoint presentation summary diagrams. This is a three stage process. The stages in this process are business, management, marketing, percentage, product.
Pie Chart Product Ppt PowerPoint Presentation Gallery Icon
This is a pie chart product ppt powerpoint presentation gallery icon. This is a five stage process. The stages in this process are percentage, product, management, marketing, business.

Bar Chart Product Ppt PowerPoint Presentation Portfolio Visuals
This is a bar chart product ppt powerpoint presentation portfolio visuals. This is a three stage process. The stages in this process are business, management, marketing, percentage, product.
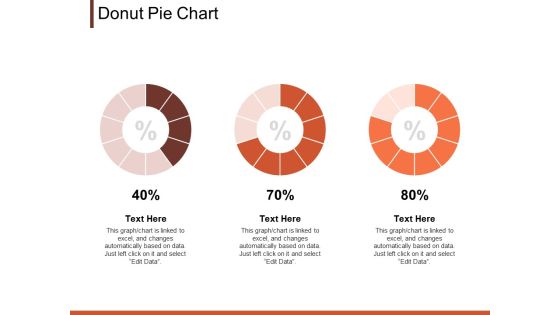
Donut Pie Chart Marketing Ppt PowerPoint Presentation Clipart
This is a donut pie chart marketing ppt powerpoint presentation clipart. This is a three stage process. The stages in this process are finance, analysis, business, investment, marketing.

Combo Chart Finance Ppt PowerPoint Presentation Portfolio Gridlines
This is a combo chart finance ppt powerpoint presentation portfolio gridlines. This is a two stage process. The stages in this process are finance, analysis, business, investment, marketing.

Column Chart Marketing Ppt PowerPoint Presentation Summary Images
This is a column chart marketing ppt powerpoint presentation summary images. This is a three stage process. The stages in this process are business, management, marketing, product, percentage.
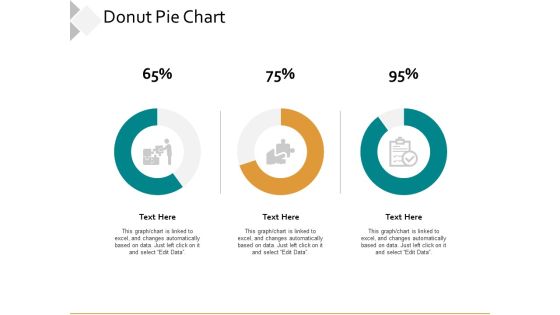
Donut Pie Chart Ppt PowerPoint Presentation Infographics Examples
This is a donut pie chart ppt powerpoint presentation infographics examples. This is a three stage process. The stages in this process are business, management, marketing, financial.

Scatter Chart Financial Ppt PowerPoint Presentation Model Deck
This is a scatter chart financial ppt powerpoint presentation model deck. This is a one stage process. The stages in this process are business, management, marketing, percentage, product.
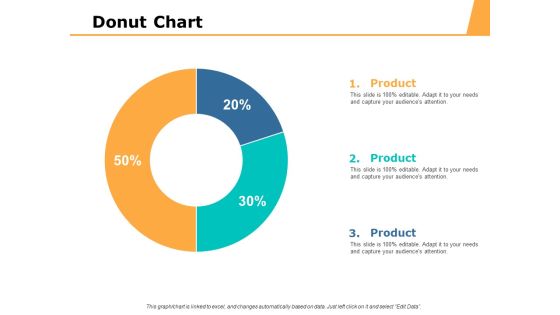
Pie Chart Percentage Ppt PowerPoint Presentation Inspiration Slides
This is a pie chart percentage ppt powerpoint presentation inspiration slides. This is a three stage process. The stages in this process are finance, marketing, management, investment, analysis.

Customer Retention Rate Of CNN E Commerce Company At Present Information PDF
This slide shows current Customer Retention Rate of CNN E Commerce Company. Additionally, this slide provides information on Customers at End of Period, Customers Acquired during period and Customers at Start of Period along with the formula for calculation of CRR Customer Retention Rate using these variables. Deliver an awe-inspiring pitch with this creative customer retention rate of CNN e commerce company at present information pdf. bundle. Topics like customer retention rate of cnn e commerce company at present can be discussed with this completely editable template. It is available for immediate download depending on the needs and requirements of the user.

Performance Analysis Of New Product Development What Is The Purchase Value Of Our Product Ideas PDF
Purpose of the following slide is to show the average value of product purchase as it displays the formula used by the organization and the key highlights which display the actual average order value and the total increase in the same. Deliver an awe inspiring pitch with this creative performance analysis of new product development what is the purchase value of our product ideas pdf bundle. Topics like revenue, value, average can be discussed with this completely editable template. It is available for immediate download depending on the needs and requirements of the user.

Data Mining Implementation Tools For Data Mining Excel Structure PDF
This slide depicts the excel tool used in data science and its usage along with its features. It also shows that users can create their functions and combine SQL with Excel. This is a data mining implementation tools for data mining excel structure pdf template with various stages. Focus and dispense information on four stages using this creative set, that comes with editable features. It contains large content boxes to add your information on topics like information cleaning, pre process information, functions and formulas You can also showcase facts, figures, and other relevant content using this PPT layout. Grab it now.

Company Introduction Chart With Market Share Portrait PDF
This slide showcases the enterprise introduction with a company overview. It also includes company details such as market share, target audience, key highlights, clients, financial highlights, etc. Showcasing this set of slides titled Company Introduction Chart With Market Share Portrait PDF. The topics addressed in these templates are Market Share, Financial Highlights, Target Audience. All the content presented in this PPT design is completely editable. Download it and make adjustments in color, background, font etc. as per your unique business setting.
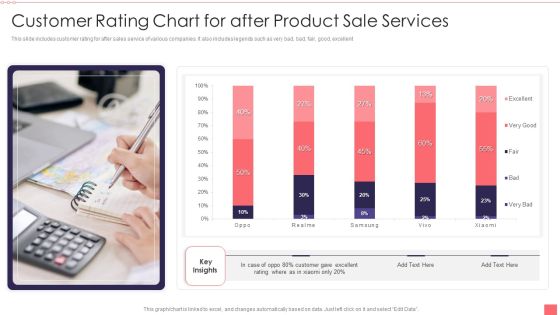
Customer Rating Chart For After Product Sale Services Download PDF
This slide includes customer rating for after sales service of various companies. It also includes legends such as very bad, bad, fair, good, excellent. Showcasing this set of slides titled Customer Rating Chart For After Product Sale Services Download PDF. The topics addressed in these templates are Customer, Product Sale Services. All the content presented in this PPT design is completely editable. Download it and make adjustments in color, background, font etc. as per your unique business setting.

Leverage Ratios For Annual Report Analysis Pictures PDF
The following slide highlights the leverage ratios for financial statement analysis illustrating key headings which includes ratio, formula, calculation and value for debt to asset ratio, debt to equity ratio, debt to capital ratio, debt to ebitda ratio and asset to equity ratio.Pitch your topic with ease and precision using this Leverage Ratios For Annual Report Analysis Pictures PDF This layout presents information on Debt To Asset, Capital Ratio, Asset To Equity It is also available for immediate download and adjustment. So, changes can be made in the color, design, graphics or any other component to create a unique layout.
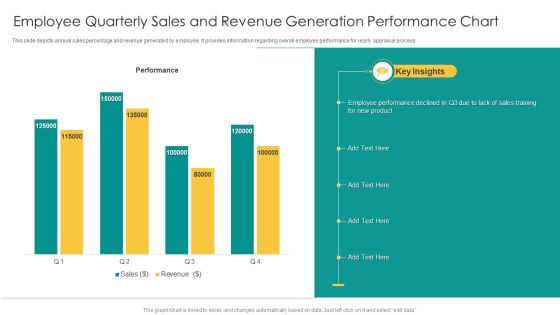
Employee Quarterly Sales And Revenue Generation Performance Chart Mockup PDF
This slide depicts annual sales percentage and revenue generated by employee. It provides information regarding overall employee performance for yearly appraisal process. Pitch your topic with ease and precision using this Employee Quarterly Sales And Revenue Generation Performance Chart Mockup PDF. This layout presents information on Performance, Sales, Revenue. It is also available for immediate download and adjustment. So, changes can be made in the color, design, graphics or any other component to create a unique layout.
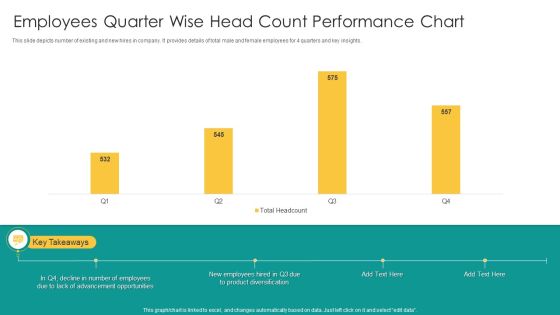
Employees Quarter Wise Head Count Performance Chart Clipart PDF
This slide depicts number of existing and new hires in company. It provides details of total male and female employees for 4 quarters and key insights. Showcasing this set of slides titled Employees Quarter Wise Head Count Performance Chart Clipart PDF. The topics addressed in these templates are New Employees, Product Diversification, Advancement Opportunities. All the content presented in this PPT design is completely editable. Download it and make adjustments in color, background, font etc. as per your unique business setting.
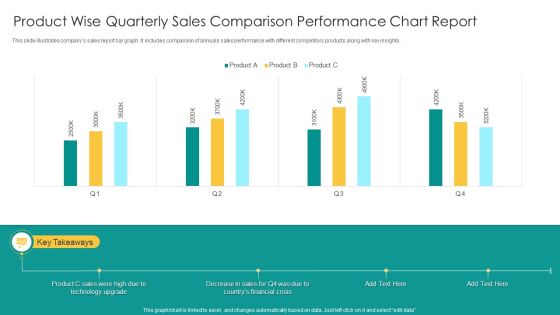
Product Wise Quarterly Sales Comparison Performance Chart Report Infographics PDF
This slide illustrates companys sales report bar graph. It includes comparison of annuals sales performance with different competitors products along with key insights. Showcasing this set of slides titled Product Wise Quarterly Sales Comparison Performance Chart Report Infographics PDF. The topics addressed in these templates are Product C Sales, Technology Upgrade, Financial Crisis. All the content presented in this PPT design is completely editable. Download it and make adjustments in color, background, font etc. as per your unique business setting.
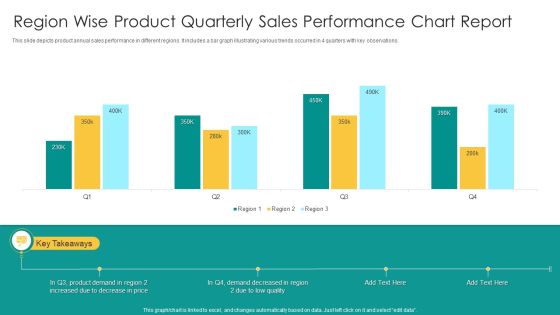
Region Wise Product Quarterly Sales Performance Chart Report Topics PDF
This slide depicts product annual sales performance in different regions. It includes a bar graph illustrating various trends occurred in 4 quarters with key observations. Showcasing this set of slides titled Region Wise Product Quarterly Sales Performance Chart Report Topics PDF. The topics addressed in these templates are Product Demand, Price, Low Quality. All the content presented in this PPT design is completely editable. Download it and make adjustments in color, background, font etc. as per your unique business setting.
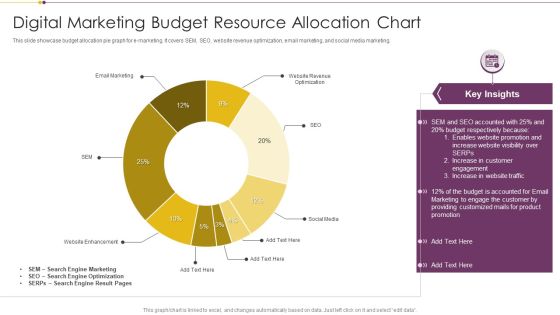
Digital Marketing Budget Resource Allocation Chart Download PDF
This slide showcase budget allocation pie graph for e marketing. It covers SEM, SEO, website revenue optimization, email marketing, and social media marketing. Pitch your topic with ease and precision using this Digital Marketing Budget Resource Allocation Chart Download PDF. This layout presents information on Search Engine Marketing, Search Engine Optimization, Budget. It is also available for immediate download and adjustment. So, changes can be made in the color, design, graphics or any other component to create a unique layout.
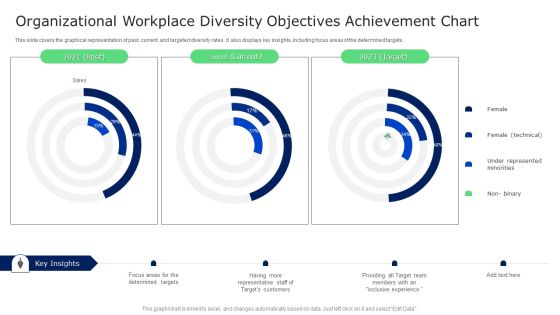
Organizational Workplace Diversity Objectives Achievement Chart Brochure PDF
This slide covers the graphical representation of past, current, and targeted diversity rates. It also displays key insights, including focus areas of the determined targets. Showcasing this set of slides titled Organizational Workplace Diversity Objectives Achievement Chart Brochure PDF. The topics addressed in these templates are Targets Customers, Determined Targets, Target Team. All the content presented in this PPT design is completely editable. Download it and make adjustments in color, background, font etc. as per your unique business setting.

IT Business Valuation Comparison Chart Ppt Model Themes PDF
This slide shows the comparison amongst valuation of three information technology companies. It includes data of last four years. Showcasing this set of slides titled IT Business Valuation Comparison Chart Ppt Model Themes PDF. The topics addressed in these templates are Key Takeaways, Increasing Competition, Innovative Products . All the content presented in this PPT design is completely editable. Download it and make adjustments in color, background, font etc. as per your unique business setting.
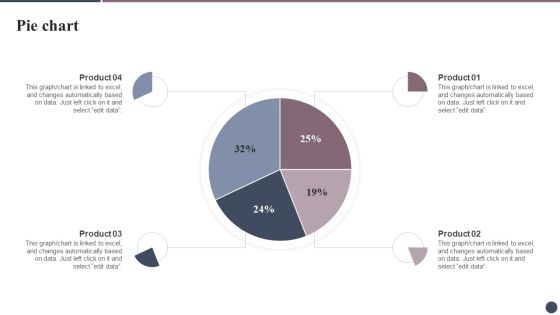
Expanding Target Audience With Cultural Branding Pie Chart Slides PDF
Slidegeeks is one of the best resources for PowerPoint templates. You can download easily and regulate Expanding Target Audience With Cultural Branding Pie Chart Slides PDF for your personal presentations from our wonderful collection. A few clicks is all it takes to discover and get the most relevant and appropriate templates. Use our Templates to add a unique zing and appeal to your presentation and meetings. All the slides are easy to edit and you can use them even for advertisement purposes.
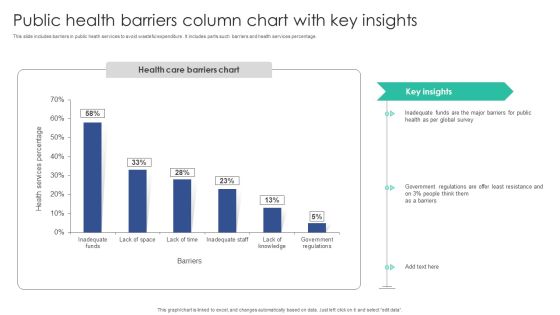
Public Health Barriers Column Chart With Key Insights Portrait PDF
This slide includes barriers in public heath services to avoid wasteful expenditure . It includes parts such barriers and health services percentage.Pitch your topic with ease and precision using this Public Health Barriers Column Chart With Key Insights Portrait PDF. This layout presents information on Inadequate Funds, Global Survey, Government Regulations. It is also available for immediate download and adjustment. So, changes can be made in the color, design, graphics or any other component to create a unique layout.
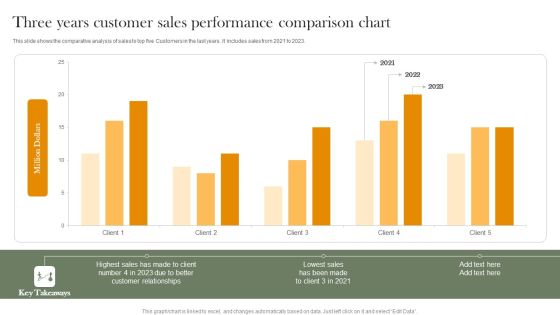
Three Years Customer Sales Performance Comparison Chart Professional PDF
This slide shows the comparative analysis of sales to top five Customers in the last years. It includes sales from 2021 to 2023. Pitch your topic with ease and precision using this Three Years Customer Sales Performance Comparison Chart Professional PDF. This layout presents information on Highest Sales, Customer Relationships, Lowest Sales. It is also available for immediate download and adjustment. So, changes can be made in the color, design, graphics or any other component to create a unique layout.

Current Industrial Operation Expenses With Pie Chart Download PDF
This slide covers expenses of the industrial day to day basis and the amount of expenditure in percentage for various sectors. It includes insurance, cleaning, R and M, utilities , etc.Showcasing this set of slides titled Current Industrial Operation Expenses With Pie Chart Download PDF. The topics addressed in these templates are Roads Grounds, Insurance, Utilities. All the content presented in this PPT design is completely editable. Download it and make adjustments in color, background, font etc. as per your unique business setting.

Advertising Budget Spend Chart To Enhance Customers Engagement Demonstration PDF
This slide covers expenses incurred different advertising activities to attract customers. It includes expenditures on print materials, social advertising, search and digital advertising. Showcasing this set of slides titled Advertising Budget Spend Chart To Enhance Customers Engagement Demonstration PDF. The topics addressed in these templates are Search Advertising, Print Materials. All the content presented in this PPT design is completely editable. Download it and make adjustments in color, background, font etc. as per your unique business setting.

Brand Assessment With Dough Nut Comparison Chart Elements PDF
This slide illustrates comparative analysis of brands of XYZ product. It includes their market size, key features of these brands. Showcasing this set of slides titled Brand Assessment With Dough Nut Comparison Chart Elements PDF. The topics addressed in these templates are Penetrative Pricing, Skimming Pricing, Competitive Pricing. All the content presented in this PPT design is completely editable. Download it and make adjustments in color, background, font etc. as per your unique business setting.

Cyber Risks And Incident Response Playbook Line Chart Professional PDF
The Cyber Risks And Incident Response Playbook Line Chart Professional PDF is a compilation of the most recent design trends as a series of slides. It is suitable for any subject or industry presentation, containing attractive visuals and photo spots for businesses to clearly express their messages. This template contains a variety of slides for the user to input data, such as structures to contrast two elements, bullet points, and slides for written information. Slidegeeks is prepared to create an impression.

Creating Employee Value Proposition Pie Chart Ppt Design Ideas PDF
The best PPT templates are a great way to save time, energy, and resources. Slidegeeks have 100 percent editable powerpoint slides making them incredibly versatile. With these quality presentation templates, you can create a captivating and memorable presentation by combining visually appealing slides and effectively communicating your message. Download Creating Employee Value Proposition Pie Chart Ppt Design Ideas PDF from Slidegeeks and deliver a wonderful presentation.

Business Components Share Exploded Donut Circle Chart Elements PDF
This slide depicts the share of business components for a successful company and earn profits. It shows the percentage distribution of different components of business. Pitch your topic with ease and precision using this Business Components Share Exploded Donut Circle Chart Elements PDF. This layout presents information on Administration, Marketing, Customer Support. It is also available for immediate download and adjustment. So, changes can be made in the color, design, graphics or any other component to create a unique layout.
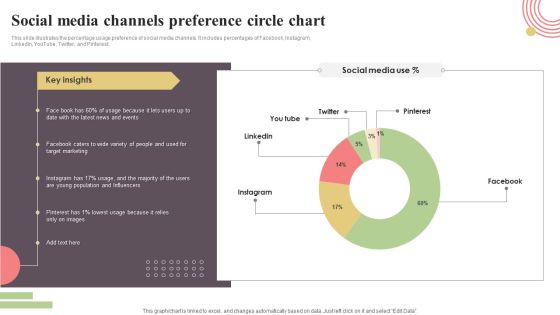
Social Media Channels Preference Circle Chart Clipart PDF
This slide illustrates the percentage usage preference of social media channels. It includes percentages of Facebook, Instagram, LinkedIn, YouTube, Twitter, and Pinterest. Showcasing this set of slides titled Social Media Channels Preference Circle Chart Clipart PDF. The topics addressed in these templates are Facebook, Instagram, Pinterest, Twitter, You Tube. All the content presented in this PPT design is completely editable. Download it and make adjustments in color, background, font etc. as per your unique business setting.
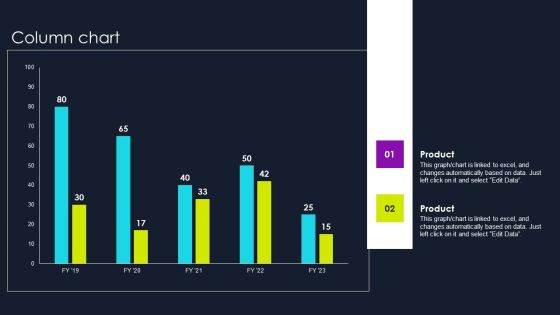
Lead Nurturing Tactics For Lead Generation Column Chart Graphics PDF
Slidegeeks is one of the best resources for PowerPoint templates. You can download easily and regulate Lead Nurturing Tactics For Lead Generation Column Chart Graphics PDF for your personal presentations from our wonderful collection. A few clicks is all it takes to discover and get the most relevant and appropriate templates. Use our Templates to add a unique zing and appeal to your presentation and meetings. All the slides are easy to edit and you can use them even for advertisement purposes.

Projection Model Regression Model For Predictive Analytics Sample PDF
This slide represents the regression model of predictive analytics that is most commonly used in statistical analysis. This model is used to identify patterns in large amounts of data and works by calculating a formula. From laying roadmaps to briefing everything in detail, our templates are perfect for you. You can set the stage with your presentation slides. All you have to do is download these easy-to-edit and customizable templates. Projection Model Regression Model For Predictive Analytics Sample PDF will help you deliver an outstanding performance that everyone would remember and praise you for. Do download this presentation today.

3d Linear Abstraction To Prevent Business Losses Seven Steps Flow Chart Maker Free PowerPoint Slides
We present our 3d linear abstraction to prevent business losses seven steps flow chart maker free PowerPoint Slides.Use our Advertising PowerPoint Templates because,This Diagram emphasizes on any critical or key factors within them. Use our Circle Charts PowerPoint Templates because,You have configured your targets, identified your goals as per priority and importance. Use our Arrows PowerPoint Templates because,You can gain the success to desired levels in one go. Use our Business PowerPoint Templates because,This slide will fire away with all the accuracy at your command. Use our Shapes PowerPoint Templates because, This diagram helps you to discuss each step slowly but surely move up the pyramid narrowing down to the best and most success oriented project.Use these PowerPoint slides for presentations relating to Advertising, arrow, background, banner, bookmark, card, choice, concept, creative, design, direction, flow, idea, illustration, infographic, instruction, label, layout, manual, marketing, modern, next, number, offer, options, order, paper, process, product, promotion, sequence, simple, step, symbol, template, triangle, tutorial, vector, version, web. The prominent colors used in the PowerPoint template are Green, Gray, White

11 Diverging Arrows Multilple Concepts Diagram Chart Software PowerPoint Slides
We present our 11 diverging arrows multilple concepts diagram Chart Software PowerPoint Slides.Present our Signs PowerPoint Templates because you can asked to strive to give true form to your great dream. Present our Future PowerPoint Templates because with the help of our Slides you can Illustrate the means to prevent or control them using our imaginative templates. Download our Ring Charts PowerPoint Templates because this business powerpoint template helps expound on the logic of your detailed thought process to take your company forward. Download and present our Business PowerPoint Templates because this slide will fire away with all the accuracy at your command. Present our Marketing PowerPoint Templates because it helps you to get your team in the desired sequence into the bracket.Use these PowerPoint slides for presentations relating to Circle, circular, colorful,connection, cursor, cycle, cyclic,decisions, direction, flow, graph, graphic,group, icon, illustration, isolated, loop,motion, movement, multicolor, palette,point, pointer, rainbow, recycle, recycling,reuse, ring, rotation, round, sign,spectrum, spin, symbol, target, team,teamwork. The prominent colors used in the PowerPoint template are Green, Black, White. You can be sure our 11 diverging arrows multilple concepts diagram Chart Software PowerPoint Slides are Amazing. Professionals tell us our direction PowerPoint templates and PPT Slides will help them to explain complicated concepts. PowerPoint presentation experts tell us our 11 diverging arrows multilple concepts diagram Chart Software PowerPoint Slides are Reminiscent. You can be sure our cursor PowerPoint templates and PPT Slides are Sparkling. You can be sure our 11 diverging arrows multilple concepts diagram Chart Software PowerPoint Slides are Stylish. The feedback we get is that our cycle PowerPoint templates and PPT Slides are Enchanting.

PowerPoint Presentation Diverging Processes Circular Flow Layout Chart Slides
We present our powerpoint presentation diverging processes Circular Flow Layout Chart Slides.Download and present our Flow Charts PowerPoint Templates because it Shines the light on your thoughts and motivates your team to improve the quality of celebration for all around you. Use our Business PowerPoint Templates because you have secured a name for yourself in the domestic market. Now the time is right to spread your reach to other countries. Use our Marketing PowerPoint Templates because forward thinking is the way to go. Present our Arrows PowerPoint Templates because it explains the goals of each team and how you intend for each slice to contribute to the entire cake. Download and present our Process and flows PowerPoint Templates because firing the arrows to emblazon the desired path will let you achieve anticipated results.Use these PowerPoint slides for presentations relating to Arrow, background, banner,concept,creative, design, direction, flow, ten,illustration, infographic, instruction, label,layout, manual, marketing, modern, next,number, offer, one, options, order,pointer, process, product,promotion, sequence, simple, special,step, symbol. The prominent colors used in the PowerPoint template are Orange, Gray, Black. Customers tell us our powerpoint presentation diverging processes Circular Flow Layout Chart Slides are Pretty. We assure you our ten PowerPoint templates and PPT Slides are Precious. PowerPoint presentation experts tell us our powerpoint presentation diverging processes Circular Flow Layout Chart Slides are designed by professionals People tell us our creative PowerPoint templates and PPT Slides have awesome images to get your point across. We assure you our powerpoint presentation diverging processes Circular Flow Layout Chart Slides look good visually. Use our flow PowerPoint templates and PPT Slides are Colorful.

An Illustration Of Pointing Arrows Charts And PowerPoint Templates
We present our an illustration of pointing arrows Charts and PowerPoint templates.Download our Flow Charts PowerPoint Templates because we all know that alphabetical order is a time honoured concept. Download our Business PowerPoint Templates because you can illustrate your ideas and imprint them in the minds of your team with this template. Download our Arrows PowerPoint Templates because it is the time to bond with family, friends, colleagues and any other group of your choice. Use our Marketing PowerPoint Templates because networking is an imperative in todays world. You need to access the views of others. Similarly you need to give access to them of your abilities. Download our Process and Flows PowerPoint Templates because this shower your team with the wisdom of your words.Use these PowerPoint slides for presentations relating to Arrow, Background, Concept, Creative, Design, Direction, Illustration, Info Graphic, Instruction, Layout, Manual, Marketing, Modern, Offer, Options, Order, Page, Paper, Pointer, Process, Product, Promotion, Simple, Special, Step, Symbol, Tab, Tag, Template, Version, Web. The prominent colors used in the PowerPoint template are Yellow, Black, Gray. Presenters tell us our an illustration of pointing arrows Charts and PowerPoint templates are Vintage. Professionals tell us our Graphic PowerPoint templates and PPT Slides are Elegant. PowerPoint presentation experts tell us our an illustration of pointing arrows Charts and PowerPoint templates are Charming. The feedback we get is that our Illustration PowerPoint templates and PPT Slides are Striking. Use our an illustration of pointing arrows Charts and PowerPoint templates are Fantastic. Use our Illustration PowerPoint templates and PPT Slides are the best it can get when it comes to presenting.

Marketing Statistics For Real Estate Agents Pictures PDF
The following slide outlines real estate marketing statistics that can provide useful insights to realtors and can develop marketing strategies accordingly. The statistics are associated with usage of internet, popularity of marketing strategies, emerging technology, etc. Formulating a presentation can take up a lot of effort and time, so the content and message should always be the primary focus. The visuals of the PowerPoint can enhance the presenters message, so our Marketing Statistics For Real Estate Agents Pictures PDF was created to help save time. Instead of worrying about the design, the presenter can concentrate on the message while our designers work on creating the ideal templates for whatever situation is needed. Slidegeeks has experts for everything from amazing designs to valuable content, we have put everything into Marketing Statistics For Real Estate Agents Pictures PDF

Overview And Benefits Of Video Marketing Download PDF
The following slide outlines introduction to video marketing strategy through which real estate firms can increase sales and profit. The slide covers information about major statistics and key benefits associated with video marketing strategy such as higher conversion rate, increased brand awareness rate, etc. Get a simple yet stunning designed Overview And Benefits Of Video Marketing Download PDF. It is the best one to establish the tone in your meetings. It is an excellent way to make your presentations highly effective. So, download this PPT today from Slidegeeks and see the positive impacts. Our easy to edit Overview And Benefits Of Video Marketing Download PDF can be your go to option for all upcoming conferences and meetings. So, what are you waiting for Grab this template today.

Various Tactics To Offer Customized Customer Service Ppt PowerPoint Presentation Diagram Templates PDF
Mentioned slide outlines different strategies that can be used by corporates to provide personalized customer service and strengthen the customer relationship. The strategies are humanizing the brand, data collection and segmentation, personalized messages, and rewarding loyal customers. Find highly impressive Various Tactics To Offer Customized Customer Service Ppt PowerPoint Presentation Diagram Templates PDF on Slidegeeks to deliver a meaningful presentation. You can save an ample amount of time using these presentation templates. No need to worry to prepare everything from scratch because Slidegeeks experts have already done a huge research and work for you. You need to download Various Tactics To Offer Customized Customer Service Ppt PowerPoint Presentation Diagram Templates PDF for your upcoming presentation. All the presentation templates are 100 percent editable and you can change the color and personalize the content accordingly. Download now

Roles And Responsibilities Of Our Brand Consultants Ppt Pictures Design Ideas PDF
The following slide outlines the major roles and responsibilities of strategic consultants in developing a comprehensive brand strategy. It covers detailed information about market research, company audit, content creation, and strategy development. Present like a pro with Roles And Responsibilities Of Our Brand Consultants Ppt Pictures Design Ideas PDF Create beautiful presentations together with your team, using our easy to use presentation slides. Share your ideas in real time and make changes on the fly by downloading our templates. So whether you are in the office, on the go, or in a remote location, you can stay in sync with your team and present your ideas with confidence. With Slidegeeks presentation got a whole lot easier. Grab these presentations today.
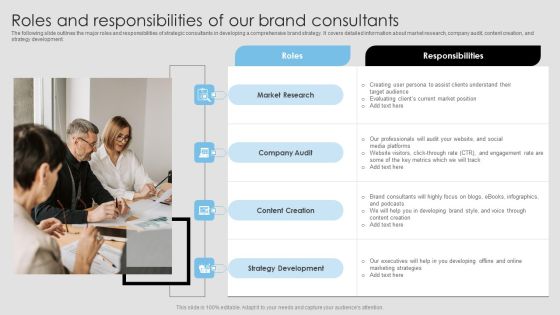
Roles And Responsibilities Of Our Brand Consultants Summary PDF
The following slide outlines the major roles and responsibilities of strategic consultants in developing a comprehensive brand strategy. It covers detailed information about market research, company audit, content creation, and strategy development. Present like a pro with Roles And Responsibilities Of Our Brand Consultants Summary PDF Create beautiful presentations together with your team, using our easy to use presentation slides. Share your ideas in real time and make changes on the fly by downloading our templates. So whether you are in the office, on the go, or in a remote location, you can stay in sync with your team and present your ideas with confidence. With Slidegeeks presentation got a whole lot easier. Grab these presentations today.
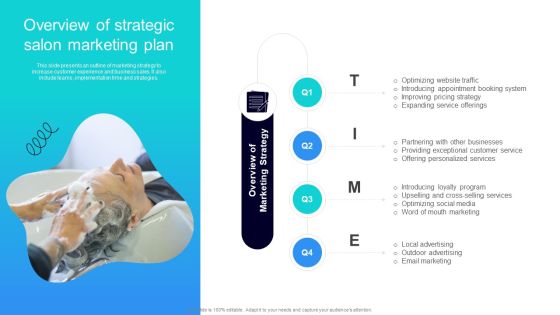
Strategic Marketing For Hair And Beauty Salon To Increase Overview Of Strategic Salon Marketing Ideas PDF
This slide presents an outline of marketing strategy to increase customer experience and business sales. It also include teams, implementation time and strategies. Do you have an important presentation coming up Are you looking for something that will make your presentation stand out from the rest Look no further than Strategic Marketing For Hair And Beauty Salon To Increase Overview Of Strategic Salon Marketing Ideas PDF. With our professional designs, you can trust that your presentation will pop and make delivering it a smooth process. And with Slidegeeks, you can trust that your presentation will be unique and memorable. So why wait Grab Strategic Marketing For Hair And Beauty Salon To Increase Overview Of Strategic Salon Marketing Ideas PDF today and make your presentation stand out from the rest.

Devops Tools And Configuration IT Major Issues Encountered In Previously Completed Projects Ideas PDF
Mentioned slide covers information about various problems faced by the project teams in previous projects. Requirement analysis, unrealistic schedule and inadequate testing were the main problems. Deliver an awe inspiring pitch with this creative devops tools and configuration it major issues encountered in previously completed projects ideas pdf bundle. Topics like analysis, development, cost, architectural, process can be discussed with this completely editable template. It is available for immediate download depending on the needs and requirements of the user.
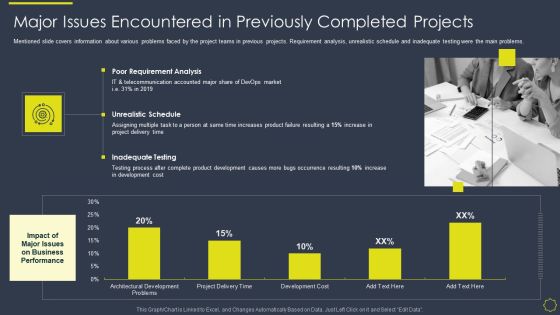
Implementing Development And Operations Platforms For In Time Product Launch IT Major Issues Encountered Topics PDF
Mentioned slide covers information about various problems faced by the project teams in previous projects. Requirement analysis, unrealistic schedule and inadequate testing were the main problems. Deliver an awe inspiring pitch with this creative implementing development and operations platforms for in time product launch it major issues encountered topics pdf bundle. Topics like requirement analysis, product, development can be discussed with this completely editable template. It is available for immediate download depending on the needs and requirements of the user.

Project Administration Playbook Dashboard To Track Project Essential Activities Information PDF
This slide provides information about dashboard to track project essential activities by tracking project schedule, budget, resources, etc. Deliver an awe inspiring pitch with this creative project administration playbook dashboard to track project essential activities information pdf bundle. Topics like dashboard to track project essential activities can be discussed with this completely editable template. It is available for immediate download depending on the needs and requirements of the user.

Project Administration Playbook Project Management Dashboard To Track Essential Activities Pictures PDF
This slide provides information about dashboard to track project essential activities by tracking project schedule, budget, risks, etc. Deliver an awe inspiring pitch with this creative project administration playbook project management dashboard to track essential activities pictures pdf bundle. Topics like project management dashboard to track essential activities can be discussed with this completely editable template. It is available for immediate download depending on the needs and requirements of the user.

Project Organizing Playbook Dashboard To Track Project Essential Activities Template PDF
This slide provides information about dashboard to track project essential activities by tracking project schedule, budget, resources, etc. Deliver an awe inspiring pitch with this creative project organizing playbook dashboard to track project essential activities template pdf bundle. Topics like projects kpi, budget, resources can be discussed with this completely editable template. It is available for immediate download depending on the needs and requirements of the user.


 Continue with Email

 Home
Home


