Plan

Combo Chart Ppt PowerPoint Presentation Summary Graphic Images
This is a combo chart ppt powerpoint presentation summary graphic images. This is a three stage process. The stages in this process are combo chart, product, growth, marketing, business.

Stacked Column Chart Ppt PowerPoint Presentation Summary Gallery
This is a stacked column chart ppt powerpoint presentation summary gallery. This is a two stage process. The stages in this process are stacked column chart, product, in years, growth, percentage.

Column Chart Ppt PowerPoint Presentation Layouts File Formats
This is a column chart ppt powerpoint presentation layouts file formats. This is a three stage process. The stages in this process are column chart, product, in percentage, year, finance.

Bubble Chart Ppt PowerPoint Presentation Summary Graphics Tutorials
This is a bubble chart ppt powerpoint presentation summary graphics tutorials. This is a three stage process. The stages in this process are product, sales in percentage, bubble chart.

Bubble Chart Process Analysis Ppt PowerPoint Presentation Ideas Files
This is a bubble chart process analysis ppt powerpoint presentation ideas files. This is a two stage process. The stages in this process are bubble chart, product, profit, finance, business.
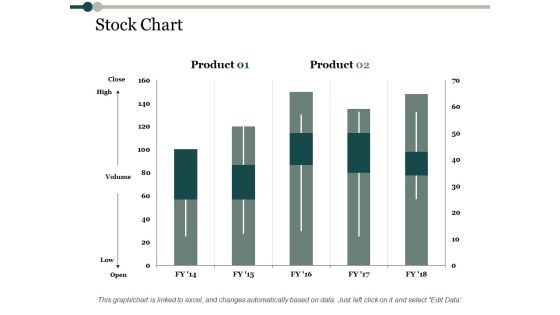
Stock Chart Process Analysis Ppt PowerPoint Presentation Professional Information
This is a stock chart process analysis ppt powerpoint presentation professional information. This is a two stage process. The stages in this process are stock chart, product, high, volume, low.

Column Chart Finance Ppt PowerPoint Presentation Model Examples
This is a column chart finance ppt powerpoint presentation model examples. This is a two stage process. The stages in this process are column chart, finance, marketing, analysis, investment.

Stacked Bar Chart Ppt PowerPoint Presentation Portfolio Templates
This is a stacked bar chart ppt powerpoint presentation portfolio templates. This is a three stage process. The stages in this process are stacked bar chart, product, year, business, finance.
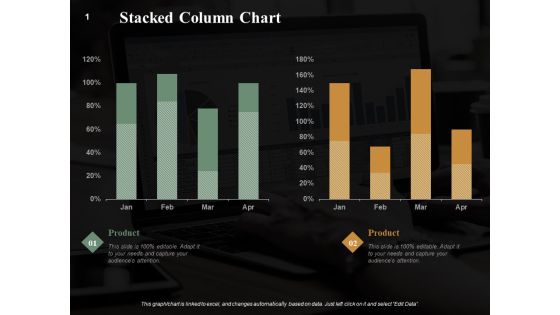
Stacked Column Chart Finance Ppt PowerPoint Presentation Summary Graphics Example
This is a stacked column chart finance ppt powerpoint presentation summary graphics example. This is a two stage process. The stages in this process are stacked column chart, marketing, analysis, business, investment.
Pie Chart Investment Ppt PowerPoint Presentation Gallery Icon
This is a pie chart investment ppt powerpoint presentation gallery icon. This is a three stage process. The stages in this process are pie chart, finance, marketing, analysis, investment.

Combo Chart Finance Ppt PowerPoint Presentation Ideas Microsoft
This is a combo chart finance ppt powerpoint presentation ideas microsoft. This is a three stage process. The stages in this process are combo chart, Finance, Analysis, Business, Investment.

Combo Chart Finance Ppt PowerPoint Presentation Icon Designs Download
This is a combo chart finance ppt powerpoint presentation icon designs download. This is a three stage process. The stages in this process are combo chart, finance, analysis, business, investment.

Area Chart Investment Ppt PowerPoint Presentation Styles Topics
This is a area chart investment ppt powerpoint presentation styles topics. This is a three stage process. The stages in this process are area chart, finance, marketing, analysis, investment.
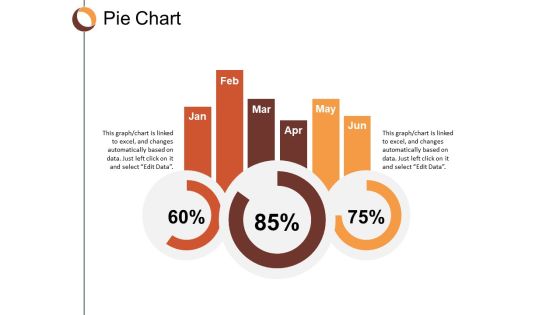
Pie Chart Finance Ppt Powerpoint Presentation Infographic Template Clipart
This is a pie chart finance ppt powerpoint presentation infographic template clipart. This is a three stage process. The stages in this process are pie chart, finance, marketing, business, analysis.

Product Comparison Chart Ppt Powerpoint Presentation Styles Background Designs
This is a product comparison chart ppt powerpoint presentation styles background designs. This is a two stage process. The stages in this process are comparison chart, comparison table, comparison matrix.
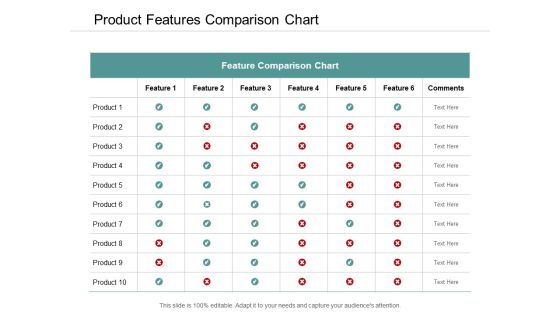
Product Features Comparison Chart Ppt Powerpoint Presentation Model Template
This is a product features comparison chart ppt powerpoint presentation model template. This is a six stage process. The stages in this process are comparison chart, comparison table, comparison matrix.

donut pie chart investment ppt powerpoint presentation show guide
This is a donut pie chart investment ppt powerpoint presentation show guide. This is a four stage process. The stages in this process are donut pie chart, finance, marketing, business, analysis.

Area Chart Finance Ppt Powerpoint Presentation Slides Picture
This is a area chart finance ppt powerpoint presentation slides picture. This is a three stage process. The stages in this process are area chart, finance, marketing, management, investment.

Area Chart Finance Ppt PowerPoint Presentation Infographics Slide
This is a area chart finance ppt powerpoint presentation infographics slide. This is a three stage process. The stages in this process are area chart, finance, marketing, analysis, investment.

Area Chart Finance Ppt Powerpoint Presentation Inspiration Example
This is a area chart finance ppt powerpoint presentation inspiration example. This is a three stage process. The stages in this process are area chart, finance, marketing, management, investment.

Combo Chart Finance Marketing Ppt Powerpoint Presentation Layouts Inspiration
This is a combo chart finance marketing ppt powerpoint presentation layouts inspiration. This is a three stage process. The stages in this process are combo chart, finance, marketing, management, analysis.

Hobbies Pie Chart Ppt PowerPoint Presentation Show Smartart
This is a hobbies pie chart ppt powerpoint presentation show smartart. This is a five stage process. The stages in this process are financial, business, marketing, management, pie chart.

Area Chart Investment Ppt PowerPoint Presentation Gallery Example Introduction
This is a area chart investment ppt powerpoint presentation gallery example introduction. This is a three stage process. The stages in this process are area chart, finance, marketing, management, investment.

Area Chart Finance Marketing Ppt PowerPoint Presentation Summary Icons
This is a area chart finance marketing ppt powerpoint presentation summary icons. This is a three stage process. The stages in this process are area chart, finance, marketing, analysis, investment.

Area Chart Product Percentage Ppt PowerPoint Presentation Infographic Template Slide
This is a area chart product percentage ppt powerpoint presentation infographic template slide. This is a four stage process. The stages in this process are area chart, finance, marketing, management, investment.

Area Chart Percentage Ppt PowerPoint Presentation Portfolio Pictures
This is a area chart percentage ppt powerpoint presentation portfolio pictures. This is a three stage process. The stages in this process are area chart, finance, marketing, management, investment.

Area Chart Finance Marketing Ppt PowerPoint Presentation Gallery Styles
This is a area chart finance marketing ppt powerpoint presentation gallery styles. This is a three stage process. The stages in this process are area chart, finance, marketing, analysis, investment.

Area Chart Finance Ppt PowerPoint Presentation Pictures Clipart
This is a area chart finance ppt powerpoint presentation pictures clipart. This is a two stage process. The stages in this process are area chart, finance, marketing, analysis, investment.

Area Chart Percentage Product Ppt PowerPoint Presentation Infographic Template Slide
This is a area chart percentage product ppt powerpoint presentation infographic template slide. This is a two stage process. The stages in this process are area chart, finance, marketing, management, investment.

Combo Chart Marketing Ppt Powerpoint Presentation Layouts Designs Download
This is a combo chart marketing ppt powerpoint presentation layouts designs download. This is a three stage process. The stages in this process are combo chart, marketing, growth, product, finance.
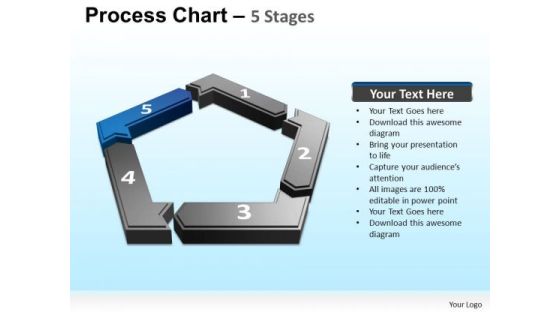
PowerPoint Presentation Teamwork Process Chart Ppt Presentation Designs
PowerPoint Presentation Teamwork process chart PPT Presentation Designs-These Fabulous PowerPoint slides and PowerPoint templates have been delicately designed by our professional team to leave long-lasting impressions on your audiences
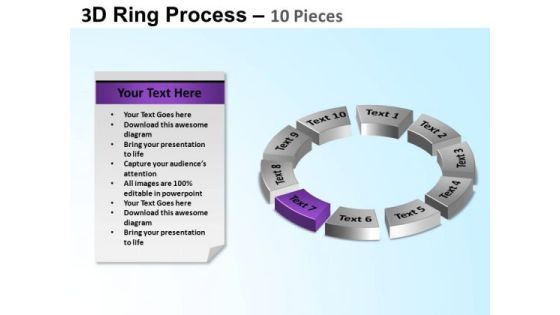
PowerPoint Process Circle Chart Ring Process Ppt Designs
PowerPoint Process Circle Chart Ring Process PPT Designs-These Fabulous PowerPoint slides and PowerPoint templates have been delicately designed by our professional team to leave long-lasting impressions on your audiences
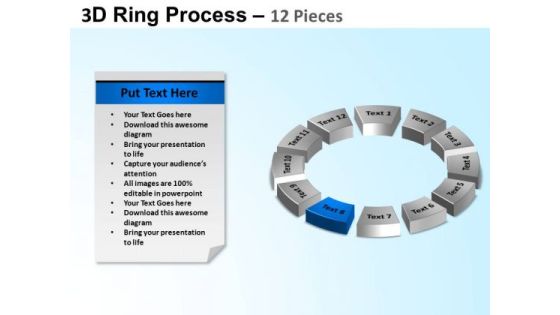
PowerPoint Process Circle Chart Ring Process Ppt Slides
PowerPoint Process Circle Chart Ring Process PPT Slides-These Fabulous PowerPoint slides and PowerPoint templates have been delicately designed by our professional team to leave long-lasting impressions on your audiences
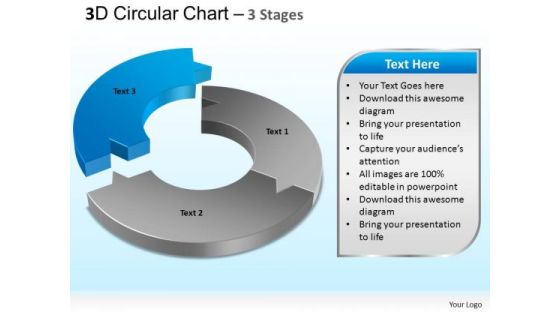
PowerPoint Process Editable Circular Chart Ppt Design Slides
PowerPoint Process Editable circular chart PPT Design Slides-These Fabulous PowerPoint slides and PowerPoint templates have been delicately designed by our professional team to leave long-lasting impressions on your audiences
Business Charts PowerPoint Templates 3d Emoticon Showing Hyper Face Sales
Business Charts PowerPoint templates 3d emoticon showing hyper face Sales-This 3D Emoticon PowerPoint Diagram Shows you the Ferocious and annoyed face. You can use this Diagram to express your views in different situations. With this many other emoticons are attached.

Business Charts PowerPoint Templates An Illustration Of Angry Emotion Sales
Business Charts PowerPoint templates an illustration of angry emotion Sales-This PowerPoint Diagram Illustrates all the Angry Emoticons which will help you to express exasperation, irritability, antagonism etc. .You can change color, size and orientation of any icon to your liking.
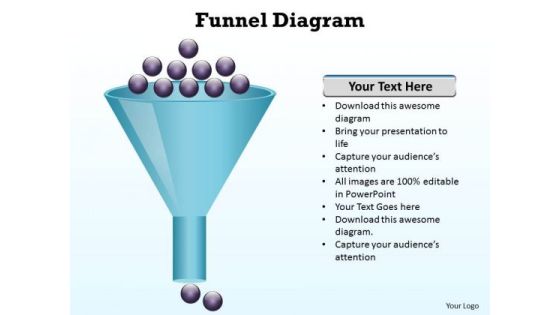
Business Charts PowerPoint Templates Funnel Diagram Editable Sales
Business Charts PowerPoint templates funnel diagram editable Sales-This Funnel based PowerPoint Diagram signifies adulteration, contamination, corruption, defilement, dirt, filth, foreign matter, grime, pestilence, poisoning, pollutant, pollution, scum, stain, taint, uncleanness.

Stock Photo 3d Chart With Six Stages PowerPoint Slide
Use this image slide to provide information about a process or task to the relevant audience. This image presents 3d chart with six stages. This diagram is designed to attract the attention of your audience.
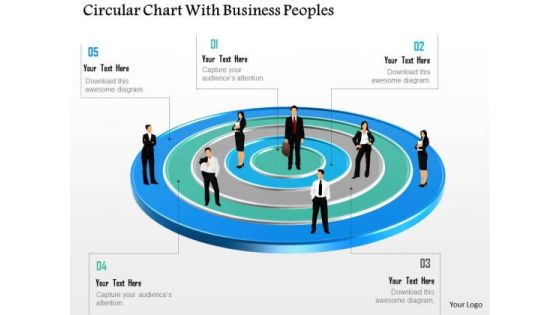
Business Diagram Circular Chart With Business Peoples Presentation Template
This business diagram has been designed with graphic of business people on circular chart. This diagram is designed to depict team meeting on financial matter. This diagram offers a way for your audience to visually conceptualize the process.
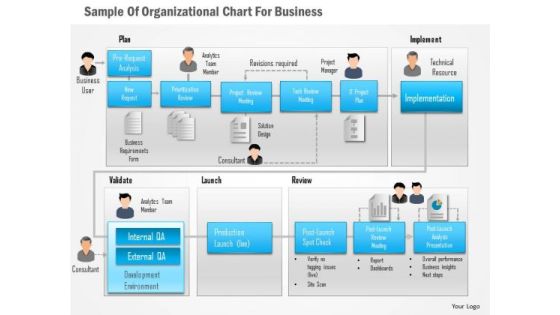
Business Diagram Sample Of Organizational Chart For Business Presentation Template
Graphic of organizational chart has been used to design this business diagram. This diagram slide reflects the hierarchy of an organization. Display your topic in a visual manner with this unique diagram.

Business Diagram Circle Chart For Percentage Ratio Presentation Template
Four staged circular chart has been used to craft this PPT diagram. This PPT contains the concept of result analysis. Use this PPT in your business and sales presentation and display any kind of result analysis in a graphical way.

Business Diagram Paper Clips Circular Chart Presentation Template
This power point template has been designed with graphic of circular chart made with paper clips. These business icons are used to display the concept of business result analysis and meeting. Use this diagram for business and marketing presentations.
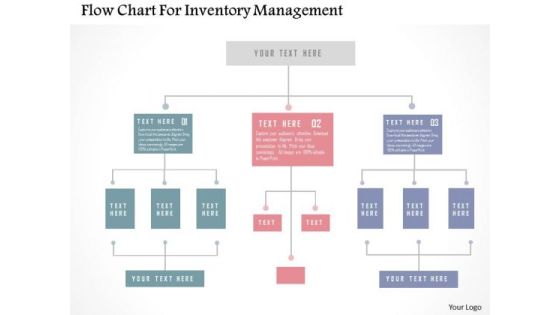
Business Diagram Flow Chart For Inventory Management PowerPoint Templates
Our above business slide contains graphics of flow chart. This flowchart may be used to display inventory management. This slide is an excellent backdrop for you to enlighten your audience on the process.
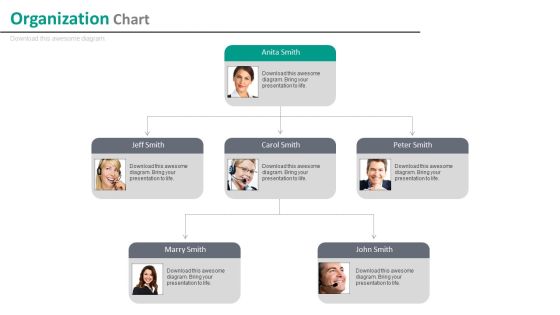
Company Employees Organizational Chart With Profiles Powerpoint Slides
Our compelling template consists with diagram of employee?s organizational chart with profiles. This slide has been professionally designed to display organizational structure and team hierarchy. This template offers an excellent background to build impressive presentation.
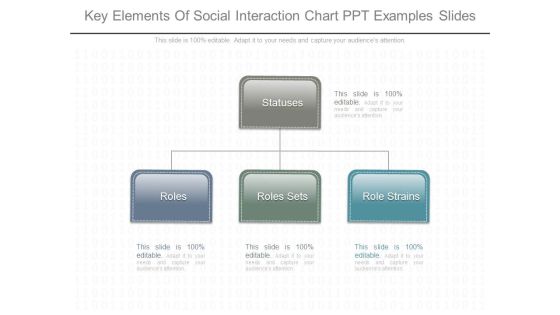
Key Elements Of Social Interaction Chart Ppt Examples Slides
This is a key elements of social interaction chart ppt examples slides. This is a three stage process. The stages in this process are statuses, roles, roles sets, role strains.
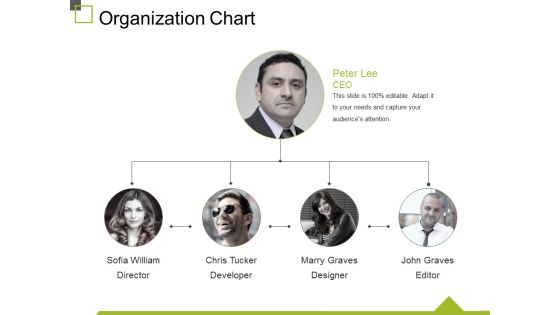
Organization Chart Ppt PowerPoint Presentation File Slide Download
This is a organization chart ppt powerpoint presentation file slide download. This is a four stage process. The stages in this process are sofia william, chris tucker, marry graves, john graves, business.

Organization Chart Ppt PowerPoint Presentation Gallery Graphics Pictures
This is a organization chart ppt powerpoint presentation gallery graphics pictures. This is a four stage process. The stages in this process are head customer relations name, production name, head bending name, head employee relation and admin, name head projects.
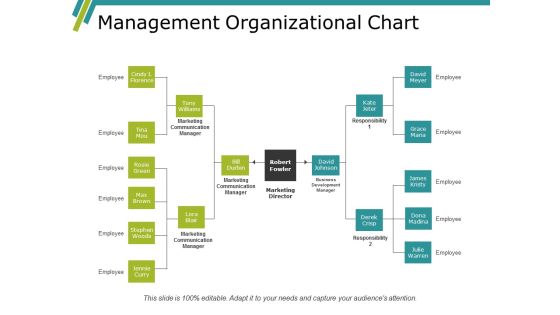
Management Organizational Chart Ppt PowerPoint Presentation Visual Aids Portfolio
This is a management organizational chart ppt powerpoint presentation visual aids portfolio. This is a three stage process. The stages in this process are rosie green, max brown, stephen woods, jennie curry, lora blair.
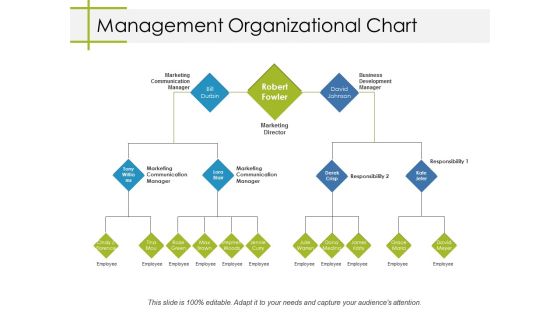
Management Organizational Chart Ppt PowerPoint Presentation Layouts Topics
This is a management organizational chart ppt powerpoint presentation layouts topics. This is a three stage process. The stages in this process are bill durbin, robert fowler, david johnson, tony williams, lora blair.
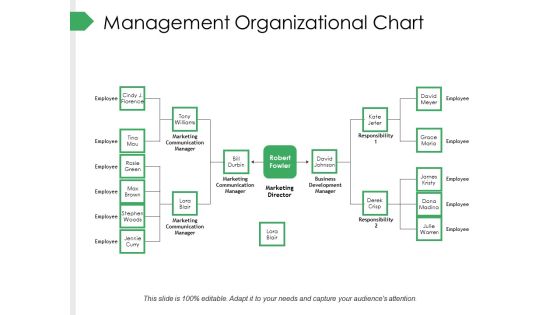
Management Organizational Chart Ppt PowerPoint Presentation Summary Gallery
This is a management organizational chart ppt powerpoint presentation summary gallery. This is a two stage process. The stages in this process are employee, marketing communication manager, marketing director, business development manager, responsibility, tony williams.

Project Organization Chart Ppt PowerPoint Presentation Summary Elements
This is a project organization chart ppt powerpoint presentation summary elements. This is a three stage process. The stages in this process are project governance, governance structure, project structure.

Finance Chart Business PowerPoint Templates And PowerPoint Backgrounds 0611
Microsoft PowerPoint Template and Background with chart

How To Create An Emotionally Effective Brand Utilizing Emotional And Rational Branding For Improved Consumer Portrait PDF
This slide showcases techniques to make a brand emotionally effective helping marketers to sustain competition. It provides details about know customers, personalization, engage customers, showcase values, personal needs, customer service operations, human rights, etc.Explore a selection of the finest How To Create An Emotionally Effective Brand Utilizing Emotional And Rational Branding For Improved Consumer Portrait PDF here. With a plethora of professionally designed and pre-made slide templates, you can quickly and easily find the right one for your upcoming presentation. You can use our How To Create An Emotionally Effective Brand Utilizing Emotional And Rational Branding For Improved Consumer Portrait PDF to effectively convey your message to a wider audience. Slidegeeks has done a lot of research before preparing these presentation templates. The content can be personalized and the slides are highly editable. Grab templates today from Slidegeeks.
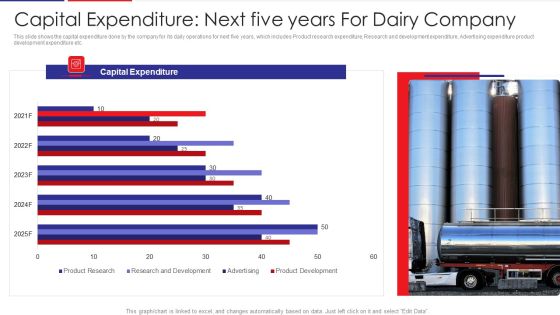
Examination Of Buyer Mindset Towards Dairy Products Capital Expenditure Next Five Years For Guidelines PDF
This slide shows the capital expenditure done by the company for its daily operations for next five years, which includes Product research expenditure, Research and development expenditure, Advertising expenditure product development expenditure etc. Deliver and pitch your topic in the best possible manner with this examination of buyer mindset towards dairy products capital expenditure next five years for guidelines pdf. Use them to share invaluable insights on product research, research and development, advertising, product development and impress your audience. This template can be altered and modified as per your expectations. So, grab it now.

Capital Expenditure Next Five Years For Dairy Company Download PDF
This slide shows the capital expenditure done by the company for its daily operations for next five years, which includes Product research expenditure, Research and development expenditure, Advertising expenditure product development expenditure etc. Deliver an awe inspiring pitch with this creative capital expenditure next five years for dairy company download pdf bundle. Topics like capital expenditure next five years for dairy company can be discussed with this completely editable template. It is available for immediate download depending on the needs and requirements of the user.

Factor Influencing User Experience Dairy Industry Capital Expenditure Next Five Years Designs PDF
This slide shows the capital expenditure done by the company for its daily operations for next five years, which includes Product research expenditure, Research and development expenditure, Advertising expenditure product development expenditure etc. Deliver an awe inspiring pitch with this creative factor influencing user experience dairy industry capital expenditure next five years designs pdf bundle. Topics like capital expenditure next five years for dairy company can be discussed with this completely editable template. It is available for immediate download depending on the needs and requirements of the user.

Dashboard For Real Time Telemarketing Process Management Themes PDF
The following slide highlights the dashboard for real time telesales process management illustrating real time data, employee data, performance, daily data, average handled call vs average answered call, employee ranking, AHT, AvgACW, ASA and hold percentage Showcasing this set of slides titled dashboard for real time telemarketing process management themes pdf The topics addressed in these templates are dashboard for real time telemarketing process management All the content presented in this PPT design is completely editable. Download it and make adjustments in color, background, font etc. as per your unique business setting.
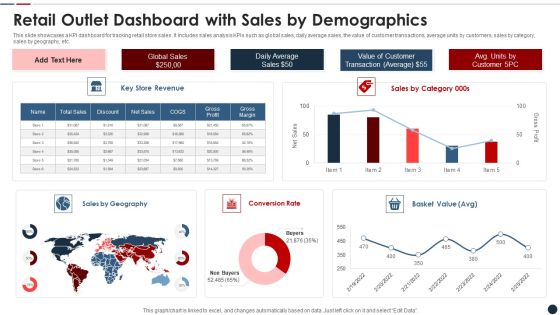
Retail Outlet Dashboard With Sales By Demographics Slides PDF
This slide showcases a KPI dashboard for tracking retail store sales. It includes sales analysis KPIs such as global sales, daily average sales, the value of customer transactions, average units by customers, sales by category, sales by geography, etc. Showcasing this set of slides titled retail outlet dashboard with sales by demographics slides pdf The topics addressed in these templates are Retail outlet dashboard with sales by demographics All the content presented in this PPT design is completely editable. Download it and make adjustments in color, background, font etc. as per your unique business setting.
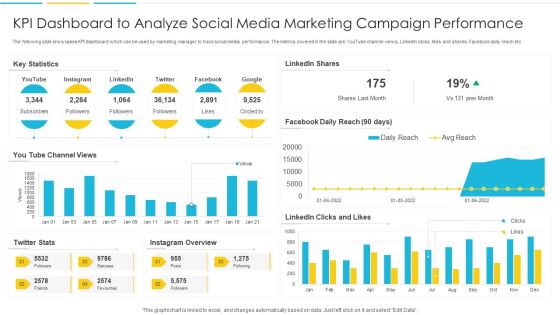
KPI Dashboard To Analyze Social Media Marketing Campaign Performance Rules PDF
The following slide showcases KPI dashboard which can be used by marketing manager to track social media performance. The metrics covered in the slide are YouTube channel views, LinkedIn clicks, likes and shares, Facebook daily reach etc. Pitch your topic with ease and precision using this KPI Dashboard To Analyze Social Media Marketing Campaign Performance Rules PDF. This layout presents information on Dashboard, Marketing, Analyze. It is also available for immediate download and adjustment. So, changes can be made in the color, design, graphics or any other component to create a unique layout.

Marketing KPI Dashboard With Lead To Conversion Structure PDF
The following slide showcases KPI dashboard which can be used to monitor the performance of marketing campaign. The key metrics mentioned in the slide are average daily impressions, cost per click, leads to conversion rate, cost per conversion etc. Showcasing this set of slides titled Marketing KPI Dashboard With Lead To Conversion Structure PDF. The topics addressed in these templates are Impressions, Optimization, Cost. All the content presented in this PPT design is completely editable. Download it and make adjustments in color, background, font etc. as per your unique business setting.
Patient Healthcare Online Transformation Dashboard Ppt PowerPoint Presentation Icon Example File PDF
This slide displays the dashboard depicting the results of patients after the digital transformation. It includes the daily activity of the patients on the app, appointments, water balance, etc. Pitch your topic with ease and precision using this Patient Healthcare Online Transformation Dashboard Ppt PowerPoint Presentation Icon Example File PDF. This layout presents information on General Health, Water Balance, Transformation Dashboard. It is also available for immediate download and adjustment. So, changes can be made in the color, design, graphics or any other component to create a unique layout.
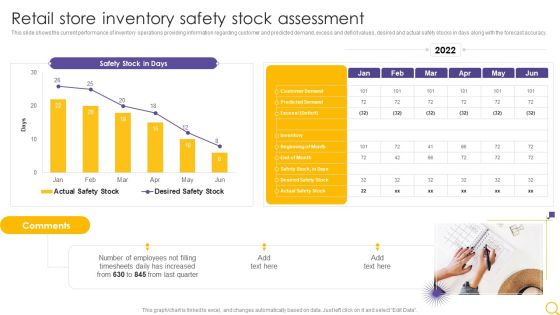
Retail Outlet Operational Efficiency Analytics Retail Store Inventory Safety Stock Assessment Template PDF
This slide shows the current performance of inventory operations providing information regarding customer and predicted demand, excess and deficit values, desired and actual safety stocks in days along with the forecast accuracy. Deliver an awe inspiring pitch with this creative Retail Outlet Operational Efficiency Analytics Retail Store Inventory Safety Stock Assessment Template PDF bundle. Topics like Safety Stock Days, Employees, Timesheets Daily can be discussed with this completely editable template. It is available for immediate download depending on the needs and requirements of the user.
Youtube Video Marketing Analytics Dashboard Ppt Icon Portrait PDF
This slide covers dashboard illustrating performance of ad campaigns on YouTube. It includes elements such as total gained subscribers, likes, dislikes, daily active users, views, campaign performance, traffic sources by views, etc. Pitch your topic with ease and precision using this Youtube Video Marketing Analytics Dashboard Ppt Icon Portrait PDF. This layout presents information on Average Vies, Per Week, Campaigns, Traffic Sources. It is also available for immediate download and adjustment. So, changes can be made in the color, design, graphics or any other component to create a unique layout.

Call Center Communication Kpis Performance Dashboard With First Call Resolution Rate Graphics PDF
This slide showcases dashboard that can help organization to analyze the performance of call center agents communication KPIs and take necessary actions in case of high abandonment rate. Its key components are average response time, first call resolution and top performing call agents. Showcasing this set of slides titled Call Center Communication Kpis Performance Dashboard With First Call Resolution Rate Graphics PDF. The topics addressed in these templates are Overall Average, Response Time, First Call Resolution, Daily Abandonment Rate. All the content presented in this PPT design is completely editable. Download it and make adjustments in color, background, font etc. as per your unique business setting.
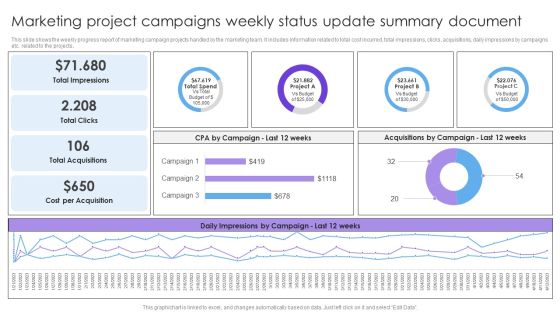
Marketing Project Campaigns Weekly Status Update Summary Document Formats PDF
This slide shows the weekly progress report of marketing campaign projects handled by the marketing team. It includes information related to total cost incurred, total impressions, clicks, acquisitions, daily impressions by campaigns etc. related to the projects. Pitch your topic with ease and precision using this Marketing Project Campaigns Weekly Status Update Summary Document Formats PDF. This layout presents information on Total Impressions, Total Clicks, Total Acquisitions. It is also available for immediate download and adjustment. So, changes can be made in the color, design, graphics or any other component to create a unique layout.
Non Fungible Token Methodology IT NFT Transaction Analysis And Tracking Dashboard Brochure PDF
This slide demonstrates the dashboard for tracking NFT transactions and analysis based on daily sales, ETH volume collections, and so on. Create an editable Non Fungible Token Methodology IT NFT Transaction Analysis And Tracking Dashboard Brochure PDF that communicates your idea and engages your audience. Whether youre presenting a business or an educational presentation, pre-designed presentation templates help save time. Non Fungible Token Methodology IT NFT Transaction Analysis And Tracking Dashboard Brochure PDF is highly customizable and very easy to edit, covering many different styles from creative to business presentations. Slidegeeks has creative team members who have crafted amazing templates. So, go and get them without any delay.
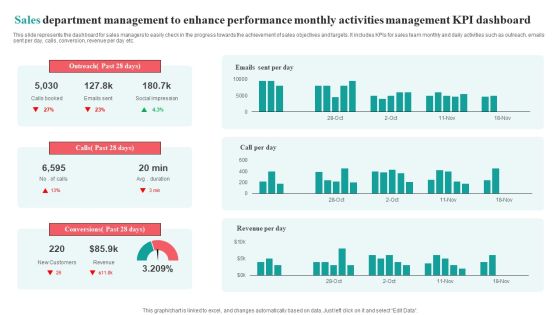
Sales Department Management To Enhance Performance Monthly Activities Management KPI Dashboard Brochure PDF
This slide represents the dashboard for sales managers to easily check in the progress towards the achievement of sales objectives and targets. It includes KPIs for sales team monthly and daily activities such as outreach, emails sent per day, calls, conversion, revenue per day etc.Pitch your topic with ease and precision using this Sales Department Management To Enhance Performance Monthly Activities Management KPI Dashboard Brochure PDF. This layout presents information on Social Impression, Conversions Past, Outreach Past. It is also available for immediate download and adjustment. So, changes can be made in the color, design, graphics or any other component to create a unique layout.

KPI Dashboard For ESO System Ppt PowerPoint Presentation File Template PDF
This slide covers kpi dashboard for enterprise security operations. It involves details such as active alerts, active automated investigation, devices with major issues and report of daily devices. Pitch your topic with ease and precision using this KPI Dashboard For ESO System Ppt PowerPoint Presentation File Template PDF. This layout presents information on Security Health, Misconfigured, Service Operating Normally. It is also available for immediate download and adjustment. So, changes can be made in the color, design, graphics or any other component to create a unique layout.

Quarterly Analysis Dashboard Of Managing Promotional Activities Ideas PDF
The following slide presents the kpis of marketing operations to assess the performance. It includes quarterly values of elements such as budgeted vs actual total expenditure, impressions, cost per acquisition, clicks etc. Showcasing this set of slides titled Quarterly Analysis Dashboard Of Managing Promotional Activities Ideas PDF. The topics addressed in these templates are Campaign Wise, Daily Impression, Total Impression, Total Clicks. All the content presented in this PPT design is completely editable. Download it and make adjustments in color, background, font etc. as per your unique business setting.
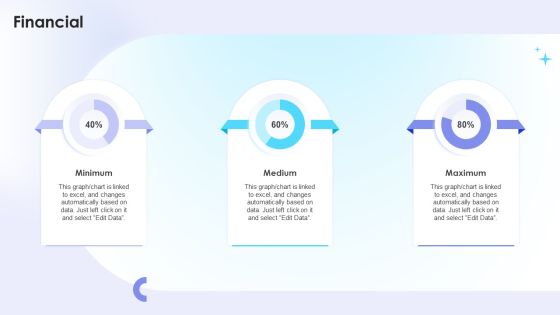
Dual Branding Campaign To Boost Sales Of Product Or Services Financial Structure PDF
Whether you have daily or monthly meetings, a brilliant presentation is necessary. Dual Branding Campaign To Boost Sales Of Product Or Services Financial Structure PDF can be your best option for delivering a presentation. Represent everything in detail using Dual Branding Campaign To Boost Sales Of Product Or Services Financial Structure PDF and make yourself stand out in meetings. The template is versatile and follows a structure that will cater to your requirements. All the templates prepared by Slidegeeks are easy to download and edit. Our research experts have taken care of the corporate themes as well. So, give it a try and see the results.
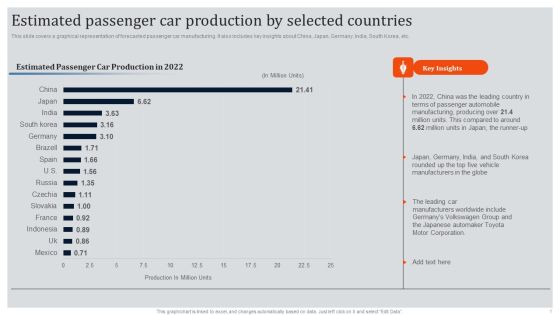
Global Automotive Industry Research And Analysis Estimated Passenger Car Production By Selected Countries Infographics PDF
Whether you have daily or monthly meetings, a brilliant presentation is necessary. Global Automotive Industry Research And Analysis Estimated Passenger Car Production By Selected Countries Infographics PDF can be your best option for delivering a presentation. Represent everything in detail using Global Automotive Industry Research And Analysis Estimated Passenger Car Production By Selected Countries Infographics PDF and make yourself stand out in meetings. The template is versatile and follows a structure that will cater to your requirements. All the templates prepared by Slidegeeks are easy to download and edit. Our research experts have taken care of the corporate themes as well. So, give it a try and see the results.

Talent Administration And Succession HR Performance Management Dashboard Background PDF
Whether you have daily or monthly meetings, a brilliant presentation is necessary. Talent Administration And Succession HR Performance Management Dashboard Background PDF can be your best option for delivering a presentation. Represent everything in detail using Talent Administration And Succession HR Performance Management Dashboard Background PDF and make yourself stand out in meetings. The template is versatile and follows a structure that will cater to your requirements. All the templates prepared by Slidegeeks are easy to download and edit. Our research experts have taken care of the corporate themes as well. So, give it a try and see the results.
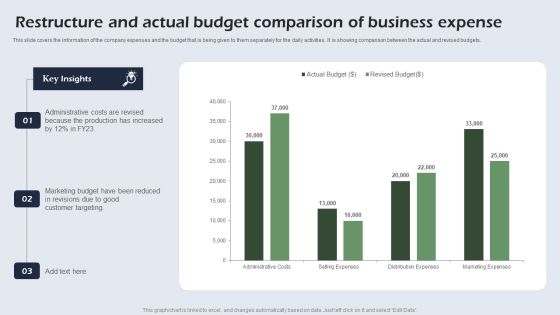
Restructure And Actual Budget Comparison Of Business Expense Portrait PDF
This slide covers the information of the company expenses and the budget that is being given to them separately for the daily activities. It is showing comparison between the actual and revised budgets. Showcasing this set of slides titled Restructure And Actual Budget Comparison Of Business Expense Portrait PDF. The topics addressed in these templates are Administrative Costs, Marketing Budget, Customer Targeting. All the content presented in this PPT design is completely editable. Download it and make adjustments in color, background, font etc. as per your unique business setting.

Cloud Computing Scalability Cost Management Dashboard In Cloud Management Platform Professional PDF
Whether You Have Daily Or Monthly Meetings, A Brilliant Presentation Is Necessary. Cloud Computing Scalability Cost Management Dashboard In Cloud Management Platform Professional Pdf Can Be Your Best Option For Delivering A Presentation. Represent Everything In Detail Using Cloud Computing Scalability Cost Management Dashboard In Cloud Management Platform Professional Pdf And Make Yourself Stand Out In Meetings. The Template Is Versatile And Follows A Structure That Will Cater To Your Requirements. All The Templates Prepared By Slidegeeks Are Easy To Download And Edit. Our Research Experts Have Taken Care Of The Corporate Themes As Well. So, Give It A Try And See The Results.
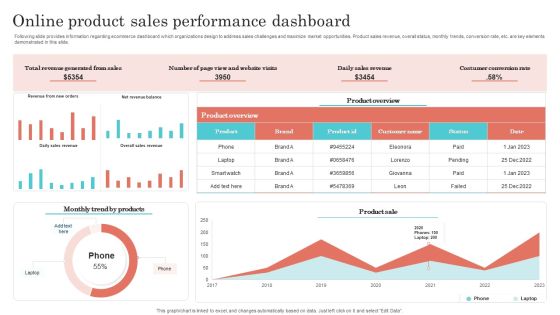
Online Product Sales Performance Dashboard Designs PDF
Following slide provides information regarding ecommerce dashboard which organizations design to address sales challenges and maximize market opportunities. Product sales revenue, overall status, monthly trends, conversion rate, etc. are key elements demonstrated in this slide. Showcasing this set of slides titled Online Product Sales Performance Dashboard Designs PDF. The topics addressed in these templates are Revenue Generated From Sales, Daily Sales Revenue, Costumer Conversion Rate. All the content presented in this PPT design is completely editable. Download it and make adjustments in color, background, font etc. as per your unique business setting.

Cloud Platform Dashboard For Tracking Project Team Activities Microsoft PDF
The following slide depicts project team task tracking cloud dashboard. It provides information about hours worked, projects worked, time spent, daily limit, product design, weekly activity, etc. Create an editable Cloud Platform Dashboard For Tracking Project Team Activities Microsoft PDF that communicates your idea and engages your audience. Whether you are presenting a business or an educational presentation, pre-designed presentation templates help save time. Cloud Platform Dashboard For Tracking Project Team Activities Microsoft PDF is highly customizable and very easy to edit, covering many different styles from creative to business presentations. Slidegeeks has creative team members who have crafted amazing templates. So, go and get them without any delay.

Storage Facility Logistics And Productivity Management Dashboard Summary PDF
This slide showcases a dashboard for monitoring and tracking warehouse operations productivity. It includes key components such as time period, revenue, costs, profit, shipments, average daily time, fleet status, profit by country, average delivery time, etc. Showcasing this set of slides titled Storage Facility Logistics And Productivity Management Dashboard Summary PDF. The topics addressed in these templates are Fleet Status, Delivery Status, Deliveries By Country. All the content presented in this PPT design is completely editable. Download it and make adjustments in color, background, font etc. as per your unique business setting.

Storage Facility Orders Productivity Management Dashboard Diagrams PDF
This slide showcases a dashboard for tracking and managing orders productivity performance at warehouse. It includes key components such as collection time, daily orders, number of workers per shift, top ordered products and least ordered products. Showcasing this set of slides titled Storage Facility Orders Productivity Management Dashboard Diagrams PDF. The topics addressed in these templates are Top Most Ordered Products, Least Ordered Products, Orders Per Day. All the content presented in this PPT design is completely editable. Download it and make adjustments in color, background, font etc. as per your unique business setting.
Google Adwords Strategic Campaign Performance Tracking Dashboard Icons PDF
This slide showcases KPI dashboard for real time tracking of performance metrics for google adwords campaign. It includes elements such as cost interactions, impressions, device, etc. Showcasing this set of slides titled Google Adwords Strategic Campaign Performance Tracking Dashboard Icons PDF. The topics addressed in these templates are Campaign Performance Device, Interaction Rate Cost Device, Daily Cost Device. All the content presented in this PPT design is completely editable. Download it and make adjustments in color, background, font etc. as per your unique business setting.

O RAN Architecture Current Challenges And Limitations Of Open Ran Infographics PDF
This slide depicts open RANs current challenges and limitations, including functional and protocol compliance, maintenance and daily operations, system performance and robustness, and others. Slidegeeks is one of the best resources for PowerPoint templates. You can download easily and regulate O RAN Architecture Current Challenges And Limitations Of Open Ran Infographics PDF for your personal presentations from our wonderful collection. A few clicks is all it takes to discover and get the most relevant and appropriate templates. Use our Templates to add a unique zing and appeal to your presentation and meetings. All the slides are easy to edit and you can use them even for advertisement purposes.
Nft Transaction Analysis And Tracking Dashboard Ppt PowerPoint Presentation File Layouts PDF
This slide demonstrates the dashboard for tracking NFT transactions and analysis based on daily sales, ETH volume collections, and so on. Present like a pro with Nft Transaction Analysis And Tracking Dashboard Ppt PowerPoint Presentation File Layouts PDF Create beautiful presentations together with your team, using our easy to use presentation slides. Share your ideas in real time and make changes on the fly by downloading our templates. So whether you are in the office, on the go, or in a remote location, you can stay in sync with your team and present your ideas with confidence. With Slidegeeks presentation got a whole lot easier. Grab these presentations today.
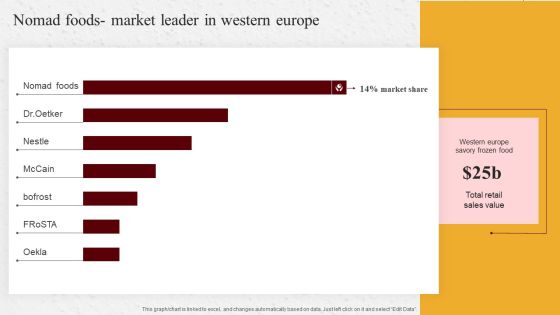
Industry Report Of Packaged Food Products Part 2 Nomad Foods Market Pictures PDF
Whether you have daily or monthly meetings, a brilliant presentation is necessary. Industry Report Of Packaged Food Products Part 2 Nomad Foods Market Pictures PDF can be your best option for delivering a presentation. Represent everything in detail using Industry Report Of Packaged Food Products Part 2 Nomad Foods Market Pictures PDF and make yourself stand out in meetings. The template is versatile and follows a structure that will cater to your requirements. All the templates prepared by Slidegeeks are easy to download and edit. Our research experts have taken care of the corporate themes as well. So, give it a try and see the results.

New Orders Logistics Management Dashboard With Delivery Status Designs PDF
This slide showcases shipping management dashboard that can help company to daily track the status of their new orders shipped. Its key components are recent orders, items ordered, items shipped and total shipped orders. Pitch your topic with ease and precision using this New Orders Logistics Management Dashboard With Delivery Status Designs PDF. This layout presents information on Recent Orders, Current Shipping Status, New Orders. It is also available for immediate download and adjustment. So, changes can be made in the color, design, graphics or any other component to create a unique layout.
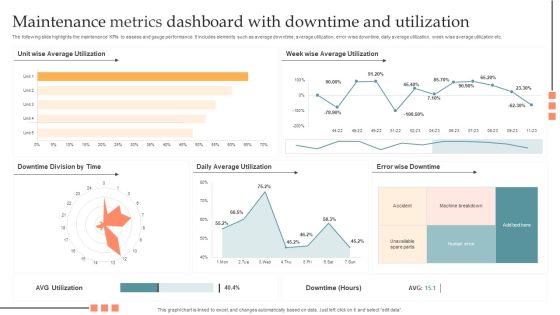
Maintenance Metrics Dashboard With Downtime And Utilization Pictures PDF
The following slide highlights the maintenance KPIs to assess and gauge performance. It includes elements such as average downtime, average utilization, error wise downtime, daily average utilization, week wise average utilization etc. Showcasing this set of slides titled Maintenance Metrics Dashboard With Downtime And Utilization Pictures PDF. The topics addressed in these templates are Maintenance Metrics Dashboard, Downtime And Utilization. All the content presented in this PPT design is completely editable. Download it and make adjustments in color, background, font etc. as per your unique business setting.

Addressing Insurance Product Sales Estimation Formats PDF
This slide provides information regarding the insurance and financial products sales estimation for upcoming five years. Whether you have daily or monthly meetings, a brilliant presentation is necessary. Addressing Insurance Product Sales Estimation Formats PDF can be your best option for delivering a presentation. Represent everything in detail using Addressing Insurance Product Sales Estimation Formats PDF and make yourself stand out in meetings. The template is versatile and follows a structure that will cater to your requirements. All the templates prepared by Slidegeeks are easy to download and edit. Our research experts have taken care of the corporate themes as well. So, give it a try and see the results.

Current Scenario For Customer Support Service Ppt File Background PDF
This slide represents current scenario for customer support service. It includes average response time on daily basis on which customers queries are resolved or addressed. Slidegeeks is one of the best resources for PowerPoint templates. You can download easily and regulate Current Scenario For Customer Support Service Ppt File Background PDF for your personal presentations from our wonderful collection. A few clicks is all it takes to discover and get the most relevant and appropriate templates. Use our Templates to add a unique zing and appeal to your presentation and meetings. All the slides are easy to edit and you can use them even for advertisement purposes.

Call Center Kpis Agent Performance Dashboard Clipart PDF
This slide covers contact center agent performance metrics KPI dashboard. It involves metrics such as number of calls, average response time, average hold time, daily average transfer rate and agents with most hold time and transfer rate. Showcasing this set of slides titled Call Center Kpis Agent Performance Dashboard Clipart PDF. The topics addressed in these templates are Transfer Rate, Call Center, Hold Time. All the content presented in this PPT design is completely editable. Download it and make adjustments in color, background, font etc. as per your unique business setting.

Dashboard To Measure Robotic Process Automation Bots Performance Structure PDF
This slide presents a dashboard to measure RPA bots performance in an organization. It includes utilization hours, bot types, average daily utilization, percentage of errors that occurred by bots, and occupied bots by business operations. If your project calls for a presentation, then Slidegeeks is your go-to partner because we have professionally designed, easy-to-edit templates that are perfect for any presentation. After downloading, you can easily edit Dashboard To Measure Robotic Process Automation Bots Performance Structure PDF and make the changes accordingly. You can rearrange slides or fill them with different images. Check out all the handy templates

Assessment Of Amazon Brand Performance Dashboard To Track Amazon Web Guidelines PDF
This slide provides information regarding the dashboard to monitor AWS performance. The KPIs include tracking daily cost, hosting MTD, total vs. budget, on-demand vs. reservations, etc. Create an editable Assessment Of Amazon Brand Performance Dashboard To Track Amazon Web Guidelines PDF that communicates your idea and engages your audience. Whether you are presenting a business or an educational presentation, pre-designed presentation templates help save time. Assessment Of Amazon Brand Performance Dashboard To Track Amazon Web Guidelines PDF is highly customizable and very easy to edit, covering many different styles from creative to business presentations. Slidegeeks has creative team members who have crafted amazing templates. So, go and get them without any delay.

Digital Wellbeing And IOT And Remote Management Professional PDF
This slide provide a dashboard for tracking the daily time spent on mobile phone social media applications that helps to keep a track of screen time and take necessary actions for individual health. Key components are time spent, social media apps, etc. Showcasing this set of slides titled Digital Wellbeing And IOT And Remote Management Professional PDF. The topics addressed in these templates are Trend, Dashboard, Digital Wellbeing. All the content presented in this PPT design is completely editable. Download it and make adjustments in color, background, font etc. as per your unique business setting.
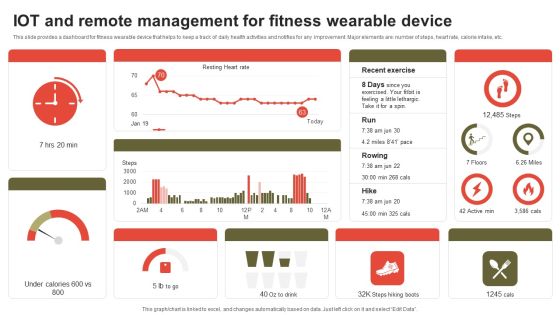
IOT And Remote Management For Fitness Wearable Device Download PDF
This slide provides a dashboard for fitness wearable device that helps to keep a track of daily health activities and notifies for any improvement. Major elements are number of steps, heart rate, calorie intake, etc. Showcasing this set of slides titled IOT And Remote Management For Fitness Wearable Device Download PDF. The topics addressed in these templates are Recent Exercise, Run, Rowing. All the content presented in this PPT design is completely editable. Download it and make adjustments in color, background, font etc. as per your unique business setting.

Client Health Score Measurement Survey Result Download PDF
This slide provides information about how frequently managers measure the customer health score in an organization to reduce the churn rate of users. It includes elements such as sample size key insights, quarterly, annually, daily and weekly. Showcasing this set of slides titled Client Health Score Measurement Survey Result Download PDF. The topics addressed in these templates are Reduce Churn Rate, Improves Efficiency, Provide Innovation Products. All the content presented in this PPT design is completely editable. Download it and make adjustments in color, background, font etc. as per your unique business setting.
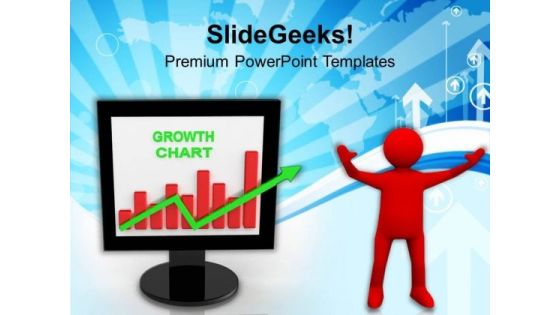
Successful Man Showing Growth In Business Chart PowerPoint Templates Ppt Backgrounds For Slides 0113
We present our Successful Man Showing Growth In Business Chart PowerPoint Templates PPT Backgrounds For Slides 0113.Present our Technology PowerPoint Templates because You are well armed with penetrative ideas. Our PowerPoint Templates and Slides will provide the gunpowder you need. Download our Finance PowerPoint Templates because you should once Tap the ingenuity of our PowerPoint Templates and Slides. They are programmed to succeed. Download our Business PowerPoint Templates because It will Raise the bar of your Thoughts. They are programmed to take you to the next level. Download and present our Computer PowerPoint Templates because Our PowerPoint Templates and Slides are created with admirable insight. Use them and give your group a sense of your logical mind. Present our Arrows PowerPoint Templates because Our PowerPoint Templates and Slides will let you meet your Deadlines.Use these PowerPoint slides for presentations relating to Man showing financial growth chart, business, finance, technology, computer, arrows. The prominent colors used in the PowerPoint template are Green, Red, White. People tell us our Successful Man Showing Growth In Business Chart PowerPoint Templates PPT Backgrounds For Slides 0113 will generate and maintain the level of interest you desire. They will create the impression you want to imprint on your audience. People tell us our business PowerPoint templates and PPT Slides will help them to explain complicated concepts. PowerPoint presentation experts tell us our Successful Man Showing Growth In Business Chart PowerPoint Templates PPT Backgrounds For Slides 0113 are designed by a team of presentation professionals. PowerPoint presentation experts tell us our business PowerPoint templates and PPT Slides have awesome images to get your point across. Presenters tell us our Successful Man Showing Growth In Business Chart PowerPoint Templates PPT Backgrounds For Slides 0113 will make the presenter successul in his career/life. The feedback we get is that our finance PowerPoint templates and PPT Slides will make you look like a winner.

PowerPoint Slide Designs Chart Intercompany Process Ppt Theme
PowerPoint Slide Designs Chart Intercompany Process PPT Theme-PowerPoint Slide layout Image Intercompany Process PPT Design-The Circle of Life - a concept emmbedded in our minds and hence easy to comprehend. Life and Business is made up of processes comprising stages that flow from one to another. An excellent graphic to attract the attention of and understanding by your audience to improve earnings.-PowerPoint Slide Designs Chart Intercompany Process PPT Theme

PowerPoint Backgrounds Chart Circular Process Ppt Design Slides
PowerPoint Backgrounds Chart Circular Process PPT Design Slides-Cycle Diagrams are a type of graphics that shows how items are related to one another in a repeating cycle. In a cycle diagram, you can explain the main events in the cycle, how they interact, and how the cycle repeats. These Diagrams can be used to interact visually and logically with audiences.-PowerPoint Backgrounds Chart Circular Process PPT Design Slides

Business Circle Charts PowerPoint Templates Business Gears Process Ppt Slides
Business Circle Charts PowerPoint Templates Business Gears Process PPT Slides-This PowerPoint diagram shows gears aligned and working together. Can represent processing or teamwork-Business Circle Charts PowerPoint Templates Business Gears Process PPT Slides-This template can be used for presentations relating to 3d, Business, Circle, Circular, Clockwork, Cogs, Cogwheel, Colorful, Colors, Community, Component, Concept, Cooperate, Cooperation, Cycle, Cyclical, Different, Diverse, Diversity, Gear, Geometric, Hi-Tech, Idea, Industrial, Industry, Machine, Machinery, Mechanical, Mechanics, Round, Process,Progress
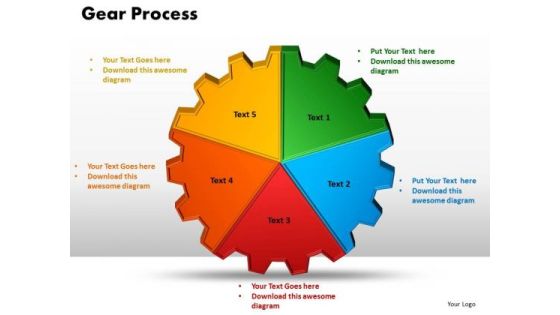
Business Circle Charts PowerPoint Templates Growth Gears Process Ppt Slides
Business Circle Charts PowerPoint Templates Growth Gears Process PPT Slides-Geared devices can change the speed, and direction of a power source. Use this graphic to explain sustainability objectives.-Business Circle Charts PowerPoint Templates Growth Gears Process PPT Slides-This template can be used for presentations relating to Activity, Background, Block, Box, Brick, Build, Buildings, Child, Childhood, Colourful, Concept, Connect, Connection, Construction, Cube, Design, Development, Education, Element, Fun, Game, Geometric

Business Circle Charts PowerPoint Templates Leadership Gears Process Ppt Slides
Business Circle Charts PowerPoint Templates Leadership Gears Process PPT Slides-This PowerPoint diagram shows gears aligned and working together. Can represent processing or teamwork-Business Circle Charts PowerPoint Templates Leadership Gears Process PPT Slides-This template can be used for presentations relating to 3d, Business, Circle, Circular, Clockwork, Cogs, Cogwheel, Colorful, Colors, Community, Component, Concept, Cooperate, Cooperation, Cycle, Cyclical, Different, Diverse, Diversity, Gear, Geometric, Hi-Tech, Idea, Industrial, Industry, Machine, Machinery, Mechanical, Mechanics, Round, Process,Progress
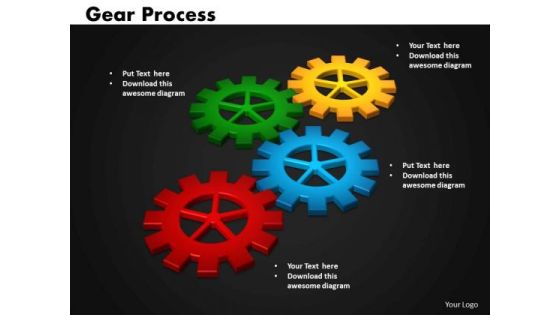
Business Circle Charts PowerPoint Templates Teamwork Gears Process Ppt Slides
Business Circle Charts PowerPoint Templates Teamwork Gears Process PPT Slides-This PowerPoint diagram slide shows gears aligned and working together. Can represent processing or teamwork-Business Circle Charts PowerPoint Templates Teamwork Gears Process PPT Slides-This template can be used for presentations relating to 3d, Business, Circle, Circular, Clockwork, Cogs, Cogwheel, Colorful, Colors, Community, Component, Concept, Cooperate, Cooperation, Cycle, Cyclical, Different, Diverse, Diversity, Gear, Geometric, Hi-Tech, Idea, Industrial, Industry, Machine, Machinery, Mechanical, Mechanics, Round, Process,Progress
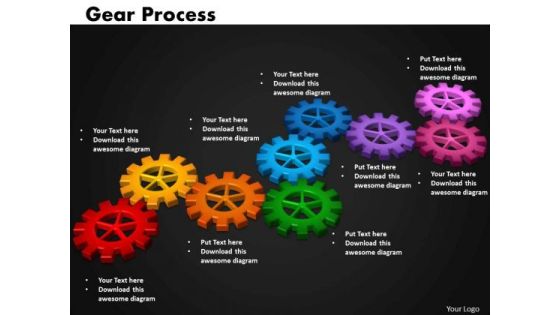
Business Circular Charts PowerPoint Templates Growth Gears Process Ppt Slides
Business Circular Charts PowerPoint Templates Growth Gears Process PPT Slides-Geared devices can change the speed, and direction of a power source. Use this graphic to explain sustainability objectives.-Business Circular Charts PowerPoint Templates Growth Gears Process PPT Slides-This template can be used for presentations relating to 3d, Business, Circle, Circular, Clockwork, Cogs, Cogwheel, Colorful, Colors, Community, Component, Concept, Cooperate, Cooperation, Cycle, Cyclical, Different, Diverse, Diversity, Gear, Geometric, Hi-Tech, Idea, Industrial, Industry, Machine, Machinery, Mechanical, Mechanics, Round, Process,Progress

Business Circular Charts PowerPoint Templates Success Gears Process Ppt Slides
Business Circular Charts PowerPoint Templates Success Gears Process PPT Slides-Use this graphics for most important events during the event identification and analysis stage. -Business Circular Charts PowerPoint Templates Success Gears Process PPT Slides-This template can be used for presentations relating to 3d, Business, Circle, Circular, Clockwork, Cogs, Cogwheel, Colorful, Colors, Community, Component, Concept, Cooperate, Cooperation, Cycle, Cyclical, Different, Diverse, Diversity, Gear, Geometric, Hi-Tech, Idea, Industrial, Industry, Machine, Machinery, Mechanical, Mechanics, Round, Process,Progress
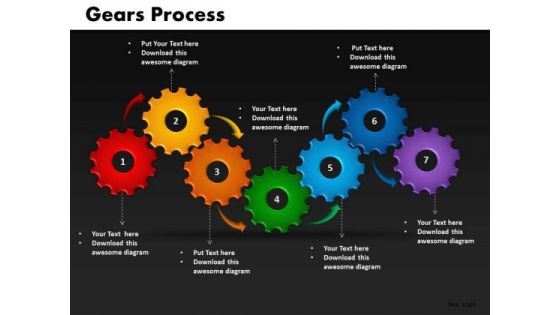
Business Circular Charts PowerPoint Templates Teamworks Gears Process Ppt Slides
Business Circular Charts PowerPoint Templates Teamworks Gears Process PPT Slides-This PowerPoint diagram slide shows gears aligned and working together. Can represent processing or teamwork-Business Circular Charts PowerPoint Templates Teamworks Gears Process PPT Slides-This template can be used for presentations relating to 3d, Business, Circle, Circular, Clockwork, Cogs, Cogwheel, Colorful, Colors, Community, Component, Concept, Cooperate, Cooperation, Cycle, Cyclical, Different, Diverse, Diversity, Gear, Geometric, Hi-Tech, Idea, Industrial, Industry, Machine, Machinery, Mechanical, Mechanics, Round, Process,Progress
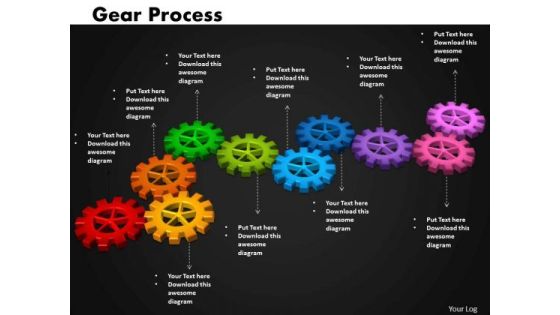
Business Cycle Charts PowerPoint Templates Business Gears Process Ppt Slides
Business Cycle Charts PowerPoint Templates Business Gears Process PPT Slides-Graphic gears Process is a mechanism or group of parts performing one function or serving one purpose in a complex situation-Business Cycle Charts PowerPoint Templates Business Gears Process PPT Slides-This template can be used for presentations relating to 3d, Business, Circle, Circular, Clockwork, Cogs, Cogwheel, Colorful, Colors, Community, Component, Concept, Cooperate, Cooperation, Cycle, Cyclical, Different, Diverse, Diversity, Gear, Geometric, Hi-Tech, Idea, Industrial, Industry, Machine, Machinery, Mechanical, Mechanics, Round, Process,Progress

Business Cycle Charts PowerPoint Templates Growth Gears Process Ppt Slides
Business Cycle Charts PowerPoint Templates Growth Gears Process PPT Slides-Geared devices can change the speed, and direction of a power source. Use this graphic to explain sustainability objectives.-Business Cycle Charts PowerPoint Templates Growth Gears Process PPT Slides-This template can be used for presentations relating to 3d, Business, Circle, Circular, Clockwork, Cogs, Cogwheel, Colorful, Colors, Community, Component, Concept, Cooperate, Cooperation, Cycle, Cyclical, Different, Diverse, Diversity, Gear, Geometric, Hi-Tech, Idea, Industrial, Industry, Machine, Machinery, Mechanical, Mechanics, Round, Process,Progress
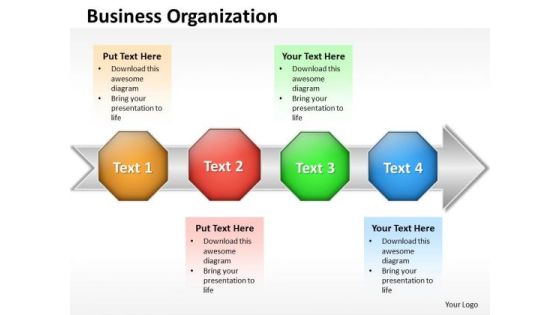
Ppt Business Download PowerPoint Layouts Organization Flow Chart Templates
PPT business download powerpoint layouts organization flow chart Templates-This PowerPoint Diagram shows you the Continual Representation of four different approaches on the Arrow. It signifies endless, enduring, eternal, everlasting, frequent, interminable, oft-repeated, permanent, perpetual, persistent, persisting, recurrent etc.-PPT business download powerpoint layouts organization flow chart Templates-3d, Advertisement, Advertising, Arrow, Border, Business, Circles, Collection, Customer, Design, Element, Icon, Idea, Illustration, Info, Information, Isolated, Label, Light, Location, Needle, New, Notification, Notify, Point, Pointer, Promotion, Role, Rounded

Logistics Shipment Company Profile Organization Chart Ppt Styles Guide PDF
This is a Logistics Shipment Company Profile Organization Chart Ppt Styles Guide PDF template with various stages. Focus and dispense information on six stages using this creative set, that comes with editable features. It contains large content boxes to add your information on topics like Organization Chart, VP Global Communications, Investor Relations, Team Members. You can also showcase facts, figures, and other relevant content using this PPT layout. Grab it now.
Staff HR Recruitment Process Flow Chart Icon Slides PDF
Persuade your audience using this Staff HR Recruitment Process Flow Chart Icon Slides PDF. This PPT design covers three stages, thus making it a great tool to use. It also caters to a variety of topics including Process Flow Chart Icon, Staff Hr Recruitment. Download this PPT design now to present a convincing pitch that not only emphasizes the topic but also showcases your presentation skills.

Testing Agile Scrum Company Chart Ppt PowerPoint Presentation File Gallery PDF
This slide provides the glimpse about the testing agile enterprise organization structure which focuses on portfolio, program and team along with team members details. Do you have an important presentation coming up Are you looking for something that will make your presentation stand out from the rest Look no further than Testing Agile Scrum Company Chart Ppt PowerPoint Presentation File Gallery PDF. With our professional designs, you can trust that your presentation will pop and make delivering it a smooth process. And with Slidegeeks, you can trust that your presentation will be unique and memorable. So why wait Grab Testing Agile Scrum Company Chart Ppt PowerPoint Presentation File Gallery PDF today and make your presentation stand out from the rest.
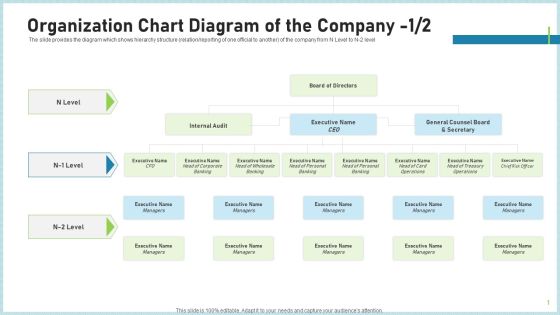
Pitch Deck To Attract Funding After IPO Market Organization Chart Diagram Of The Company Level Elements PDF
The slide provides the diagram which shows hierarchy structure relation or reporting of one official to another of the company from N Level to N 2 level Presenting pitch deck to attract funding after ipo market organization chart diagram of the company level elements pdf to provide visual cues and insights. Share and navigate important information on three stages that need your due attention. This template can be used to pitch topics like internal audit, executive name, general counsel board. In addtion, this PPT design contains high resolution images, graphics, etc, that are easily editable and available for immediate download.
Investor Deck For Procuring Funds From Money Market Organization Chart Diagram Of The Company Icon Elements PDF
The slide provides the diagram which shows hierarchy structure relation or reporting of one official to another of the company from N Level to N 2 level. Presenting investor deck for procuring funds from money market organization chart diagram of the company icon elements pdf to provide visual cues and insights. Share and navigate important information on three stages that need your due attention. This template can be used to pitch topics like internal audit, executive name, general counsel board and secretary. In addtion, this PPT design contains high resolution images, graphics, etc, that are easily editable and available for immediate download.

Key Stakeholders Identification And Classification Management Model Background PDF
This slide represents the framework for identifying and classifying the key stakeholders of the enterprise. It includes four steps of requirements engineering process such as define projects purpose, identify stakeholders and assessment of their ability to contribute and classification of stakeholders. Presenting Key Stakeholders Identification And Classification Management Model Background PDF to dispense important information. This template comprises Four stages. It also presents valuable insights into the topics including Requirements Engineering Process, Classification And Prioritization. This is a completely customizable PowerPoint theme that can be put to use immediately. So, download it and address the topic impactfully.
Financial Chart Representation PowerPoint Templates Ppt Backgrounds For Slides 0513
Our Financial Chart Representation PowerPoint Templates PPT Backgrounds For Slides will will follow the drill. They accomplish the task assigned to them. Do the drill with our Pie charts PowerPoint Templates. Your ideas will march ahead. Place the orders with your thoughts. Our Business PowerPoint Templates know the drill.

Column Chart Analysis Ppt PowerPoint Presentation Pictures Sample
Presenting this set of slides with name column chart analysis ppt powerpoint presentation pictures sample. The topics discussed in these slides are column chart, product, financial year, sales, marketing. This is a completely editable PowerPoint presentation and is available for immediate download. Download now and impress your audience.

Combo Chart Finance Ppt PowerPoint Presentation Summary Images
Presenting this set of slides with name combo chart finance ppt powerpoint presentation summary images. The topics discussed in these slides are combo chart, product, growth rate, market size, financial year. This is a completely editable PowerPoint presentation and is available for immediate download. Download now and impress your audience.

What Tasks Can Be Automated Within Social Media Platforms Achieving Operational Efficiency Elements PDF
The following slide outlines different tasks which can be automated within social media platforms such as Facebook, Instagram, and YouTube. Scheduling and publishing, data collection and reporting, social ads management social monitoring are the major tasks which can be automated.Deliver and pitch your topic in the best possible manner with this What Tasks Can Be Automated Within Social Media Platforms Achieving Operational Efficiency Elements PDF. Use them to share invaluable insights on Scheduling Publishing, Media Automation, Automaton Assist and impress your audience. This template can be altered and modified as per your expectations. So, grab it now.

Data Valuation And Monetization Various Data Monetization Enablers Designs PDF
This slide provides information about different growth drivers that enable firms to adopt data monetization procedures.Presenting Data Valuation And Monetization Various Data Monetization Enablers Designs PDF to provide visual cues and insights. Share and navigate important information on six stages that need your due attention. This template can be used to pitch topics like Enormous Increase, Daily Volumes, Enormous Decrease. In addtion, this PPT design contains high resolution images, graphics, etc, that are easily editable and available for immediate download.

Company Turnover Financial Ratios Chart Comparison Icons PDF
This slide illustrates graph for turnover ratios that are accounts receivable, inventory turnover, accounts payable turnover, fixed asset turnover and total assets turnover ratio. It showcases comparison of three companies. Pitch your topic with ease and precision using this company turnover financial ratios chart comparison icons pdf. This layout presents information on company turnover financial ratios chart comparison. It is also available for immediate download and adjustment. So, changes can be made in the color, design, graphics or any other component to create a unique layout.

Coverage Financial Ratios Chart For 5 Financial Years Themes PDF
This slide illustrates graph for coverage ratios that are interest coverage ratio, debt service coverage ratio and asset coverage ratio. It showcases comparison for a period of 5 years that can help company to measure ability to service its debt and meet its financial obligations Showcasing this set of slides titled coverage financial ratios chart for 5 financial years themes pdf. The topics addressed in these templates are coverage financial ratios chart for 5 financial years. All the content presented in this PPT design is completely editable. Download it and make adjustments in color, background, font etc. as per your unique business setting.

Debt To Equity Financial Ratios Chart Comparison Download PDF
This slide illustrates debt to equity ratio graph that can help to evaluate total debt and financial liabilities against the total shareholders equity. It showcases comparison for a period of last four quarters Pitch your topic with ease and precision using this debt to equity financial ratios chart comparison download pdf. This layout presents information on debt to equity financial ratios chart comparison. It is also available for immediate download and adjustment. So, changes can be made in the color, design, graphics or any other component to create a unique layout.

Dividend Payout Financial Ratios Chart Comparison Themes PDF
This slide showcases dividend payout ratio graph that can help organization to determine the percentage of the companys earnings that is paid out to shareholders by way of dividend. It showcases comparison for a period of 8 years Showcasing this set of slides titled dividend payout financial ratios chart comparison themes pdf. The topics addressed in these templates are dividend payout financial ratios chart comparison. All the content presented in this PPT design is completely editable. Download it and make adjustments in color, background, font etc. as per your unique business setting.


 Continue with Email

 Home
Home


