Percentage

Area Chart Ppt PowerPoint Presentation Icon Gallery
This is a area chart ppt powerpoint presentation icon gallery. This is a two stage process. The stages in this process are sales in percentage, product, bar graph.

Column Chart Ppt PowerPoint Presentation Professional Aids
This is a column chart ppt powerpoint presentation professional aids. This is a two stage process. The stages in this process are product, sales in percentage, financial years.

Line Chart Ppt PowerPoint Presentation Pictures Layout
This is a line chart ppt powerpoint presentation pictures layout. This is a two stage process. The stages in this process are product, financial years, sales in percentage.

Donut Pie Chart Ppt PowerPoint Presentation Show Outline
This is a donut pie chart ppt powerpoint presentation show outline. This is a six stage process. The stages in this process are business, marketing, percentage, chart, process.

Column Chart Ppt PowerPoint Presentation Gallery Layout
This is a column chart ppt powerpoint presentation gallery layout. This is a two stage process. The stages in this process are product, sales in percentage, year.
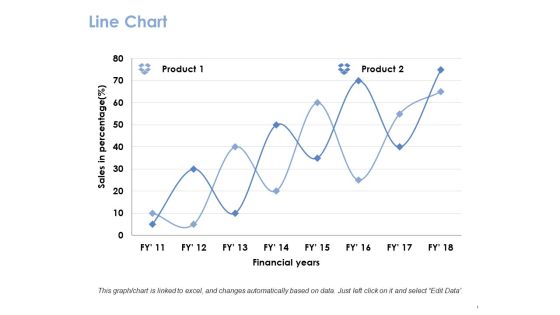
Line Chart Ppt PowerPoint Presentation Gallery Guide
This is a line chart ppt powerpoint presentation gallery guide. This is a two stage process. The stages in this process are product, financial years, sales in percentage.

Scatter Chart Ppt PowerPoint Presentation Show Sample
This is a scatter chart ppt powerpoint presentation show sample. This is a one stage process. The stages in this process are product, dollar, in percentage.

Bar Graph Ppt PowerPoint Presentation Ideas Display
This is a bar graph ppt powerpoint presentation ideas display. This is a two stage process. The stages in this process are product, sales in percentage, bar graph.

Area Chart Ppt PowerPoint Presentation Styles Brochure
This is a area chart ppt powerpoint presentation styles brochure. This is a two stage process. The stages in this process are product, financial years, in percentage.

Bubble Chart Ppt PowerPoint Presentation Layouts Demonstration
This is a bubble chart ppt powerpoint presentation icon structure. This is a three stage process. The stages in this process are product, sales in percentage, bubble chart.

Line Chart Ppt PowerPoint Presentation Layouts Templates
This is a line chart ppt powerpoint presentation layouts templates. This is a two stage process. The stages in this process are product, in percentage, in years.

Area Graph Ppt PowerPoint Presentation Slides Ideas
This is a area graph ppt powerpoint presentation slides ideas. This is a two stage process. The stages in this process are sales in percentage, financial year, product.

Scatter Bubble Chart Ppt PowerPoint Presentation Summary Slides
This is a scatter bubble chart ppt powerpoint presentation summary slides. This is a one stage process. The stages in this process are product, profit, in percentage.

Area Chart Ppt PowerPoint Presentation Styles Professional
This is a area chart ppt powerpoint presentation styles professional. This is a two stage process. The stages in this process are sales in percentage, product, area chart.

Bubble Chart Ppt PowerPoint Presentation Outline Demonstration
This is a bubble chart ppt powerpoint presentation outline demonstration. This is a two stage process. The stages in this process are bubble chart, product, in percentage.

Area Chart Ppt PowerPoint Presentation Layouts Gridlines
This is a area chart ppt powerpoint presentation layouts gridlines. This is a two stage process. The stages in this process are area chart, product, percentage, analysis, capture.
Line Chart Ppt PowerPoint Presentation Icon Inspiration
This is a line chart ppt powerpoint presentation icon inspiration. This is a two stage process. The stages in this process are product, financial years, sales in percentage.

Combo Chart Ppt PowerPoint Presentation Styles Format Ideas
This is a combo chart ppt powerpoint presentation styles format ideas. This is a three stage process. The stages in this process are percentage, product, marketing.

Clustered Column Line Ppt PowerPoint Presentation Layout
This is a clustered column line ppt powerpoint presentation layout. This is a three stage process. The stages in this process are percentage, product, business, management.

Area Chart Ppt PowerPoint Presentation Show Graphics
This is a area chart ppt powerpoint presentation show graphics. This is a three stage process. The stages in this process are percentage, product, marketing, management, business.

Combo Chart Ppt PowerPoint Presentation Slides Slideshow
This is a combo chart ppt powerpoint presentation slides slideshow. This is a three stage process. The stages in this process are percentage, product, marketing, management, business.

Column Chart Ppt PowerPoint Presentation Show Objects
This is a column chart ppt powerpoint presentation show objects. This is a two stage process. The stages in this process are percentage, product, business, management, marketing.

Column Chart Ppt PowerPoint Presentation Model Slideshow
This is a column chart ppt powerpoint presentation model slideshow. This is a two stage process. The stages in this process are percentage, product, business, marketing.

Combo Chart Ppt PowerPoint Presentation Styles Topics
This is a combo chart ppt powerpoint presentation styles topics. This is a three stage process. The stages in this process are percentage, product, business, management, marketing.

Clustered Column Product Ppt PowerPoint Presentation Show Guidelines
This is a clustered column product ppt powerpoint presentation show guidelines. This is a four stage process. The stages in this process are business, management, marketing, percentage, product.

Column Chart Financial Ppt PowerPoint Presentation Information
This is a column chart financial ppt powerpoint presentation information. This is a three stage process. The stages in this process are business, management, marketing, percentage, product.

Column Chart Marketing Ppt PowerPoint Presentation Summary Images
This is a column chart marketing ppt powerpoint presentation summary images. This is a three stage process. The stages in this process are business, management, marketing, product, percentage.

Column Chart Ppt PowerPoint Presentation Slides Clipart
This is a column chart ppt powerpoint presentation slides clipart. This is a two stage process. The stages in this process are business, management, marketing, percentage, product.
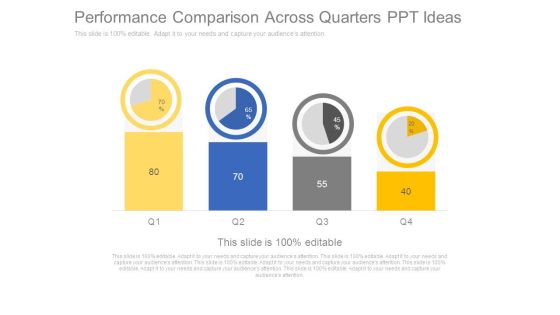
Performance Comparison Across Quarters Ppt Ideas
This is a performance comparison across quarters ppt ideas. This is a four stage process. The stages in this process are pie, growth, percentage, finance, business, marketing.

Big Data Database Comparison Ppt PowerPoint Presentation Outline
This is a big data database comparison ppt powerpoint presentation outline. This is a four stage process. The stages in this process are business, finance, management, percentage, growth.
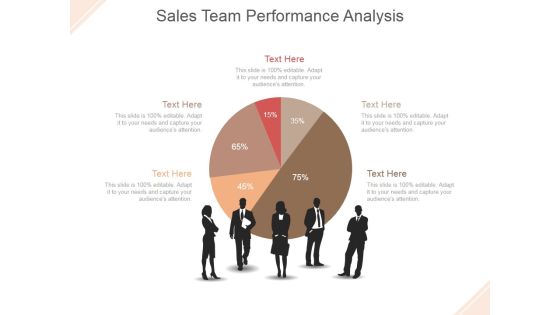
Sales Team Performance Analysis Ppt PowerPoint Presentation Inspiration
This is a sales team performance analysis ppt powerpoint presentation inspiration. This is a five stage process. The stage in this process are pie, finance, people, communication, percentage.
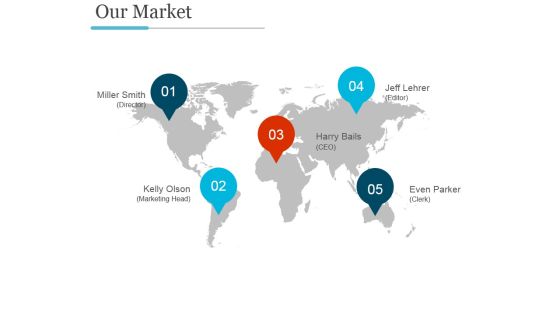
Our Market Template Ppt PowerPoint Presentation Design Templates
This is a our market template ppt powerpoint presentation design templates. This is a four stage process. The stages in this process are pie, percentage, finance, division, analysis.

Area Chart Ppt PowerPoint Presentation Picture
This is a area chart ppt powerpoint presentation picture. This is a two stage process. The stages in this process are product, in percentage, graph, management, business.

Bar Chart Ppt PowerPoint Presentation Microsoft
This is a bar chart ppt powerpoint presentation microsoft. This is a eleven stage process. The stages in this process are sales in percentage, fy, graph, success, business.

Clustered Column Ppt PowerPoint Presentation Ideas Show
This is a clustered column ppt powerpoint presentation ideas show. This is a two stage process. The stages in this process are product, percentage, finance, business, bar graph.

Clustered Bar Ppt PowerPoint Presentation Layouts Professional
This is a clustered bar ppt powerpoint presentation layouts professional. This is a two stage process. The stages in this process are clustered bar, product, profit, percentage.

Bar Graph Ppt PowerPoint Presentation Layouts Pictures
This is a bar graph ppt powerpoint presentation layouts pictures. This is a four stage process. The stages in this process are fire, earthquake, axis title, in percentage.

Combo Chart Ppt PowerPoint Presentation Portfolio Template
This is a combo chart ppt powerpoint presentation portfolio template. This is a three stage process. The stages in this process are product, business, marketing, combo chart, percentage.

Core Strategic Audience Powerpoint Graphics
This is a core strategic audience powerpoint graphics. This is a six stage process. The stages in this process are circular, growth, business, marketing, percentage.

Core Strategic Circular Diagram Powerpoint Images
This is a core strategic circular diagram powerpoint images. This is a six stage process. The stages in this process are circular, growth, business, marketing, percentage.
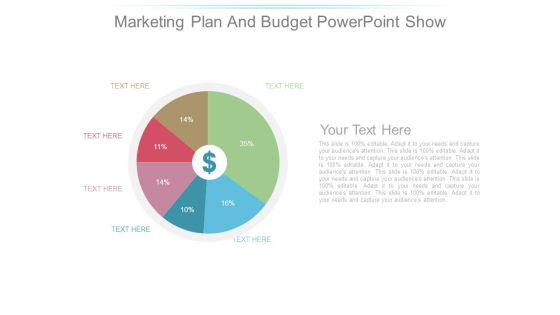
Marketing Plan And Budget Powerpoint Show
This is a marketing plan and budget powerpoint show. This is a six stage process. The stages in this process are growth, business, marketing, percentage, currency.
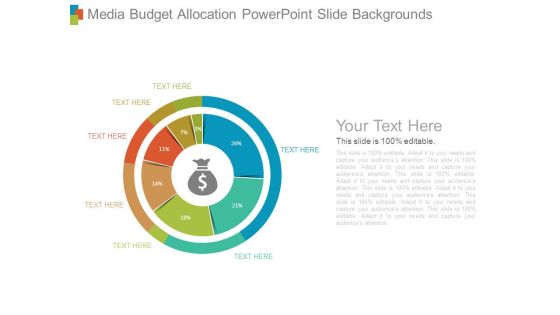
Media Budget Allocation Powerpoint Slide Backgrounds
This is a media budget allocation powerpoint slide backgrounds. This is a seven stage process. The stages in this process are growth, business, marketing, percentage, currency.
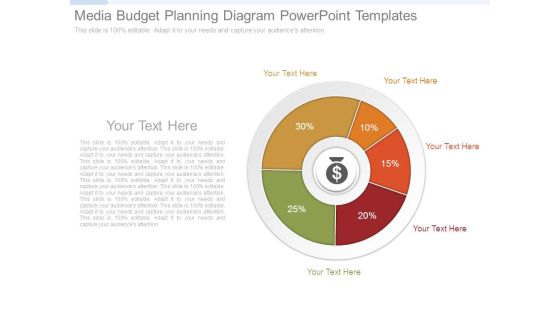
Media Budget Planning Diagram Powerpoint Templates
This is a media budget planning diagram powerpoint templates. This is a six stage process. The stages in this process are growth, business, marketing, percentage.

Possible Target Audiences Ppt Diagrams
This is a possible target audiences ppt diagrams. This is a seven stage process. The stages in this process are growth, business, marketing, percentage.
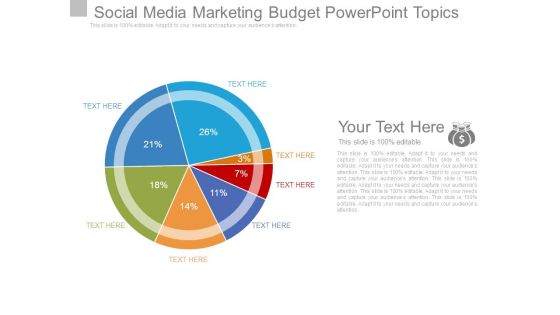
Social Media Marketing Budget Powerpoint Topics
This is a social media marketing budget powerpoint topics. This is a seven stage process. The stages in this process are pie, growth, business, marketing, percentage.
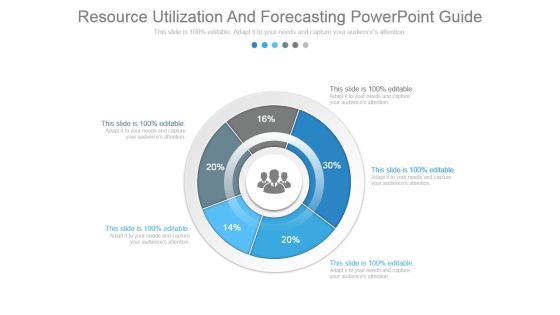
Resource Utilization And Forecasting Powerpoint Guide
This is a resource utilization and forecasting powerpoint guide. This is a five stage process. The stages in this process are donut, business, marketing, growth, percentage.
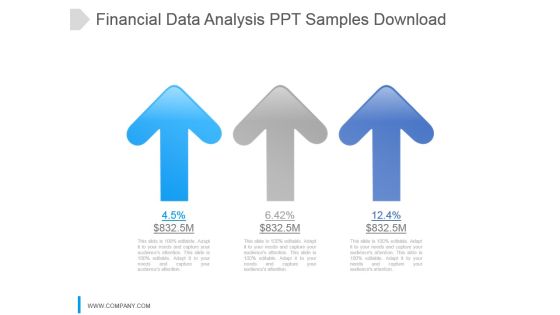
Financial Data Analysis Ppt Samples Download
This is a financial data analysis ppt samples download. This is a three stage process. The stages in this process are arrow, growth, percentage, finance, success.

Financial Performance Analysis Data Ppt PowerPoint Presentation Topics
This is a financial performance analysis data ppt powerpoint presentation topics. This is a three stage process. The stages in this process are finance, percentage, marketing, business, growth.
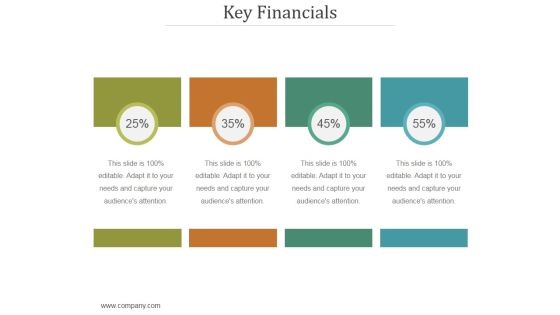
Key Financials Ppt PowerPoint Presentation Clipart
This is a key financials ppt powerpoint presentation clipart. This is a four stage process. The stages in this process are percentage, finance, success, growth, analysis.
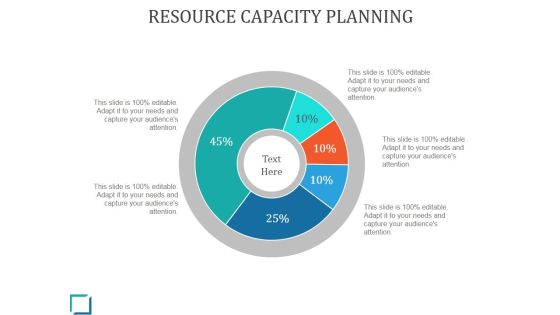
Resource Capacity Planning Ppt PowerPoint Presentation Example
This is a resource capacity planning ppt powerpoint presentation example. This is a five stage process. The stages in this process are pie, percentage, finance, management, growth.

Financial Ppt PowerPoint Presentation Ideas Show
This is a financial ppt powerpoint presentation ideas show. This is a four stage process. The stages in this process are percentage, finance, business, marketing, growth.

Area Chart Ppt PowerPoint Presentation Pictures Graphics Design
This is a area chart ppt powerpoint presentation pictures graphics design. This is a two stage process. The stages in this process are charts, success, finance, percentage, growth.

Competitor Positioning Ppt PowerPoint Presentation Styles Aids
This is a competitor positioning ppt powerpoint presentation styles aids. This is a two stage process. The stages in this process are company growth, business, percentage, finance, graph.

Comparison Ppt PowerPoint Presentation Layouts Gridlines
This is a comparison ppt powerpoint presentation layouts gridlines. This is a three stage process. The stages in this process are year, growth, success, percentage, finance.

Pie Chart Ppt PowerPoint Presentation Layouts Elements
This is a pie chart ppt powerpoint presentation layouts elements. This is a four stage process. The stages in this process are product, business, marketing, percentage, growth.
Pie Ppt PowerPoint Presentation Icon Designs Download
This is a pie ppt powerpoint presentation icon designs download. This is a four stage process. The stages in this process are pie, growth, finance, business, percentage.

Combo Chart Ppt PowerPoint Presentation Model Grid
This is a combo chart ppt powerpoint presentation model grid. This is a three stage process. The stages in this process are growth, product, percentage, marketing.
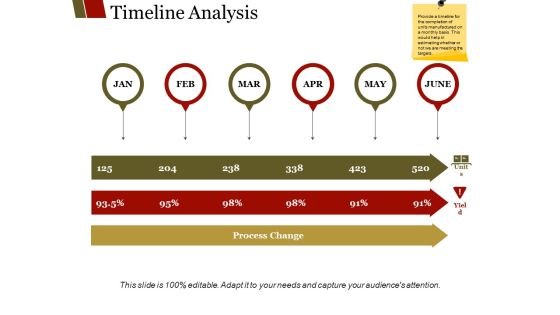
Timeline Analysis Ppt PowerPoint Presentation Outline Slides
This is a timeline analysis ppt powerpoint presentation outline slides. This is a six stage process. The stages in this process are process change, business, timelines, management, percentage.
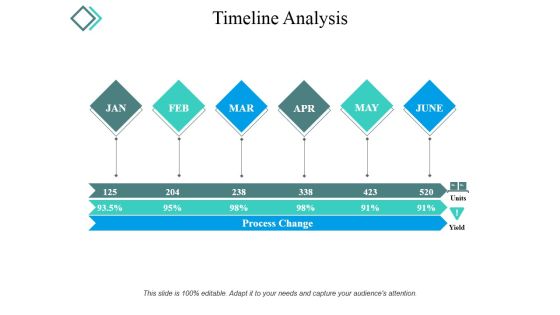
Timeline Analysis Ppt PowerPoint Presentation Outline Clipart
This is a timeline analysis ppt powerpoint presentation outline clipart. This is a six stage process. The stages in this process are process change, units, yield, months, percentage.

Timeline Analysis Ppt PowerPoint Presentation Summary Visuals
This is a timeline analysis ppt powerpoint presentation summary visuals. This is a six stage process. The stages in this process are process change, percentage, business, timelines.

 Home
Home