Percentage

Shareholding Pattern Logistic Company Investor Fund Raising Pitch Deck Information PDF
This slide represents shareholding pattern of digital freight management company. It includes key components such as shareholders, and percentages of shares holding. Welcome to our selection of the Shareholding Pattern Logistic Company Investor Fund Raising Pitch Deck Information PDF. These are designed to help you showcase your creativity and bring your sphere to life. Planning and Innovation are essential for any business that is just starting out. This collection contains the designs that you need for your everyday presentations. All of our PowerPoints are 100 percent editable, so you can customize them to suit your needs. This multi-purpose template can be used in various situations. Grab these presentation templates today
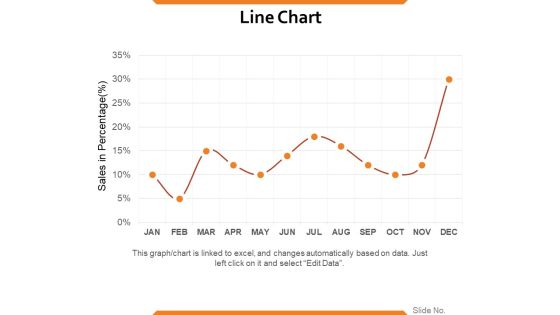
Line Chart Ppt PowerPoint Presentation Summary Samples
This is a line chart ppt powerpoint presentation summary samples. This is a one stage process. The stages in this process are sales in percentage, percentage, business, marketing, strategy.

Line Chart Ppt PowerPoint Presentation Portfolio Design Templates
This is a line chart ppt powerpoint presentation portfolio design templates. This is a two stage process. The stages in this process are in percentage, in years, percentage, business, graph.
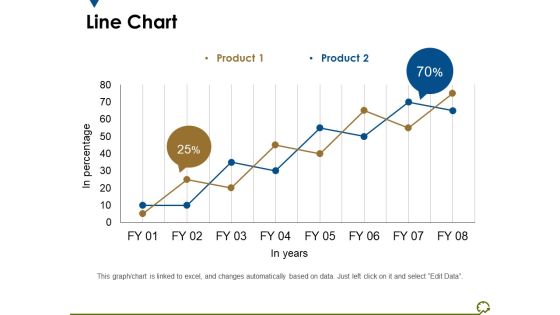
Line Chart Ppt PowerPoint Presentation Outline Diagrams
This is a line chart ppt powerpoint presentation outline diagrams. This is a two stage process. The stages in this process are in percentage, in years, percentage, business, marketing.

Area Chart Ppt PowerPoint Presentation Summary Example Introduction
This is a area chart ppt powerpoint presentation summary example introduction. This is a two stage process. The stages in this process are product, sales in percentage, percentage, area chart, business.

Line Chart Ppt PowerPoint Presentation Professional Ideas
This is a line chart ppt powerpoint presentation professional ideas. This is a two stage process. The stages in this process are in percentage, product, business, marketing, finance, percentage.
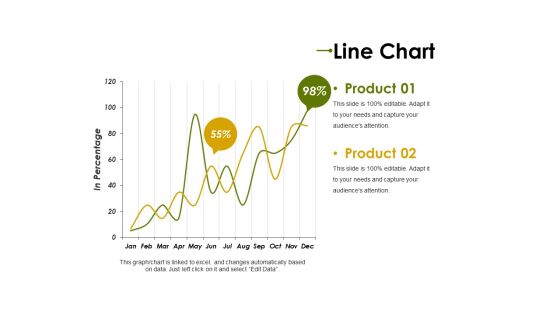
Line Chart Ppt PowerPoint Presentation Professional Clipart Images
This is a line chart ppt powerpoint presentation professional clipart images. This is a two stage process. The stages in this process are product, in percentage, graph, percentage, finance, business.
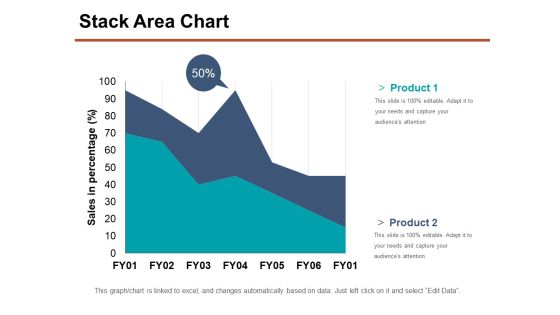
Stack Area Chart Ppt PowerPoint Presentation Show Samples
This is a stack area chart ppt powerpoint presentation show samples. This is a two stage process. The stages in this process are product, sales in percentage, business, marketing, percentage.
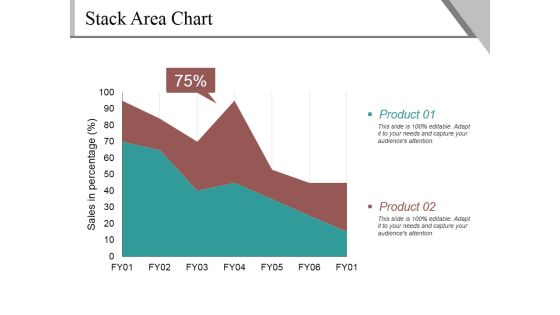
Stack Area Chart Ppt PowerPoint Presentation Gallery Guidelines
This is a stack area chart ppt powerpoint presentation gallery guidelines. This is a two stage process. The stages in this process are sales in percentage, product, percentage, business.

Stack Area Chart Ppt PowerPoint Presentation Example File
This is a stack area chart ppt powerpoint presentation example file. This is a two stage process. The stages in this process are product, sales in percentage, percentage, finance.

Area Chart Ppt PowerPoint Presentation Inspiration Demonstration
This is a area chart ppt powerpoint presentation inspiration demonstration. This is a two stage process. The stages in this process are sales in percentage, chart, percentage, business, marketing.

Area Chart Ppt PowerPoint Presentation Layouts Images
This is a area chart ppt powerpoint presentation layouts images. This is a two stage process. The stages in this process are product, sales in percentage, area chart, percentage, finance.

Area Chart Ppt PowerPoint Presentation Model Introduction
This is a area chart ppt powerpoint presentation model introduction. This is a two stage process. The stages in this process are sales in percentage, area chart, percentage, business, marketing.

Area Chart Ppt PowerPoint Presentation Styles Show
This is a area chart ppt powerpoint presentation styles show. This is a two stage process. The stages in this process are business, marketing, area chart, sales in percentage, percentage.

Area Chart Ppt PowerPoint Presentation Summary Information
This is a area chart ppt powerpoint presentation summary information. This is a two stage process. The stages in this process are business, sales in percentage, percentage, marketing, graph.

Area Chart Ppt PowerPoint Presentation Infographics Good
This is a area chart ppt powerpoint presentation infographics good. This is a two stage process. The stages in this process are sales in percentage, product, area chart, business, percentage.

Area Chart Ppt PowerPoint Presentation Model Slides
This is a area chart ppt powerpoint presentation model slides. This is a two stage process. The stages in this process are business, marketing, sales in percentage, chart, percentage, finance.

Area Chart Ppt PowerPoint Presentation Pictures Vector
This is a area chart ppt powerpoint presentation pictures vector. This is a two stage process. The stages in this process are sales in percentage, business, marketing, graph, percentage.

Area Chart Ppt PowerPoint Presentation Outline Graphic Tips
This is a area chart ppt powerpoint presentation outline graphic tips. This is a two stage process. The stages in this process are business, sales in percentage, area chart, percentage, marketing.

Bar Chart Ppt PowerPoint Presentation Model Sample
This is a bar chart ppt powerpoint presentation model sample. This is a two stage process. The stages in this process are sales in percentage, business, marketing, graph, percentage, year.
Web Designing Icon Investor Funding Elevator Pitch Deck Shareholding Pattern Graphics PDF
Following slide provides insights into company shareholding pattern before and after funding. It includes shareholding distribution between founder and shareholders, and percentages of shareholding. Whether you have daily or monthly meetings, a brilliant presentation is necessary. Web Designing Icon Investor Funding Elevator Pitch Deck Shareholding Pattern Graphics PDF can be your best option for delivering a presentation. Represent everything in detail using Web Designing Icon Investor Funding Elevator Pitch Deck Shareholding Pattern Graphics PDF and make yourself stand out in meetings. The template is versatile and follows a structure that will cater to your requirements. All the templates prepared by Slidegeeks are easy to download and edit. Our research experts have taken care of the corporate themes as well. So, give it a try and see the results.
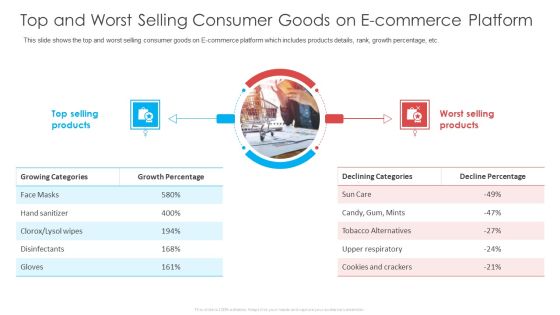
Top And Worst Selling Consumer Goods On E Commerce Platform Ppt File Outline PDF
This slide shows the top and worst selling consumer goods on E-commerce platform which includes products details, rank, growth percentage, etc. Deliver an awe-inspiring pitch with this creative top and worst selling consumer goods on e commerce platform ppt file outline pdf bundle. Topics like growth percentage, decline percentage, selling products can be discussed with this completely editable template. It is available for immediate download depending on the needs and requirements of the user.

Dashboard Showing Causes Of Employee Attrition Ppt PowerPoint Presentation Summary Design Templates PDF
Presenting this set of slides with name dashboard showing causes of employee attrition ppt powerpoint presentation summary design templates pdf. The topics discussed in these slides are work travel causing attrition by percentage, overtime causing attrition by percentage, attrition due to monthly salary by percentage, salary structure. This is a completely editable PowerPoint presentation and is available for immediate download. Download now and impress your audience.

Change Management Experience Ppt PowerPoint Presentation Styles Professional
This is a change management experience ppt powerpoint presentation styles professional. This is a four stage process. The stages in this process are business, marketing, management, percentage.

Change Management Experience Ppt PowerPoint Presentation Gallery Styles
This is a change management experience ppt powerpoint presentation gallery styles. This is a four stage process. The stages in this process are poor, fair, good, excellent, percentage.

Change Management Sponsors Ppt PowerPoint Presentation Model Show
This is a change management sponsors ppt powerpoint presentation model show. This is a two stage process. The stages in this process are stakeholder, pie, percentage, finance, business.

Change Management Sponsors Ppt PowerPoint Presentation Show Sample
This is a change management sponsors ppt powerpoint presentation show sample. This is a two stage process. The stages in this process are stakeholder, leadership, business, process, percentage.

Change Management Performance Dashboard Ppt PowerPoint Presentation Slides Rules
This is a change management performance dashboard ppt powerpoint presentation slides rules. This is a two stage process. The stages in this process are percentage, chart, marketing, management.

Financial Growth Ppt PowerPoint Presentation Layout
This is a financial growth ppt powerpoint presentation layout. This is a three stage process. The stages in this process are business, marketing, finance, percentage, growth.
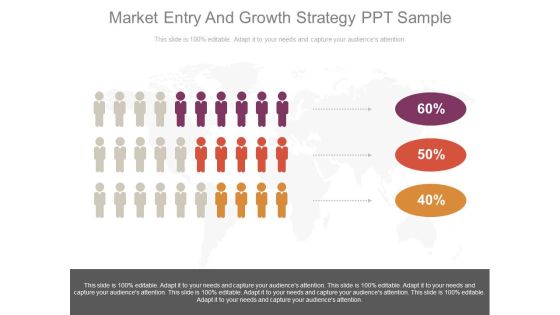
Market Entry And Growth Strategy Ppt Sample
This is a market entry and growth strategy ppt sample. This is a three stage process. The stages in this process are finance, growth, percentage, business, success.

Distribution Growth Ppt PowerPoint Presentation File Visuals
This is a distribution growth ppt powerpoint presentation file visuals. This is a ten stage process. The stages in this process are business, finance, percentage, month, marketing.

Clustered Column Line Ppt PowerPoint Presentation Samples
This is a clustered column line ppt powerpoint presentation samples. This is a four stage process. The stages in this process are finance, percentage, success, growth, bar graph.
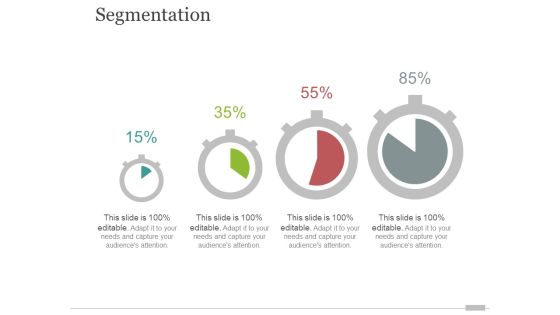
segmentation ppt powerpoint presentation ideas layout ideas
This is a segmentation ppt powerpoint presentation ideas layout ideas. This is a four stage process. The stages in this process are percentage, business, marketing, growth, strategy.

Area Chart Ppt PowerPoint Presentation Icon Graphics Tutorials
This is a area chart ppt powerpoint presentation icon graphics tutorials. This is a two stage process. The stages in this process are chart, percentage, business, growth, strategy.

Area Chart Ppt PowerPoint Presentation Inspiration Elements
This is a area chart ppt powerpoint presentation inspiration elements. This is a two stage process. The stages in this process are chart, growth, percentage, strategy, business, marketing.

Stacked Column Ppt PowerPoint Presentation Summary Visuals
This is a stacked column ppt powerpoint presentation summary visuals. This is a two stage process. The stages in this process are growth, percentage, business, marketing, graph.

Bar Graph Ppt PowerPoint Presentation Deck
This is a bar graph ppt powerpoint presentation deck. This is a five stage process. The stages in this process are percentage, process, strategy, success, marketing.

Scatter Chart Ppt PowerPoint Presentation Slides
This is a scatter chart ppt powerpoint presentation slides. This is a five stage process. The stages in this process are product, in dollars, in percentage.

Line Chart Ppt PowerPoint Presentation Example
This is a line chart ppt powerpoint presentation example. This is a two stage process. The stages in this process are product, in percentage, business, marketing.

Area Chart Ppt PowerPoint Presentation Infographics
This is a area chart ppt powerpoint presentation infographics. This is a one stage process. The stages in this process are sales in percentage, jan, feb, mar, apr.

Stacked Line Ppt PowerPoint Presentation File Show
This is a stacked line ppt powerpoint presentation file show. This is a three stage process. The stages in this process are revenue in percentage, product.

Area Chart Ppt PowerPoint Presentation Summary Example
This is a area chart ppt powerpoint presentation summary example. This is a two stage process. The stages in this process are financial year, in percentage, product.

Bar Graph Ppt PowerPoint Presentation Pictures Display
This is a bar graph ppt powerpoint presentation pictures display. This is a one stage process. The stages in this process are sales in percentage, financial year.

Line Chart Ppt PowerPoint Presentation Layouts Background Image
This is a line chart ppt powerpoint presentation layouts background image. This is a two stage process. The stages in this process are in percentage, in years, product.

Area Chart Ppt PowerPoint Presentation Inspiration Aids
This is a area chart ppt powerpoint presentation inspiration aids. This is a two stage process. The stages in this process are in percentage, product, business, marketing, strategy.
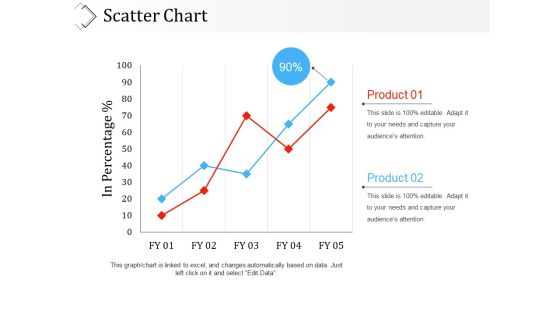
Scatter Chart Ppt PowerPoint Presentation Outline Picture
This is a scatter chart ppt powerpoint presentation outline picture. This is a two stage process. The stages in this process are in percentage, business, marketing, product, graph.

Line Chart Ppt PowerPoint Presentation Styles Introduction
This is a line chart ppt powerpoint presentation styles introduction. This is a two stage process. The stages in this process are in percentage, product, chart, business, marketing.

Column Chart Ppt PowerPoint Presentation Styles Background Image
This is a column chart ppt powerpoint presentation styles background image. This is a two stage process. The stages in this process are business, graph, percentage, marketing, strategy.

Area Chart Ppt PowerPoint Presentation Outline Graphics Download
This is a area chart ppt powerpoint presentation outline graphics download. This is a two stage process. The stages in this process are chart, percentage, business, marketing, strategy.

Combo Chart Ppt PowerPoint Presentation File Example
This is a combo chart ppt powerpoint presentation file example. This is a three stage process. The stages in this process are product, percentage, marketing, business, management.

Combo Chart Product Ppt PowerPoint Presentation Ideas Styles
This is a combo chart product ppt powerpoint presentation ideas styles. This is a three stage process. The stages in this process are business, management, marketing, percentage, product.
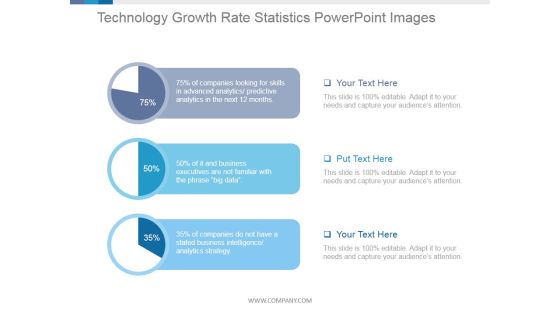
Technology Growth Rate Statistics Ppt PowerPoint Presentation Deck
This is a technology growth rate statistics ppt powerpoint presentation deck. This is a three stage process. The stages in this process are percentage, finance, marketing, business, marketing.

Scatter Chart Ppt PowerPoint Presentation File Visuals
This is a scatter chart ppt powerpoint presentation file visuals. This is a two stage process. The stages in this process are product, profit, in percentage, growth, success.

Bar Graph Ppt PowerPoint Presentation Good
This is a bar graph ppt powerpoint presentation good. This is a four stage process. The stages in this process are bar graph, growth, business, marketing, management, percentage.

Bar Graph Ppt PowerPoint Presentation Information
This is a bar graph ppt powerpoint presentation information. This is a five stage process. The stages in this process are finance, percentage, success, growth, bar graph.

Scatter Chart Ppt PowerPoint Presentation Styles Show
This is a scatter chart ppt powerpoint presentation styles show. This is a nine stage process. The stages in this process are dollars, in percentage, finance, growth strategy.

Area Chart Ppt PowerPoint Presentation Model Guidelines
This is a area chart ppt powerpoint presentation model guidelines. This is a two stage process. The stages in this process are product, area chart, sales in percentage.

Clustered Column Line Ppt PowerPoint Presentation Backgrounds
This is a clustered column line ppt powerpoint presentation backgrounds. This is a four stage process. The stages in this process are fire, earthquake, axis title, in percentage.

Staked Line Chart Ppt PowerPoint Presentation Topics
This is a staked line chart ppt powerpoint presentation topics. This is a two stage process. The stages in this process are in percentage, product.

Area Chart Ppt PowerPoint Presentation Professional
This is a area chart ppt powerpoint presentation professional. This is a one stage process. The stages in this process are product, in percentage, jan, feb, mar, apr.

 Home
Home