Percentage Progress

Stacked Line Ppt PowerPoint Presentation Ideas Design Inspiration
This is a stacked line ppt powerpoint presentation ideas design inspiration. This is a three stage process. The stages in this process are revenue in percentage, business, marketing, growth, strategy.

Line Chart Ppt PowerPoint Presentation Inspiration Graphics
This is a line chart ppt powerpoint presentation inspiration graphics. This is a two stage process. The stages in this process are line chart, growth, percentage, marketing, analysis, business.

Stacked Line Chart Template 2 Ppt PowerPoint Presentation Rules
This is a stacked line chart template 2 ppt powerpoint presentation rules. This is a two stage process. The stages in this process are stacked line chart, in percentage, product.

Line Chart Ppt PowerPoint Presentation Model Design Templates
This is a line chart ppt powerpoint presentation model design templates. This is a two stage process. The stages in this process are sales in percentage, financial years, product.
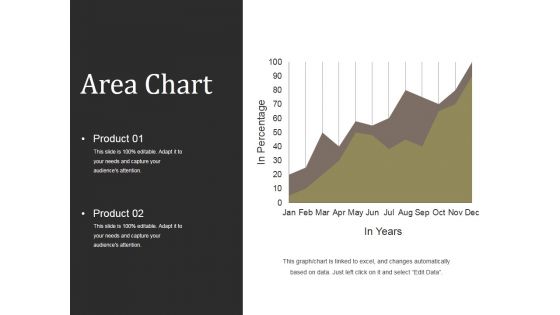
Area Chart Ppt PowerPoint Presentation Professional Designs
This is a area chart ppt powerpoint presentation professional designs. This is a two stage process. The stages in this process are in percentage, product, in years, strategy, business, marketing.
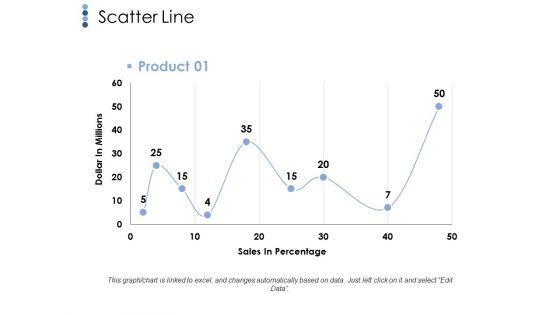
Scatter Line Ppt PowerPoint Presentation File Infographics
This is a scatter line ppt powerpoint presentation file infographics. This is a one stage process. The stages in this process are scatter line, dollar in millions, sales in percentage, business.

Stacked Line Ppt PowerPoint Presentation Outline Inspiration
This is a stacked line ppt powerpoint presentation outline inspiration. This is a three stage process. The stages in this process are revenue in percentage, product, growth, business, success.

Marketing Growth Strategy Ppt PowerPoint Presentation Ideas Deck
This is a marketing growth strategy ppt powerpoint presentation ideas deck. This is a three stage process. The stages in this process are product development, marketing and sales, customer service, business, icons, percentage.
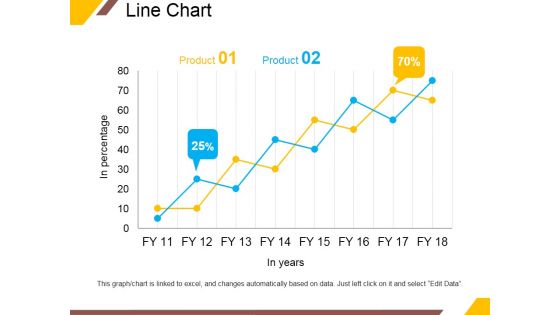
Line Chart Ppt PowerPoint Presentation Portfolio Infographic Template
This is a line chart ppt powerpoint presentation portfolio infographic template. This is a two stage process. The stages in this process are product, in years, business, percentage, growth.

Stacked Area Clustered Column Ppt PowerPoint Presentation Inspiration Shapes
This is a stacked area clustered column ppt powerpoint presentation inspiration shapes. This is a four stage process. The stages in this process are in percentage, product, growth, success, graph.

Stacked Area Clustered Column Ppt PowerPoint Presentation Summary Professional
This is a stacked area clustered column ppt powerpoint presentation summary professional. This is a three stage process. The stages in this process are product, bar graph, growth, success, in percentage.
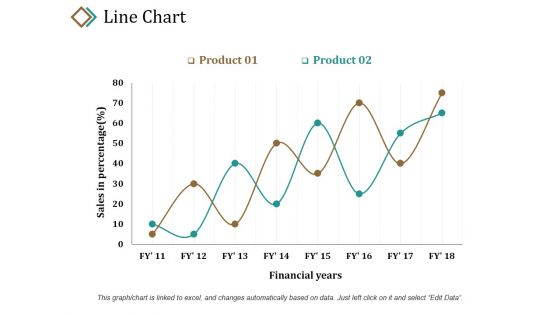
Line Chart Ppt PowerPoint Presentation Layouts Example
This is a line chart ppt powerpoint presentation layouts example. This is a two stage process. The stages in this process are sales in percentage, product, financial years, growth, success.
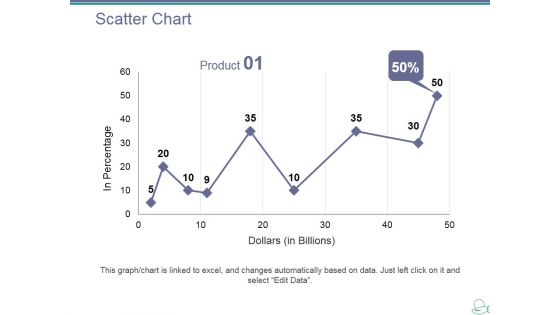
Scatter Chart Ppt PowerPoint Presentation Ideas Designs Download
This is a scatter chart ppt powerpoint presentation ideas designs download. This is a one stage process. The stages in this process are product, dollar, in percentage, growth, success.
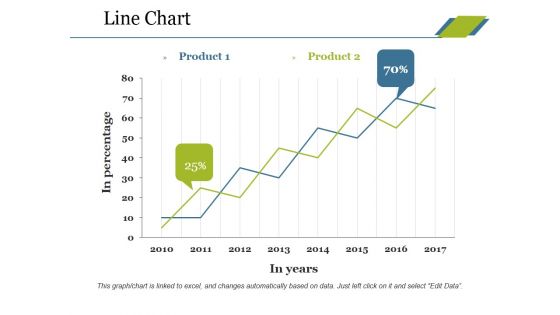
Line Chart Ppt PowerPoint Presentation Professional Tips
This is a line chart ppt powerpoint presentation professional tips. This is a two stage process. The stages in this process are product, in percentage, in years, growth, success.

Line Chart Ppt PowerPoint Presentation Slides Ideas
This is a line chart ppt powerpoint presentation slides ideas. This is a two stage process. The stages in this process are product, in percentage, in years, growth, success.
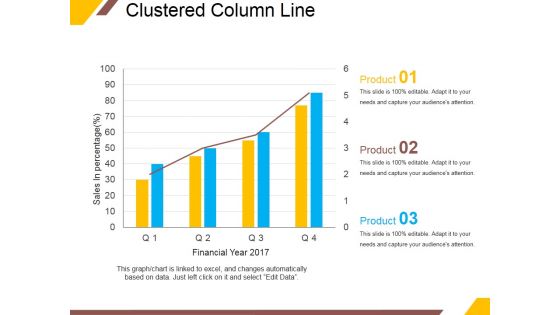
Clustered Column Line Ppt PowerPoint Presentation Portfolio Outline
This is a clustered column line ppt powerpoint presentation portfolio outline. This is a four stage process. The stages in this process are sales in percentage, financial year, product, graph, growth.
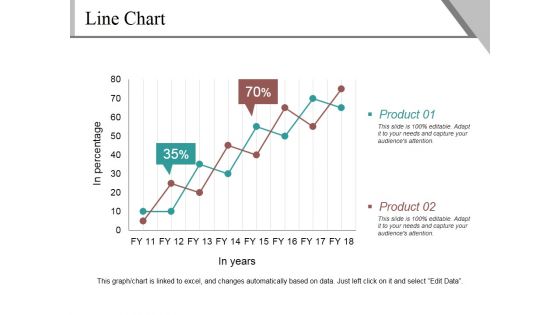
Line Chart Ppt PowerPoint Presentation Infographics Example
This is a line chart ppt powerpoint presentation infographics example. This is a two stage process. The stages in this process are product, in percentage, in years, finance, growth.
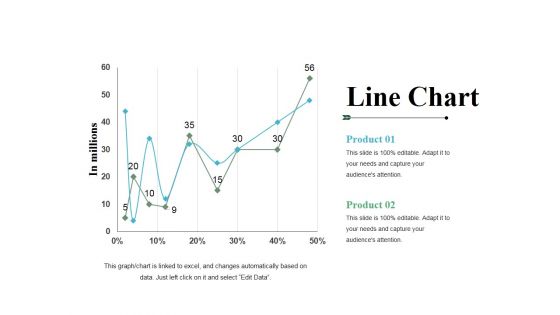
Line Chart Ppt PowerPoint Presentation File Templates
This is a line chart ppt powerpoint presentation file templates. This is a two stage process. The stages in this process are product, line chart, growth, percentage, in millions.

Column Chart Ppt PowerPoint Presentation Gallery Slide Portrait
This is a column chart ppt powerpoint presentation gallery slide portrait. This is a two stage process. The stages in this process are sales in percentage, financial year, product, bar graph, growth.
Stacked Column Ppt PowerPoint Presentation Icon Inspiration
This is a stacked column ppt powerpoint presentation icon inspiration. This is a two stage process. The stages in this process are stacked column, product, sales, growth, sales in percentage.
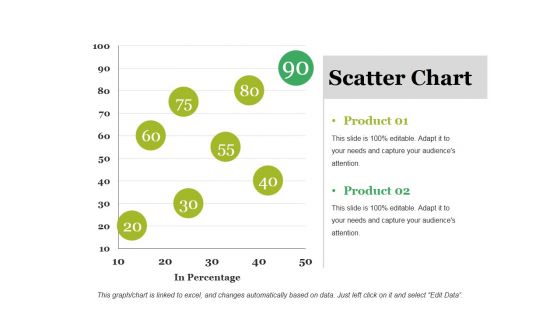
Scatter Chart Ppt PowerPoint Presentation Outline Ideas
This is a scatter chart ppt powerpoint presentation outline ideas. This is a two stage process. The stages in this process are product, scatter chart, business, in percentage, marketing.
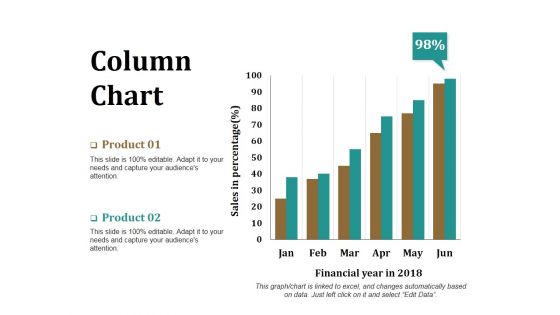
Column Chart Ppt PowerPoint Presentation Model Graphics Download
This is a column chart ppt powerpoint presentation model graphics download. This is a two stage process. The stages in this process are product, financial year, sales in percentage, bar graph, success.

Line Chart Ppt PowerPoint Presentation Infographics Infographics
This is a line chart ppt powerpoint presentation infographics infographics. This is a two stage process. The stages in this process are product, sales in percentage, financial year, line chart, finance.
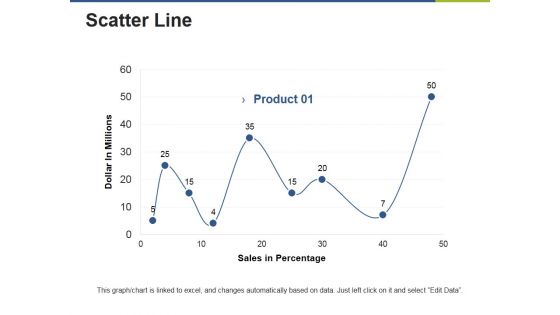
Scatter Line Ppt PowerPoint Presentation Gallery Clipart Images
This is a scatter line ppt powerpoint presentation gallery clipart images. This is a one stage process. The stages in this process are product, dollar in millions, sales in percentage.
Scatter Line Chart Ppt PowerPoint Presentation Icon Files
This is a scatter line chart ppt powerpoint presentation icon files. This is a one stage process. The stages in this process are dollar in millions, product, sales in percentage.

Line Chart Ppt PowerPoint Presentation Gallery Templates
This is a line chart ppt powerpoint presentation gallery templates. This is a two stage process. The stages in this process are product, financial years, sales in percentage, line chart.

Scatter Line Ppt PowerPoint Presentation Professional Design Inspiration
This is a scatter line ppt powerpoint presentation professional design inspiration. This is a one stage process. The stages in this process are product, sales in percentage, dollar in millions.

Line With Markers Ppt PowerPoint Presentation Styles Slide Portrait
This is a line with markers ppt powerpoint presentation styles slide portrait. This is a two stage process. The stages in this process are sales in percentage, financial years, product.
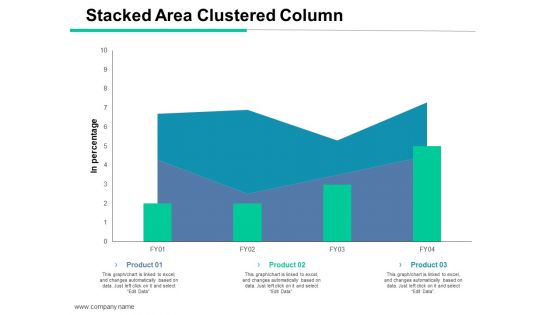
Stacked Area Clustered Column Ppt PowerPoint Presentation File Templates
This is a stacked area clustered column ppt powerpoint presentation file templates. This is a three stage process. The stages in this process are stacked area clustered column, product, financial, sales in percentage, management.
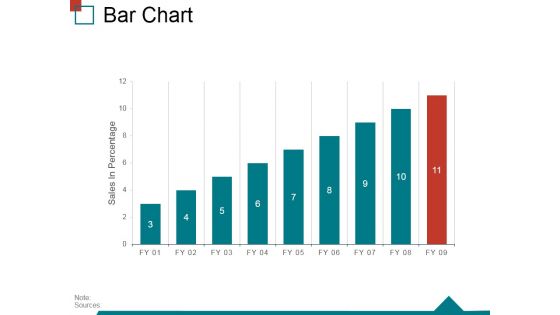
Bar Chart Ppt PowerPoint Presentation Infographic Template Skills
This is a bar chart ppt powerpoint presentation infographic template skills. This is a nine stage process. The stages in this process are sales in percentage, finance, business, marketing, strategy, success.
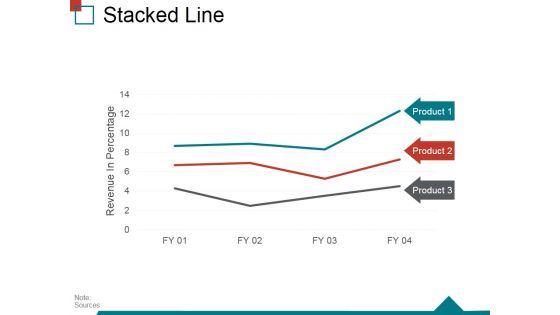
Stacked Line Ppt PowerPoint Presentation Ideas Summary
This is a stacked line ppt powerpoint presentation ideas summary. This is a three stage process. The stages in this process are revenue in percentage, stacked line, business, marketing, success.
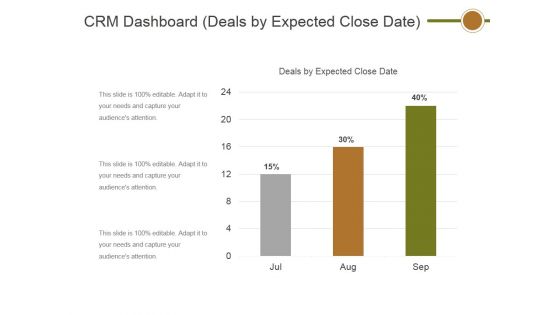
Crm Dashboard Deals By Expected Close Date Ppt PowerPoint Presentation Show Information
This is a crm dashboard deals by expected close date ppt powerpoint presentation show information. This is a three stage process. The stages in this process are deals by expected close date, percentage, business, finance, success.

Stacked Line Ppt PowerPoint Presentation File Display
This is a stacked line ppt powerpoint presentation file display. This is a three stage process. The stages in this process are business, strategy, marketing, analysis, revenue in percentage, stacked line.
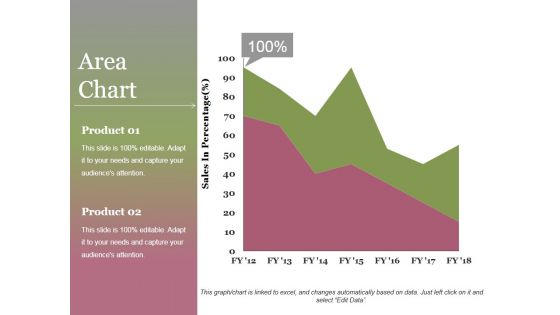
Area Chart Ppt PowerPoint Presentation Infographics File Formats
This is a area chart ppt powerpoint presentation infographics file formats. This is a two stage process. The stages in this process are area chart, product, sales in percentage, growth, success.

Line Chart Ppt PowerPoint Presentation Show Guide
This is a line chart ppt powerpoint presentation show guide. This is a two stage process. The stages in this process are product, sales in percentage, financial years, growth, success.

Line Chart Ppt PowerPoint Presentation Slides Mockup
This is a line chart ppt powerpoint presentation slides mockup. This is a two stage process. The stages in this process are in percentage, in years, product, growth, success.
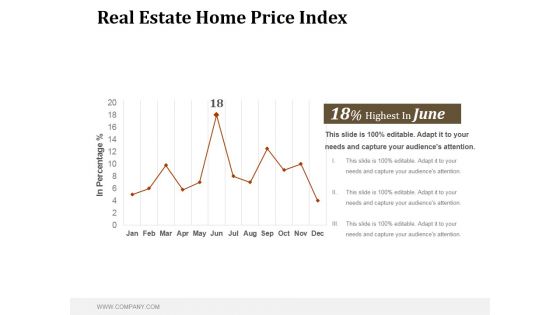
Real Estate Home Price Index Ppt PowerPoint Presentation Samples
This is a real estate home price index ppt powerpoint presentation samples. This is a one stage process. The stages in this process are in percentage, business, bar graph, marketing, success, management.
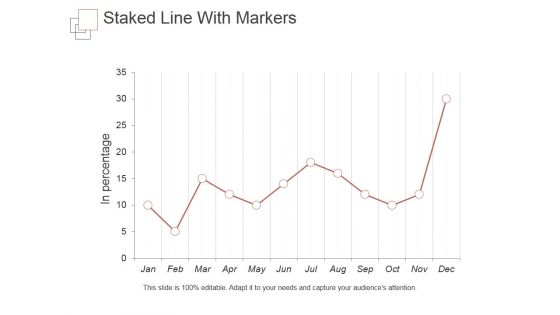
Staked Line With Markers Ppt PowerPoint Presentation Introduction
This is a staked line with markers ppt powerpoint presentation introduction. This is a one stage process. The stages in this process are in percentage, business, marketing, success, management.

Stacked Column Template 2 Ppt PowerPoint Presentation Visuals
This is a stacked column template 2 ppt powerpoint presentation visuals. This is a twelve stage process. The stages in this process are business, marketing, analysis, sales in percentage, finance, growth strategy.
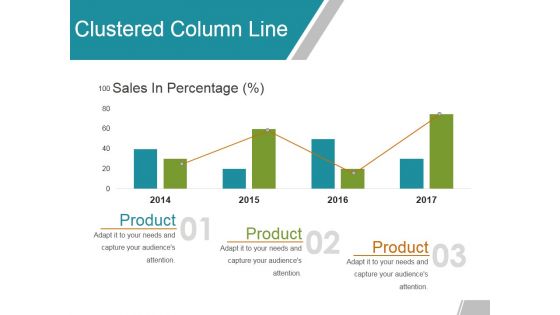
Clustered Column Line Ppt Powerpoint Presentation Gallery Mockup
This is a clustered column line ppt powerpoint presentation gallery mockup. This is a four stage process. The stages in this process are product, sales in percentage, product, growth.

Line Chart Ppt PowerPoint Presentation Gallery Objects
This is a line chart ppt powerpoint presentation gallery objects. This is a two stage process. The stages in this process are product, business, marketing, growth, in years, in percentage.
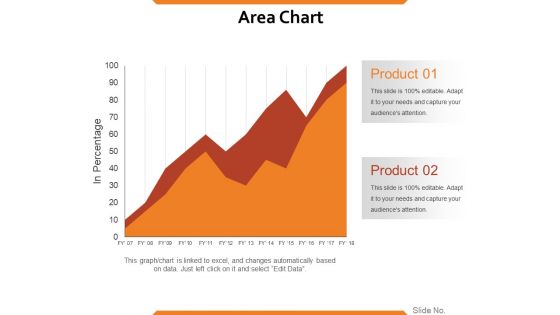
Area Chart Ppt PowerPoint Presentation Inspiration Slide Download
This is a area chart ppt powerpoint presentation inspiration slide download. This is a two stage process. The stages in this process are product, in percentage, business, growth, strategy, finance.

Scatter Chart Template 2 Ppt PowerPoint Presentation Styles Visual Aids
This is a scatter chart template 2 ppt powerpoint presentation styles visual aids. This is a two stage process. The stages in this process are product, business, marketing, in percentage, growth.

Line Chart Ppt PowerPoint Presentation Summary File Formats
This is a line chart ppt powerpoint presentation summary file formats. This is a two stage process. The stages in this process are in percentage, graph, business, marketing, growth.
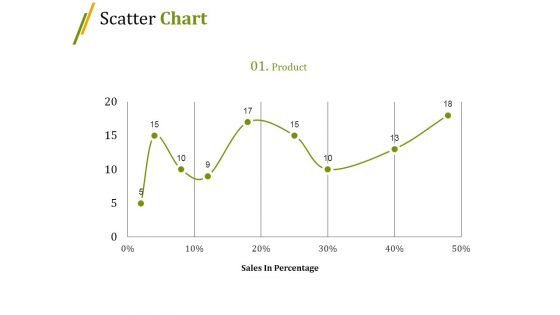
Scatter Chart Ppt PowerPoint Presentation Slides Summary
This is a scatter chart ppt powerpoint presentation slides summary. This is a nine stage process. The stages in this process are sales in percentage, growth, graph, business, marketing.

Scatter Chart Ppt PowerPoint Presentation Gallery Show
This is a scatter chart ppt powerpoint presentation gallery show. This is a one stage process. The stages in this process are in percentage, dollars, business, marketing, growth, graph.

Column Chart Ppt PowerPoint Presentation Slides Smartart
This is a column chart ppt powerpoint presentation slides smartart. This is a two stage process. The stages in this process are sales in percentage, financial year in, business, growth, strategy.
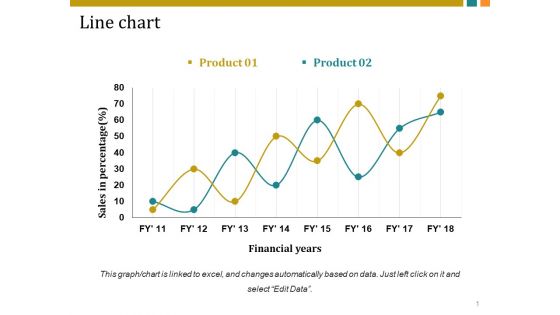
Line Chart Ppt PowerPoint Presentation Inspiration Vector
This is a line chart ppt powerpoint presentation inspiration vector. This is a two stage process. The stages in this process are sales in percentage, financial years, business, marketing, growth.

Area Chart Ppt PowerPoint Presentation Infographic Template Guidelines
This is a area chart ppt powerpoint presentation infographic template guidelines. This is a two stage process. The stages in this process are in percentage, chart, business, growth, strategy.

Line Chart Ppt PowerPoint Presentation Infographics Graphic Images
This is a line chart ppt powerpoint presentation infographics graphic images. This is a two stage process. The stages in this process are sales in percentage, financial years, growth, business, marketing.
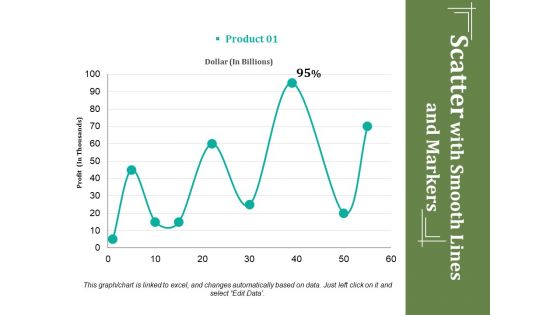
Scatter With Smooth Lines And Markers Ppt PowerPoint Presentation Ideas Deck
This is a scatter with smooth lines and markers ppt powerpoint presentation ideas deck. This is a one stage process. The stages in this process are profit, dollar, percentage, business, growth.
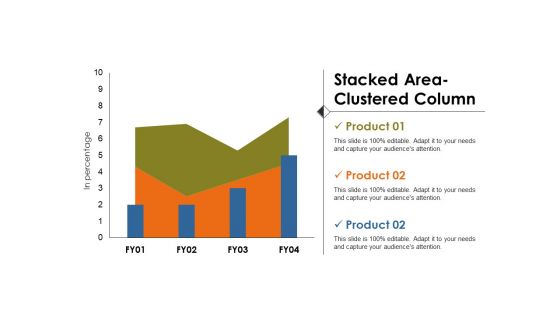
Stacked Area Clustered Column Ppt PowerPoint Presentation Summary Gallery
This is a stacked area clustered column ppt powerpoint presentation summary gallery. This is a three stage process. The stages in this process are in percentage, business, marketing, growth, strategy.
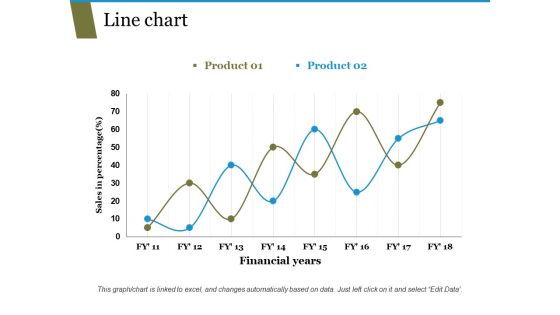
Line Chart Ppt PowerPoint Presentation Pictures Templates
This is a line chart ppt powerpoint presentation pictures templates. This is a two stage process. The stages in this process are sales in percentage, financial years, business, marketing, growth.
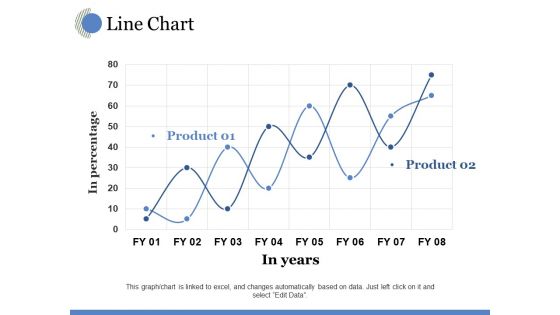
Line Chart Ppt PowerPoint Presentation Model Visual Aids
This is a line chart ppt powerpoint presentation model visual aids. This is a two stage process. The stages in this process are in years, in percentage, growth, business, marketing.

Scatter Line Ppt PowerPoint Presentation Visual Aids Diagrams
This is a scatter line ppt powerpoint presentation visual aids diagrams. This is a one stage process. The stages in this process are dollar in millions, sales in percentage, growth, business, marketing.

Clustered Column Line Ppt PowerPoint Presentation File Picture
This is a clustered column line ppt powerpoint presentation file picture. This is a three stage process. The stages in this process are business, in percentage, marketing, growth, strategy, graph.

Area Chart Ppt PowerPoint Presentation Topics
This is a area chart ppt powerpoint presentation topics. This is a two stage process. The stages in this process are product, in percentage, jan, feb, mar, apr, may.
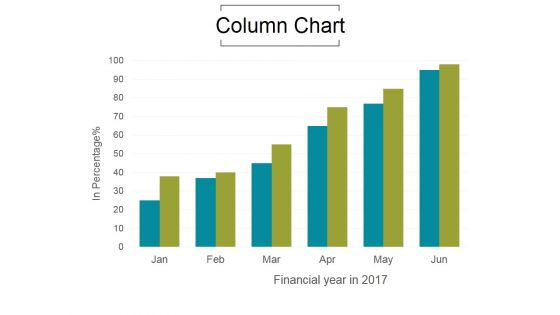
Column Chart Ppt PowerPoint Presentation Show
This is a column chart ppt powerpoint presentation show. This is a six stage process. The stages in this process are product, in percentage, jan, feb, mar, apr, may.

Stacked Area Clustered Column Ppt PowerPoint Presentation Layout
This is a stacked area clustered column ppt powerpoint presentation layout. This is a two stage process. The stages in this process are in percentage, product, business, marketing, management.
Scatter Line Ppt PowerPoint Presentation Icon Picture
This is a scatter line ppt powerpoint presentation icon picture. This is a nine stage process. The stages in this process are dollar in billions, sales in percentage, finance, management.

Clustered Column Line Ppt PowerPoint Presentation Infographic Template Deck
This is a clustered column line ppt powerpoint presentation infographic template deck. This is a three stage process. The stages in this process are business, strategy, analysis, planning, sales in percentage, financial year.
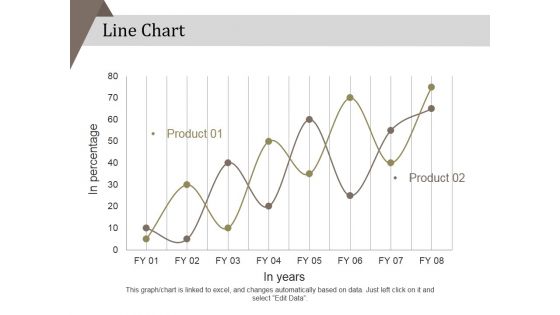
Line Chart Ppt PowerPoint Presentation Layouts Professional
This is a line chart ppt powerpoint presentation layouts professional. This is a two stage process. The stages in this process are in percentage, product, in years, strategy, marketing, business.
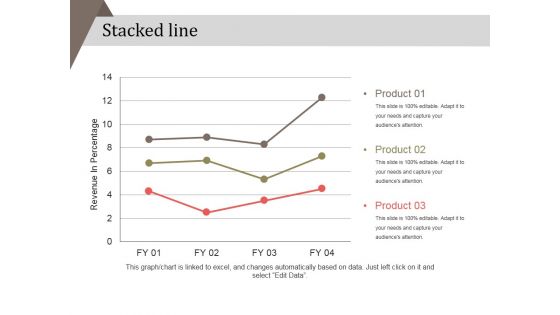
Stacked Line Ppt PowerPoint Presentation Summary File Formats
This is a stacked line ppt powerpoint presentation summary file formats. This is a three stage process. The stages in this process are product, revenue in percentage, strategy, business, marketing.

Combo Chart Ppt PowerPoint Presentation Infographics Introduction
This is a combo chart ppt powerpoint presentation infographics introduction. This is a three stage process. The stages in this process are profit in percentage, business, graph, strategy, product.
Scatter Chart Ppt PowerPoint Presentation Professional Icons
This is a scatter chart ppt powerpoint presentation professional icons. This is a six stage process. The stages in this process are in dollars, in percentage, graph, business, marketing.
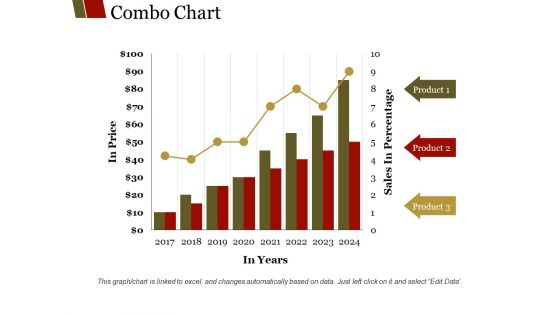
Combo Chart Ppt PowerPoint Presentation Summary Layouts
This is a combo chart ppt powerpoint presentation summary layouts. This is a eight stage process. The stages in this process are product, sales in percentage, in years, in price, graph.
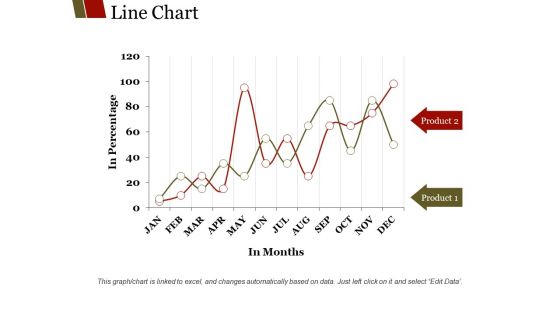
Line Chart Ppt PowerPoint Presentation Show Background Designs
This is a line chart ppt powerpoint presentation show background designs. This is a two stage process. The stages in this process are product, in months, in percentage, business.

Clustered Column Line Ppt PowerPoint Presentation Inspiration Layouts
This is a clustered column line ppt powerpoint presentation inspiration layouts. This is a four stage process. The stages in this process are in percentage, product, business, strategy, graph.

Scatter Chart Ppt PowerPoint Presentation Styles Layout Ideas
This is a scatter chart ppt powerpoint presentation styles layout ideas. This is a one stage process. The stages in this process are dollars in billions, in percentage, business, finance.

Line Chart Ppt PowerPoint Presentation Summary Graphic Tips
This is a line chart ppt powerpoint presentation summary graphic tips. This is a two stage process. The stages in this process are line chart, product, in percentage, analysis, business.

Line Chart Template 2 Ppt PowerPoint Presentation Model Background Image
This is a line chart template 2 ppt powerpoint presentation model background image. This is a two stage process. The stages in this process are sales in percentage, financial years, business, marketing, strategy, graph.

Column Chart Ppt PowerPoint Presentation Outline Styles
This is a column chart ppt powerpoint presentation outline styles. This is a two stage process. The stages in this process are sales in percentage, financial year in, business, marketing, graph.

Line Chart Ppt PowerPoint Presentation Infographic Template Slides
This is a line chart ppt powerpoint presentation infographic template slides. This is a two stage process. The stages in this process are sales in percentage, financial years, business, marketing, graph.

Stacked Area Clustered Column Ppt PowerPoint Presentation Pictures Brochure
This is a stacked area clustered column ppt powerpoint presentation pictures brochure. This is a three stage process. The stages in this process are in percentage, business, marketing, graph, strategy.
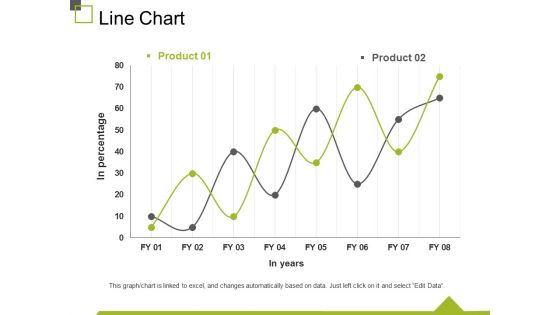
Line Chart Ppt PowerPoint Presentation Infographics Display
This is a line chart ppt powerpoint presentation infographics display. This is a two stage process. The stages in this process are in percentage, in years, chart, business, marketing.

Line Chart Ppt PowerPoint Presentation Styles Themes
This is a line chart ppt powerpoint presentation styles themes. This is a two stage process. The stages in this process are business, marketing, financial years, sales in percentage.
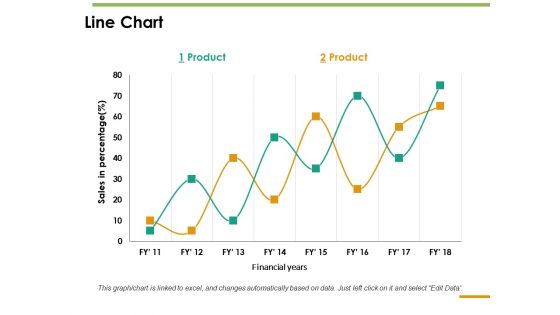
Line Chart Ppt PowerPoint Presentation Inspiration Guide
This is a line chart ppt powerpoint presentation inspiration guide. This is a two stage process. The stages in this process are line chart, sales in percentage, product, financial years.
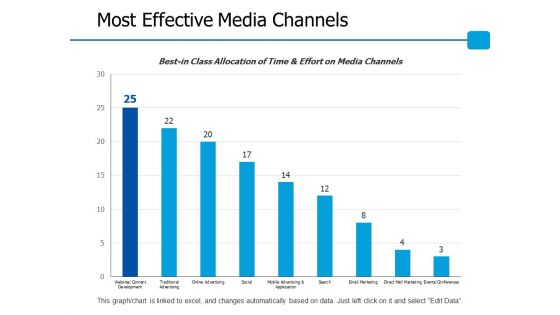
Most Effective Media Channels Ppt PowerPoint Presentation Model Graphic Images
This is a most effective media channels ppt powerpoint presentation model graphic images. This is a nine stage process. The stages in this process are business, management, marketing, percentage, product.

Stock Chart Management Investment Ppt PowerPoint Presentation Infographics Professional
This is a stock chart management investment ppt powerpoint presentation infographics professional. This is a two stage process. The stages in this process are marketing, business, management, percentage, product.

Column Chart Finance Marketing Ppt PowerPoint Presentation Model Example Introduction
This is a column chart finance marketing ppt powerpoint presentation model example introduction. This is a two stage process. The stages in this process are business, management, marketing, percentage, product.
Area Chart Ppt PowerPoint Presentation Inspiration Icons Ppt PowerPoint Presentation Professional File Formats
This is a area chart ppt powerpoint presentation inspiration icons ppt powerpoint presentation professional file formats. This is a two stage process. The stages in this process are area chart, product, percentage, business, growth.
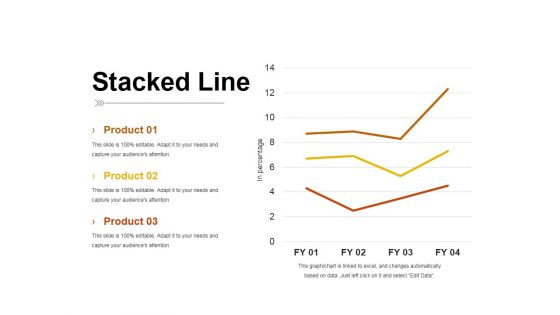
Stacked Line Ppt PowerPoint Presentation Inspiration Pictures
This is a stacked line ppt powerpoint presentation inspiration pictures. This is a three stage process. The stages in this process are product, stacked line, in percentage, business, growth.

Clustered Column Line Ppt PowerPoint Presentation Show Influencers
This is a clustered column line ppt powerpoint presentation show influencers. This is a four stage process. The stages in this process are financial year, sales in percentage, product, growth, success.

Line Chart Ppt PowerPoint Presentation Outline Infographic Template
This is a line chart ppt powerpoint presentation outline infographic template. This is a two stage process. The stages in this process are in percentage, product, in year, growth, success.

Stacked Area Clustered Column Ppt PowerPoint Presentation Show Guidelines
This is a stacked area clustered column ppt powerpoint presentation show guidelines. This is a four stage process. The stages in this process are in percentage, product, bar graph, growth, success.
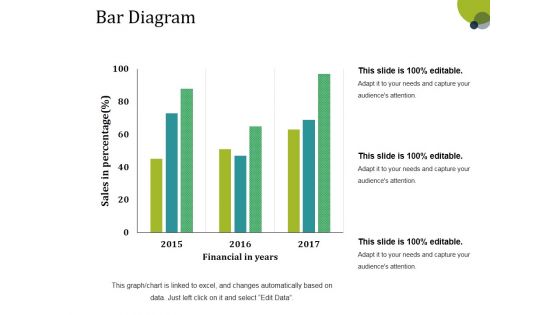
Bar Diagram Ppt PowerPoint Presentation Gallery Structure
This is a bar diagram ppt powerpoint presentation gallery structure. This is a three stage process. The stages in this process are financial in years, sales in percentage, bar graph, growth, success.

Column Chart Ppt PowerPoint Presentation Layouts Tips
This is a column chart ppt powerpoint presentation layouts tips. This is a six stage process. The stages in this process are sales in percentage, financial year, bar graph, growth, success.

Bar Diagram Ppt PowerPoint Presentation Pictures Background Image
This is a bar diagram ppt powerpoint presentation pictures background image. This is a three stage process. The stages in this process are financial in years, sales in percentage, bar graph, growth, success.

Clustered Column Line Ppt PowerPoint Presentation Pictures Example
This is a clustered column line ppt powerpoint presentation pictures example. This is a three stage process. The stages in this process are product, in percentage, bar graph, growth, success.

Area Chart Ppt PowerPoint Presentation Infographic Template Model
This is a area chart ppt powerpoint presentation infographic template model. This is a two stage process. The stages in this process are product, area chart, growth, percentage, success.

Area Chart Ppt PowerPoint Presentation Show Layout Ideas
This is a area chart ppt powerpoint presentation show layout ideas. This is a two stage process. The stages in this process are product, in percentage, financial year, growth.
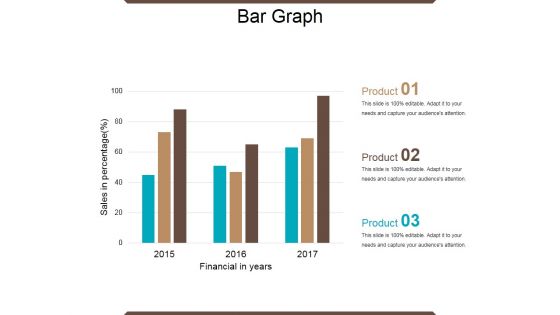
Bar Graph Ppt PowerPoint Presentation Ideas Graphic Tips
This is a bar graph ppt powerpoint presentation ideas graphic tips. This is a three stage process. The stages in this process are financial year, sales in percentage, product, bar graph, growth.

Line Chart Ppt PowerPoint Presentation Layouts Show
This is a line chart ppt powerpoint presentation layouts show. This is a two stage process. The stages in this process are product, in years, in percentage, line chart, growth.

Column Chart Ppt PowerPoint Presentation Ideas Vector
This is a column chart ppt powerpoint presentation ideas vector. This is a two stage process. The stages in this process are column chart, product, financial years, sales in percentage, growth.
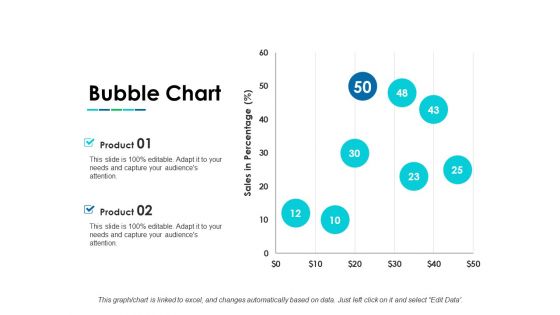
Bubble Chart Ppt PowerPoint Presentation Infographic Template Layouts
This is a bubble chart ppt powerpoint presentation infographic template layouts. This is a two stage process. The stages in this process are bubble chart, product, sales in percentage, growth.

Column Chart Ppt PowerPoint Presentation Slides Show
This is a column chart ppt powerpoint presentation slides show. This is a two stage process. The stages in this process are column chart, product, sales in percentage, financial year, growth.

Stacked Area Clustered Column Ppt PowerPoint Presentation Ideas Themes
This is a stacked area clustered column ppt powerpoint presentation ideas themes. This is a three stage process. The stages in this process are product, in percentage, bar graph, area chart, growth.
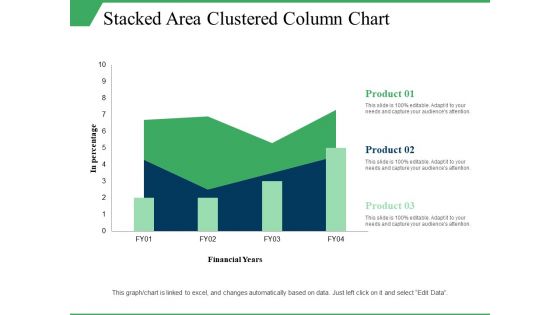
Stacked Area Clustered Column Chart Ppt PowerPoint Presentation Visual Aids Model
This is a stacked area clustered column chart ppt powerpoint presentation visual aids model. This is a three stage process. The stages in this process are in percentage, product, financial years, growth, column chart.
Stacked Column Ppt PowerPoint Presentation Icon Deck Ppt PowerPoint Presentation Pictures Infographic Template
This is a stacked column ppt powerpoint presentation icon deck ppt powerpoint presentation pictures infographic template. This is a two stage process. The stages in this process are stacked column, sales, percentage, product, growth.

Stacked Column Chart Ppt PowerPoint Presentation Summary Gallery
This is a stacked column chart ppt powerpoint presentation summary gallery. This is a two stage process. The stages in this process are stacked column chart, product, in years, growth, percentage.
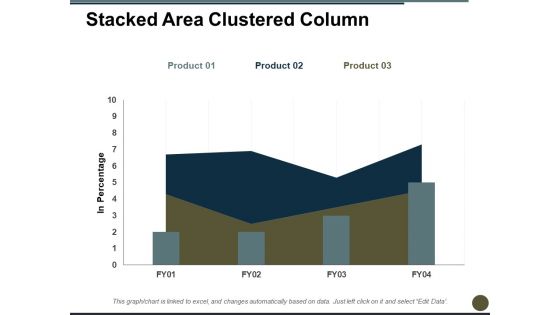
Stacked Area Clustered Column Ppt PowerPoint Presentation Professional Graphics
This is a stacked area clustered column ppt powerpoint presentation professional graphics. This is a three stage process. The stages in this process are in percentage, bar chart, product, growth, year.
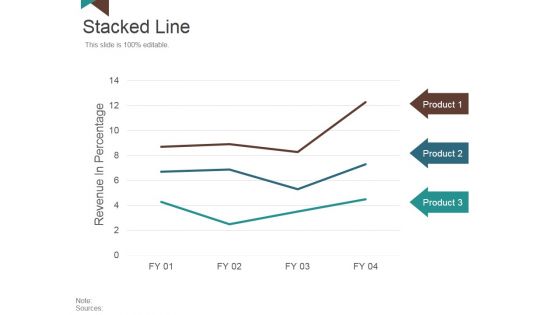
Stacked Line Ppt PowerPoint Presentation Professional Graphics
This is a stacked line ppt powerpoint presentation professional graphics. This is a three stage process. The stages in this process are revenue in percentage, product, business, marketing, success.
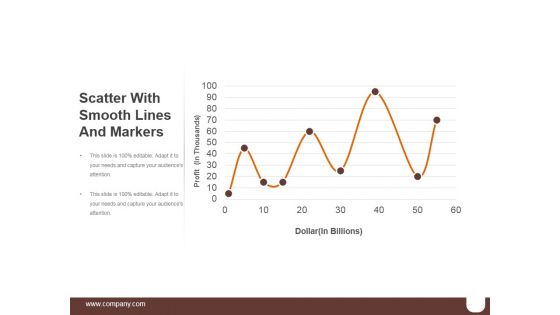
Scatter With Smooth Lines And Markers Ppt PowerPoint Presentation Ideas
This is a scatter with smooth lines and markers ppt powerpoint presentation ideas. This is a seven stage process. The stages in this process are business, marketing, percentage, success, finance.
Scatter Chart Ppt PowerPoint Presentation Icon Elements
This is a scatter chart ppt powerpoint presentation icon elements. This is a nine stage process. The stages in this process are dollar in billions, sales in percentage, business, success.
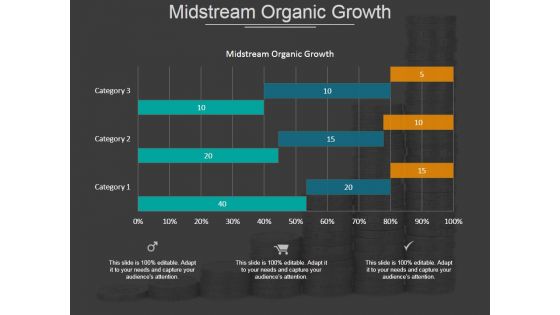
Midstream Organic Growth Ppt PowerPoint Presentation Slides Good
This is a midstream organic growth ppt powerpoint presentation slides good. This is a three stage process. The stages in this process are midstream organic growth, category, finance, percentage, business.
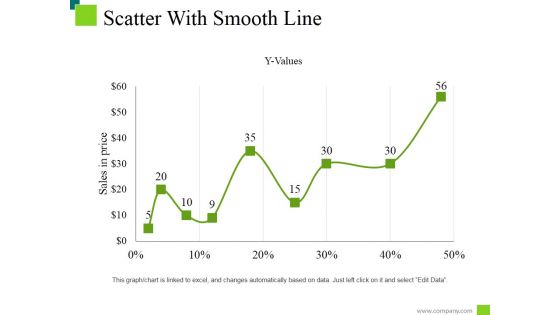
Scatter With Smooth Line Ppt PowerPoint Presentation Professional Display
This is a scatter with smooth line ppt powerpoint presentation professional display. This is a nine stage process. The stages in this process are sale price, business, marketing, percentage, finance.
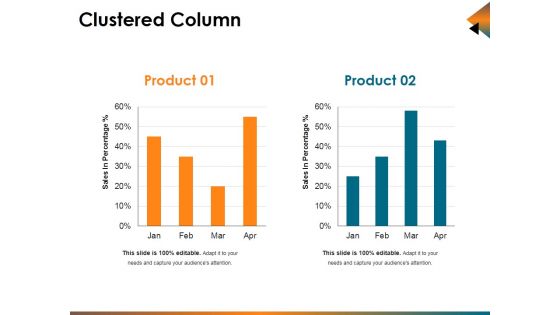
Clustered Column Ppt PowerPoint Presentation Infographic Template Background Designs
This is a clustered column ppt powerpoint presentation infographic template background designs. This is a two stage process. The stages in this process are sales in percentage, bar, business, marketing, planning.
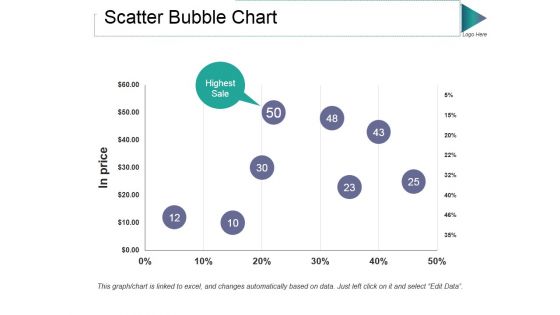
Scatter Bubble Chart Ppt PowerPoint Presentation Gallery Guidelines
This is a scatter bubble chart ppt powerpoint presentation gallery guidelines. This is a one stage process. The stages in this process are in price, highest sale, percentage, finance, business.
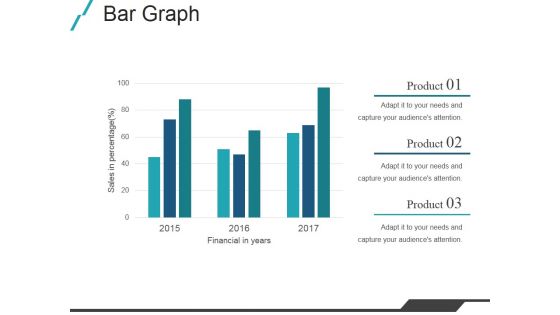
Bar Graph Ppt PowerPoint Presentation Slides Deck
This is a bar graph ppt powerpoint presentation slides deck. This is a three stage process. The stages in this process are financial in years, product, sales in percentage.
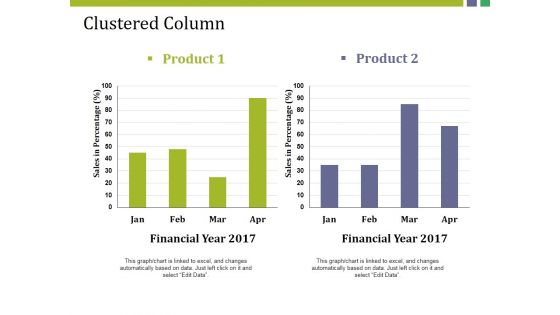
Clustered Column Ppt PowerPoint Presentation Gallery Structure
This is a clustered column ppt powerpoint presentation gallery structure. This is a two stage process. The stages in this process are product, sales in percentage, financial year, bar graph, finance.

Scatter Line Ppt PowerPoint Presentation Styles Graphics Pictures
This is a scatter line ppt powerpoint presentation styles graphics pictures. This is a one stage process. The stages in this process are product, dollar in millions, sales in percentage.

Stacked Area Clustered Column Ppt PowerPoint Presentation Layouts Templates
This is a stacked area clustered column ppt powerpoint presentation layouts templates. This is a three stage process. The stages in this process are product, in percentage, area chart.
Area Chart Ppt PowerPoint Presentation Icon Summary
This is a area chart ppt powerpoint presentation icon summary. This is a two stage process. The stages in this process are financial year, area chart, in percentage, product.
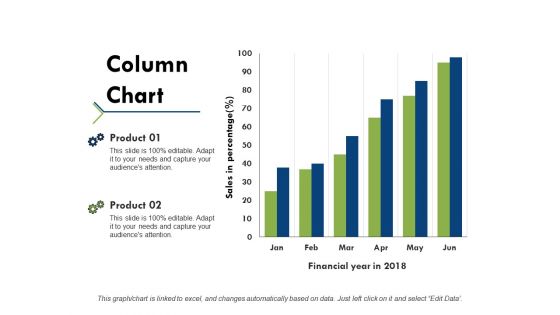
Column Chart Ppt PowerPoint Presentation Portfolio Example Topics
This is a column chart ppt powerpoint presentation portfolio example topics. This is a two stage process. The stages in this process are product, financial year, sales in percentage, column chart.

Stacked Area Clustered Column Ppt PowerPoint Presentation Professional Influencers
This is a stacked area clustered column ppt powerpoint presentation professional influencers. This is a three stage process. The stages in this process are stacked area clustered column, percentage, product, year.
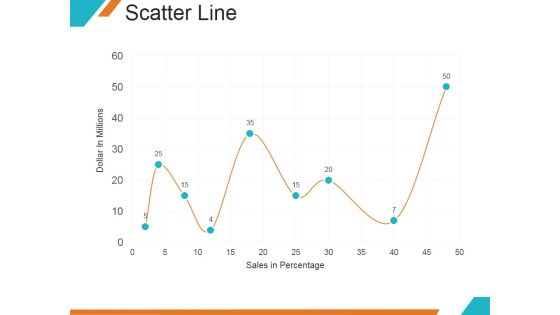
Scatter Line Ppt PowerPoint Presentation Backgrounds
This is a scatter line ppt powerpoint presentation backgrounds. This is a nine stage process. The stages in this process are dollar in millions, sales in percentage, graph, growth.

Line Chart Ppt PowerPoint Presentation Gallery Rules
This is a line chart ppt powerpoint presentation gallery rules. This is a two stage process. The stages in this process are financial years, product, sales in percentage, line chart, growth.
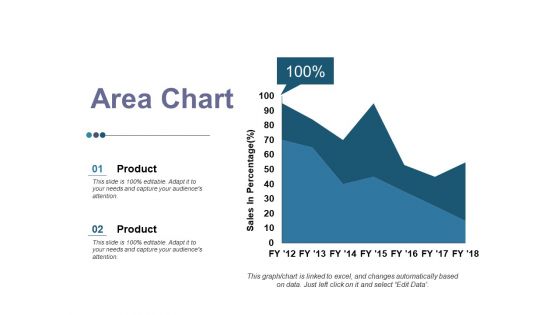
Area Chart Ppt PowerPoint Presentation Inspiration Graphics
This is a area chart ppt powerpoint presentation inspiration graphics. This is a two stage process. The stages in this process are product, area chart, business, growth, sales in percentage.
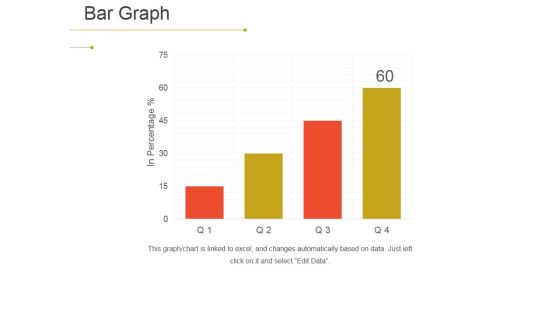
Bar Graph Ppt PowerPoint Presentation File Vector
This is a bar graph ppt powerpoint presentation file vector. This is a four stage process. The stages in this process are in percentage, bar graph, growth, business, process.
Bar Chart Ppt PowerPoint Presentation Icon Design Templates
This is a bar chart ppt powerpoint presentation icon design templates. This is a nine stage process. The stages in this process are sales in percentage, bar graph, business, marketing, growth.
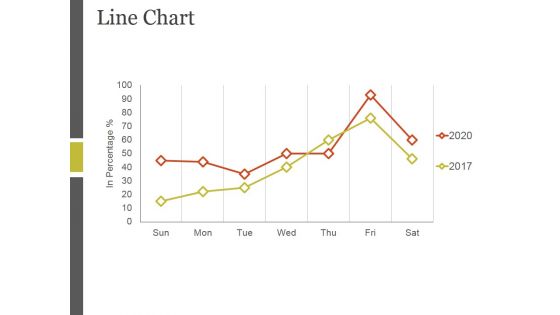
Line Chart Ppt PowerPoint Presentation Ideas Example
This is a line chart ppt powerpoint presentation ideas example. This is a two stage process. The stages in this process are sales in percentage, bar graph, business, marketing, growth.

Area Chart Ppt PowerPoint Presentation Summary Templates
This is a area chart ppt powerpoint presentation summary templates. This is a two stage process. The stages in this process are product, in percentage, bar graph, growth, business.
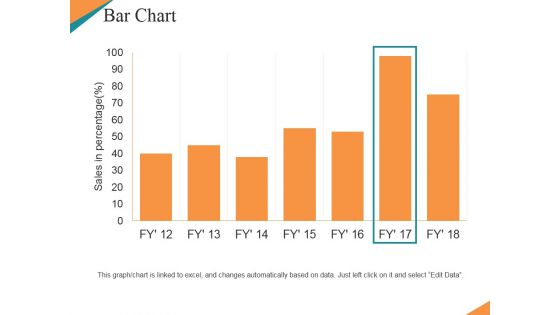
Bar Chart Ppt PowerPoint Presentation Ideas Graphic Tips
This is a bar chart ppt powerpoint presentation ideas graphic tips. This is a seven stage process. The stages in this process are sales in percentage, bar chart, growth, business, marketing.

Scatter Chart Template 1 Ppt PowerPoint Presentation Outline Gridlines
This is a scatter chart template 1 ppt powerpoint presentation outline gridlines. This is a one stage process. The stages in this process are scatter chart, sales in percentage, business, marketing, growth.
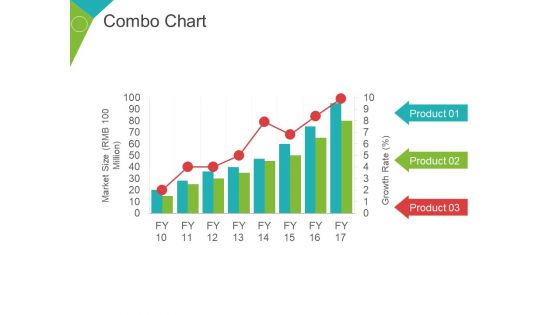
Combo Chart Ppt PowerPoint Presentation Infographic Template Graphic Images
This is a combo chart ppt powerpoint presentation infographic template graphic images. This is a three stage process. The stages in this process are market size, growth rate, percentage, business, marketing.

Scatter Chart Template 3 Ppt PowerPoint Presentation Styles Demonstration
This is a scatter chart template 3 ppt powerpoint presentation styles demonstration. This is a one stage process. The stages in this process are sales in percentage, finance, business, marketing, growth.
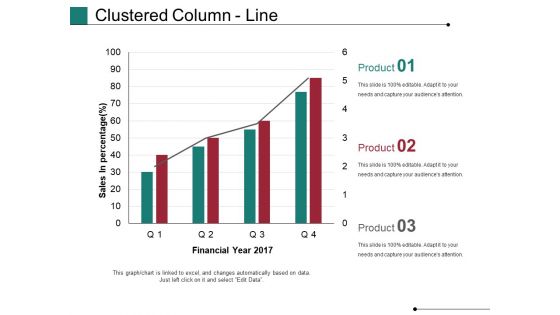
Clustered Column Line Ppt PowerPoint Presentation Model Rules
This is a clustered column line ppt powerpoint presentation model rules. This is a four stage process. The stages in this process are financial year, sales in percentage, business, marketing, growth, graph.

Stacked Line Ppt PowerPoint Presentation Show Templates
This is a stacked line ppt powerpoint presentation show templates. This is a three stage process. The stages in this process are stacked line, in percentage, finance, marketing, business.
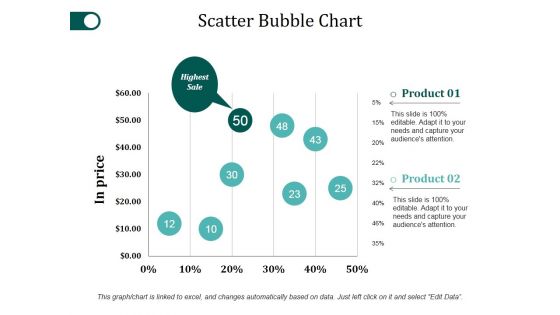
Scatter Bubble Chart Ppt PowerPoint Presentation Styles Objects
This is a scatter bubble chart ppt powerpoint presentation styles objects. This is a two stage process. The stages in this process are product, in price, highest sale, percentage, finance.

Bar Chart Ppt PowerPoint Presentation Infographics Format Ideas
This is a bar chart ppt powerpoint presentation infographics format ideas. This is a two stage process. The stages in this process are bar graph, product, financial year, sales in percentage.
Area Chart Ppt PowerPoint Presentation Icon Show
This is a area chart ppt powerpoint presentation icon show. This is a two stage process. The stages in this process are product, financial year, in percentage, area chart.

Clustered Chart Ppt PowerPoint Presentation Outline Templates
This is a clustered chart ppt powerpoint presentation outline templates. This is a three stage process. The stages in this process are product, in percentage, in years, clustered chart.
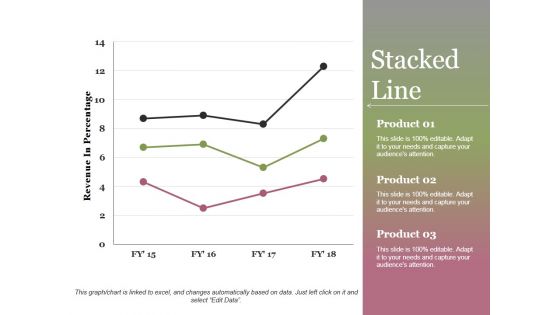
Stacked Line Ppt PowerPoint Presentation Show
This is a stacked line ppt powerpoint presentation show. This is a three stage process. The stages in this process are revenue in percentage, product, stacked line, growth, success.
Area Chart Ppt PowerPoint Presentation Ideas Icon
This is a area chart ppt powerpoint presentation ideas icon. This is a two stage process. The stages in this process are product, area chart, sales in percentage, growth, success.

Column Chart Ppt PowerPoint Presentation Slides Visual Aids
This is a column chart ppt powerpoint presentation slides visual aids. This is a six stage process. The stages in this process are bar graph, growth, success, sales in percentage, financial year.
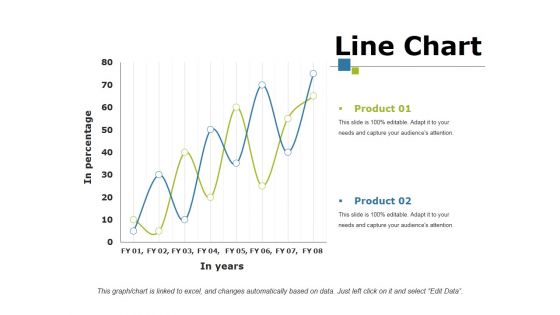
Line Chart Ppt PowerPoint Presentation Portfolio Mockup
This is a line chart ppt powerpoint presentation portfolio mockup. This is a two stage process. The stages in this process are product, in percentage, in year, growth, success.

Clustered Column Line Ppt PowerPoint Presentation Infographic Template Pictures
This is a clustered column line ppt powerpoint presentation infographic template pictures. This is a three stage process. The stages in this process are product, in percentage, bar graph, growth, success.
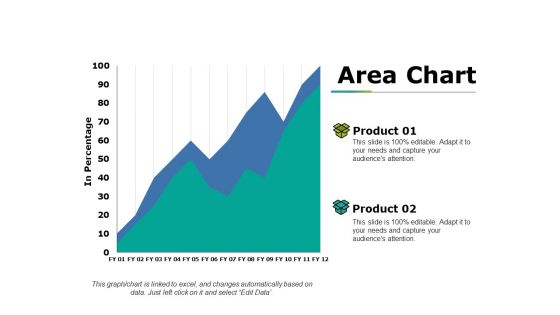
Area Chart Ppt PowerPoint Presentation Show Professional
This is a area chart ppt powerpoint presentation show professional. This is a two stage process. The stages in this process are product, in percentage, area chart, growth, success.
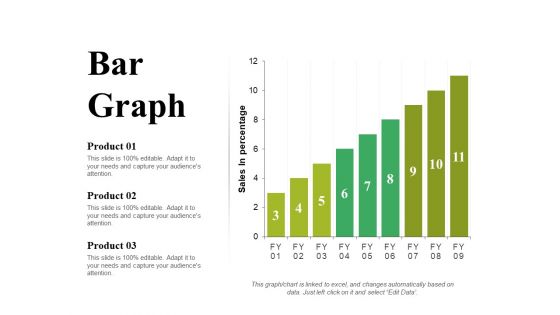
Bar Graph Ppt PowerPoint Presentation Portfolio Slide Portrait
This is a bar graph ppt powerpoint presentation portfolio slide portrait. This is a three stage process. The stages in this process are product, sales in percentage, bar graph, growth, success.

Stacked Area Clustered Column Ppt PowerPoint Presentation Clipart
This is a stacked area clustered column ppt powerpoint presentation clipart. This is a four stage process. The stages in this process are in percentage, stacked area clustered column, product.

Combo Chart Ppt PowerPoint Presentation Shapes
This is a combo chart ppt powerpoint presentation shapes. This is a eight stage process. The stages in this process are combo chart, business, marketing, sales in percentage, bar graph.
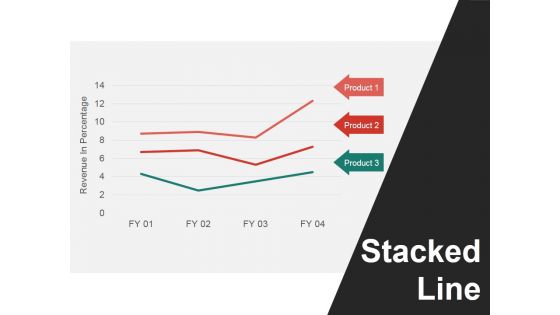
Stacked Line Ppt PowerPoint Presentation Summary Master Slide
This is a stacked line ppt powerpoint presentation summary master slide. This is a three stage process. The stages in this process are revenue in percentage, stacked line, product.

Scatter Chart Ppt PowerPoint Presentation Show Graphic Images
This is a scatter chart ppt powerpoint presentation show graphic images. This is a one stage process. The stages in this process are in percentage, in billions, scatter chart.
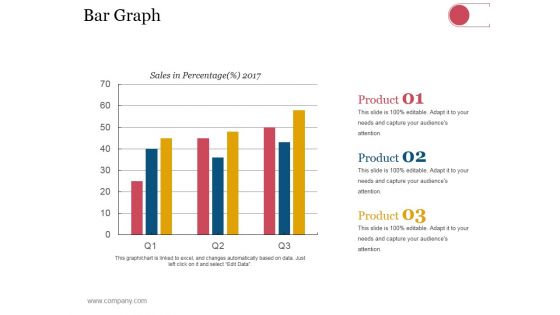
Bar Graph Ppt PowerPoint Presentation Visual Aids Model
This is a bar graph ppt powerpoint presentation visual aids model. This is a three stage process. The stages in this process are business, strategy, analysis, planning, sales in percentage.
Area Chart Ppt PowerPoint Presentation Icon Layout Ideas
This is a area chart ppt powerpoint presentation icon layout ideas. This is a two stage process. The stages in this process are area chart, sales in percentage, years, planning, business.

Column Chart Ppt PowerPoint Presentation Gallery Design Inspiration
This is a column chart ppt powerpoint presentation gallery design inspiration. This is a two stage process. The stages in this process are column chart, product, sales in percentage, financial years.
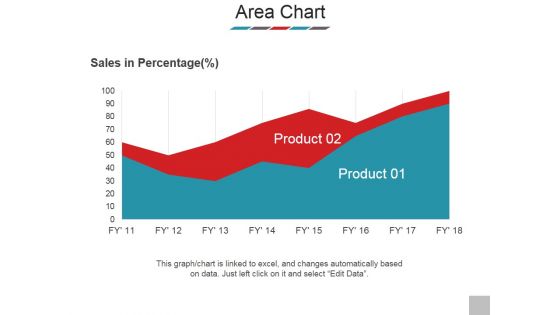
Area Chart Ppt PowerPoint Presentation Styles Images
This is a area chart ppt powerpoint presentation styles images. This is a two stage process. The stages in this process are sales in percentage, product, graph, business, marketing.

Scatter Chart Ppt PowerPoint Presentation Model Show
This is a scatter chart ppt powerpoint presentation model show. This is a one stage process. The stages in this process are sales in percentage, scatter chart, business, bar graph, marketing.
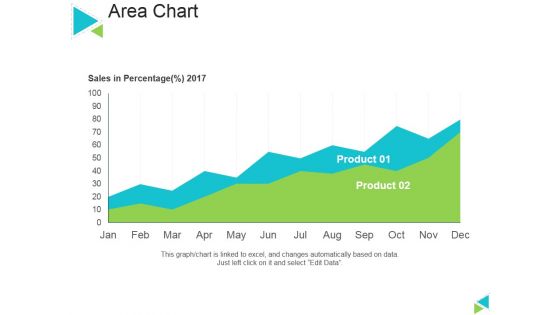
Area Chart Ppt PowerPoint Presentation Inspiration Themes
This is a area chart ppt powerpoint presentation inspiration themes. This is a two stage process. The stages in this process are sales in percentage, product, area chart, business, marketing.
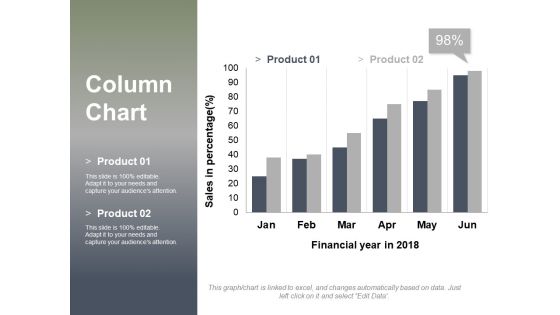
Column Chart Ppt PowerPoint Presentation Layouts Design Inspiration
This is a column chart ppt powerpoint presentation layouts design inspiration. This is a two stage process. The stages in this process are sales in percentage, financial year in, graph, business, finance, marketing.

Area Chart Financial Ppt PowerPoint Presentation Outline Professional
This is a area chart financial ppt powerpoint presentation outline professional. This is a four stage process. The stages in this process are product, sales in percentage, financial year.

Scatter With Smooth Lines And Markers Ppt PowerPoint Presentation Outline Inspiration
This is a scatter with smooth lines and markers ppt powerpoint presentation outline inspiration. This is a two stage process. The stages in this process are product, percentage, finance, growth, line graph.
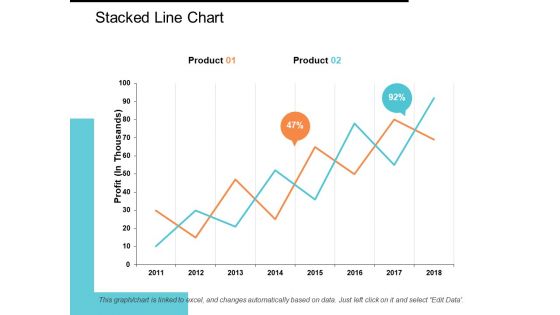
Stacked Line Chart Ppt PowerPoint Presentation Model Show
This is a stacked line chart ppt powerpoint presentation model show. This is a two stage process. The stages in this process are stacked line chart, product, profit, percentage, growth.
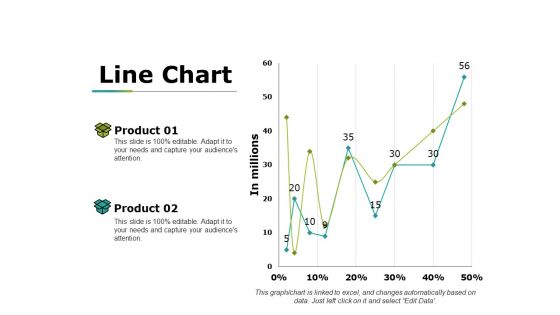
Line Chart Ppt PowerPoint Presentation Infographic Template Design Ideas
This is a line chart ppt powerpoint presentation infographic template design ideas. This is a two stage process. The stages in this process are product, in millions, percentage, line chart, success.
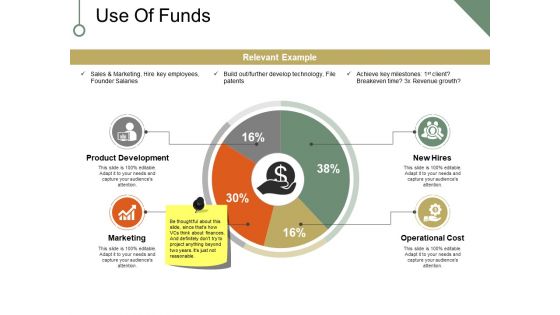
Use Of Funds Ppt PowerPoint Presentation Ideas Designs Download
This is a use of funds ppt powerpoint presentation ideas designs download. This is a four stage process. The stages in this process are product development, percentage, marketing, operational cost, new hires.
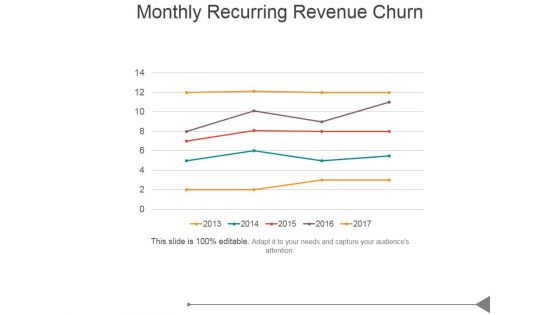
Monthly Recurring Revenue Churn Template 1 Ppt PowerPoint Presentation Clipart
This is a monthly recurring revenue churn template 1 ppt powerpoint presentation clipart. This is a one stage process. The stages in this process are business, marketing, success, in percentage, growth.
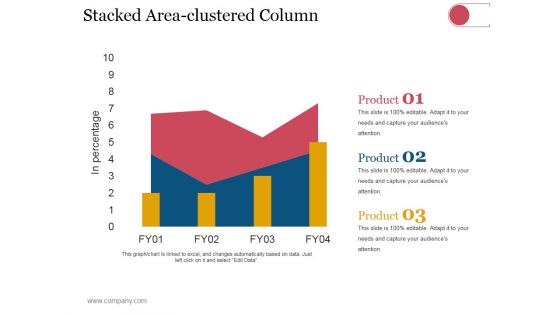
Stacked Area Clustered Column Ppt PowerPoint Presentation Styles Gridlines
This is a stacked area clustered column ppt powerpoint presentation styles gridlines. This is a three stage process. The stages in this process are dollars, in percentage, finance, growth strategy, business, strategy.

External Analysis Trends In Public Sector Employment Ppt PowerPoint Presentation Slides Templates
This is a external analysis trends in public sector employment ppt powerpoint presentation slides templates. This is a seven stage process. The stages in this process are percentage, growth, business, marketing, strategy.

Planning For Future Workforce Needs Ppt PowerPoint Presentation Outline Smartart
This is a planning for future workforce needs ppt powerpoint presentation outline smartart. This is a three stage process. The stages in this process are growth, percentage, number of headcount, year, finance.
Scatter Chart Ppt PowerPoint Presentation Icon Example Introduction
This is a scatter chart ppt powerpoint presentation icon example introduction. This is a two stage process. The stages in this process are product, profit, in percentage, growth, scattered chart.

Area Chart Ppt PowerPoint Presentation Infographics Visual Aids
This is a area chart ppt powerpoint presentation infographics visual aids. This is a two stage process. The stages in this process are product, area chart, in percentage, growth, success.

Stacked Area Clustered Column Ppt PowerPoint Presentation Model Guidelines
This is a stacked area clustered column ppt powerpoint presentation model guidelines. This is a three stage process. The stages in this process are product, in percentage, bar graph, growth, success.
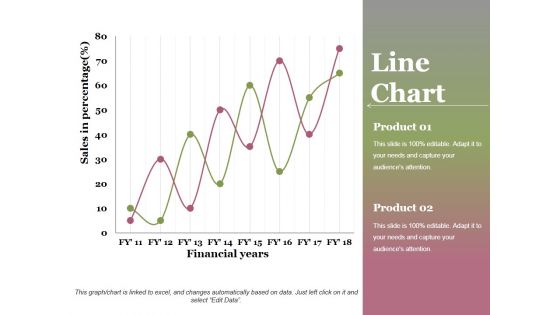
Line Chart Ppt PowerPoint Presentation Professional Graphics Design
This is a line chart ppt powerpoint presentation professional graphics design. This is a two stage process. The stages in this process are financial years, sales in percentage, product, growth, success.
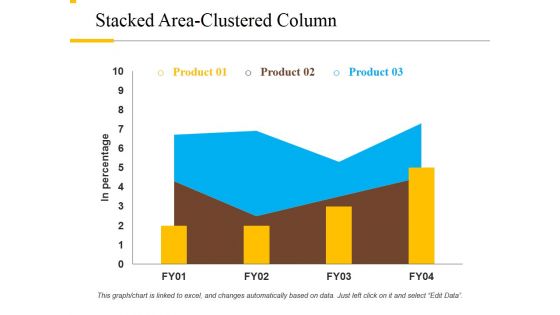
Stacked Area Clustered Column Ppt PowerPoint Presentation File Background Designs
This is a stacked area clustered column ppt powerpoint presentation file background designs. This is a three stage process. The stages in this process are product, in percentage, growth, success, bar graph.
Clustered Column Line Ppt PowerPoint Presentation Icon Ideas
This is a clustered column line ppt powerpoint presentation icon ideas. This is a three stage process. The stages in this process are product, in percentage, bar graph, success, growth.

Clustered Column Template 2 Ppt PowerPoint Presentation Summary Smartart
This is a clustered column template 2 ppt powerpoint presentation summary smartart. This is a two stage process. The stages in this process are product, bar graph, in percentage, clustered column, growth.
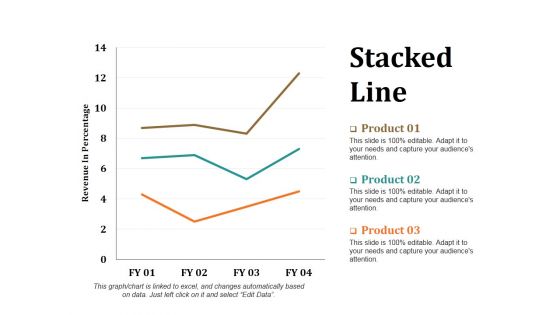
Stacked Line Ppt PowerPoint Presentation Layouts Portrait
This is a stacked line ppt powerpoint presentation layouts portrait. This is a three stage process. The stages in this process are revenue in percentage, stacked line, product, growth, success.

Clustered Column Line Ppt PowerPoint Presentation Summary Background Image
This is a clustered column line ppt powerpoint presentation summary background image. This is a four stage process. The stages in this process are in percentage, product, graph, growth, success.

Clustered Column Ppt PowerPoint Presentation File Graphics
This is a clustered column ppt powerpoint presentation file graphics. This is a two stage process. The stages in this process are product, financial year, sales in percentage, graph, growth.

Line Chart Ppt PowerPoint Presentation File Example File
This is a line chart ppt powerpoint presentation file example file. This is a two stage process. The stages in this process are product, in percentage, in years, growth, success.
Bar Chart Ppt PowerPoint Presentation Icon Information
This is a bar chart ppt powerpoint presentation icon information. This is a one stage process. The stages in this process are product, sales in percentage, financial years, bar graph, growth.

Clustered Column Line Ppt PowerPoint Presentation Topics
This is a clustered column line ppt powerpoint presentation topics. This is a three stage process. The stages in this process are product, in percentage, growth, bar graph, business.

Marketing Speedometer Dashboard Report Ppt PowerPoint Presentation Designs Download
This is a marketing speedometer dashboard report ppt powerpoint presentation designs download. This is a four stage process. The stages in this process are dashboard, measurement, percentage, business, finance.

Bar Graph Ppt PowerPoint Presentation Introduction
This is a bar graph ppt powerpoint presentation introduction. This is a eleven stage process. The stages in this process are management, marketing, business, fy, graph, sales in percentage.
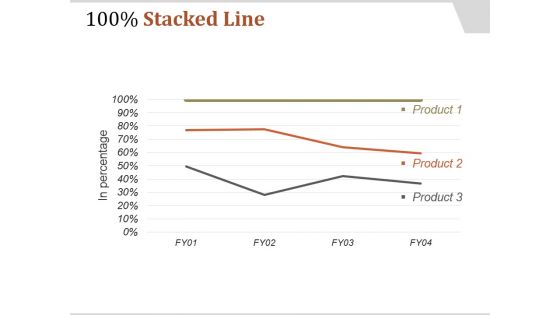
Stacked Line Template 1 Ppt PowerPoint Presentation Background Images
This is a stacked line template 1 ppt powerpoint presentation background images. This is a three stage process. The stages in this process are in percentage, product, business, management.
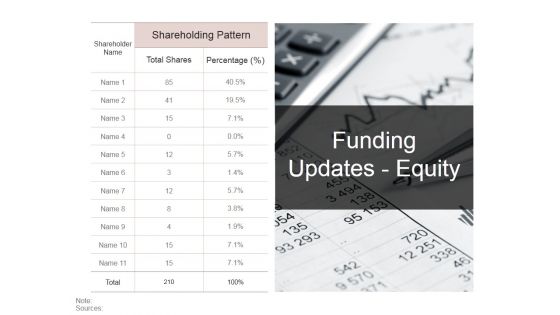
Funding Updates Equity Ppt PowerPoint Presentation Ideas Diagrams
This is a funding updates equity ppt powerpoint presentation ideas diagrams. This is a three stage process. The stages in this process are shareholder name, shareholding pattern, total shares, percentage.

Clustered Column Line Ppt Powerpoint Presentation Ideas Inspiration
This is a clustered column line ppt powerpoint presentation ideas inspiration. This is a four stage process. The stages in this process are product, in percentage, graph, management, business.
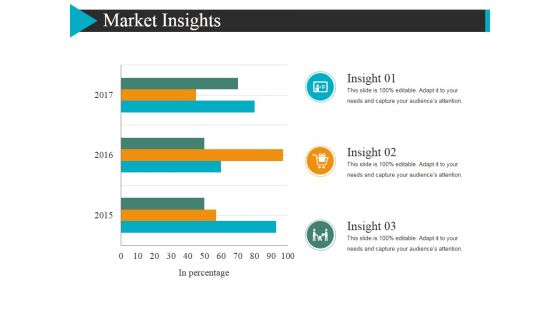
Market Insights Template 2 Ppt Powerpoint Presentation Pictures Gallery
This is a market insights template 2 ppt powerpoint presentation pictures gallery. This is a three stage process. The stages in this process are in percentage, insight, icons, strategy, business.
Financial Highlights Ppt PowerPoint Presentation Icon Slide Download
This is a financial highlights ppt powerpoint presentation icon slide download. This is a three stage process. The stages in this process are percentage, business, strategy, management, finance, analysis.

business model template 2 ppt powerpoint presentation styles
This is a business model template 2 ppt powerpoint presentation styles styles. This is a three stage process. The stages in this process are business, marketing, strategy, management, model, percentage.

 Home
Home