Percentage Progress
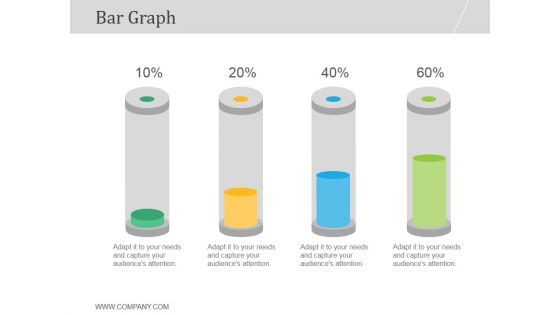
Bar Graph Ppt PowerPoint Presentation Good
This is a bar graph ppt powerpoint presentation good. This is a four stage process. The stages in this process are bar graph, growth, business, marketing, management, percentage.
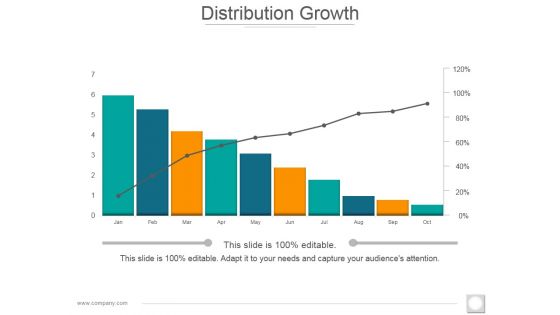
Distribution Growth Ppt PowerPoint Presentation File Visuals
This is a distribution growth ppt powerpoint presentation file visuals. This is a ten stage process. The stages in this process are business, finance, percentage, month, marketing.
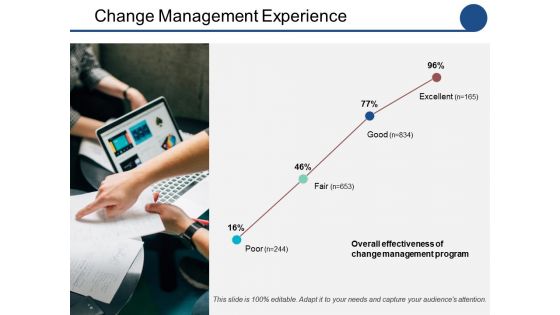
Change Management Experience Ppt PowerPoint Presentation Styles Professional
This is a change management experience ppt powerpoint presentation styles professional. This is a four stage process. The stages in this process are business, marketing, management, percentage.
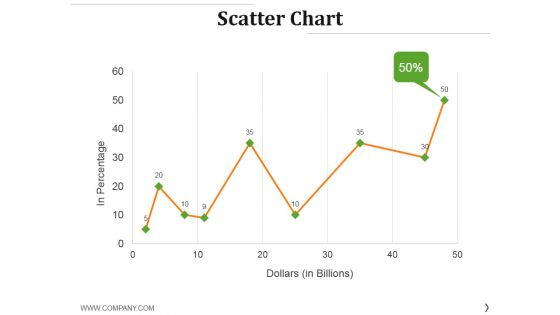
Scatter Chart Ppt PowerPoint Presentation Layouts Gridlines
This is a scatter chart ppt powerpoint presentation layouts gridlines. This is a nine stage process. The stages in this process are in percentage, dollars, growth, success, finance.

Scatter Chart Ppt PowerPoint Presentation Summary Deck
This is a scatter chart ppt powerpoint presentation summary deck. This is a nine stage process. The stages in this process are product, sales in percentage, growth, success.

Scatter Chart Ppt PowerPoint Presentation File Visuals
This is a scatter chart ppt powerpoint presentation file visuals. This is a two stage process. The stages in this process are product, profit, in percentage, growth, success.
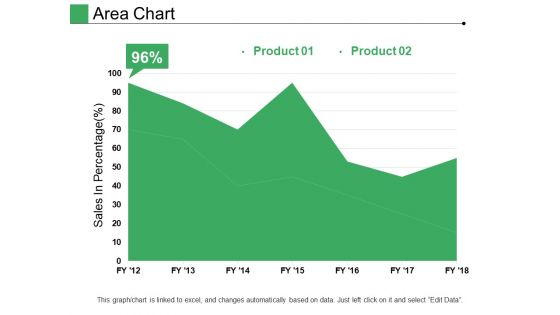
Area Chart Ppt PowerPoint Presentation Pictures Designs
This is a area chart ppt powerpoint presentation pictures designs. This is a two stage process. The stages in this process are product, sales in percentage, growth, success.
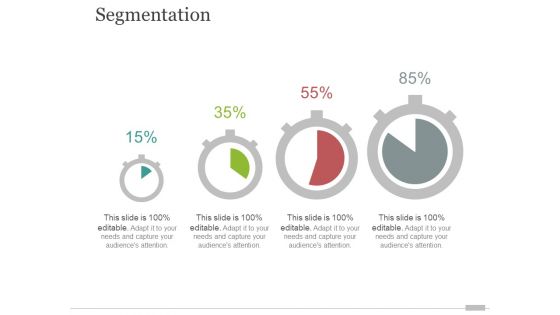
segmentation ppt powerpoint presentation ideas layout ideas
This is a segmentation ppt powerpoint presentation ideas layout ideas. This is a four stage process. The stages in this process are percentage, business, marketing, growth, strategy.
Area Chart Ppt PowerPoint Presentation Icon Graphics Tutorials
This is a area chart ppt powerpoint presentation icon graphics tutorials. This is a two stage process. The stages in this process are chart, percentage, business, growth, strategy.
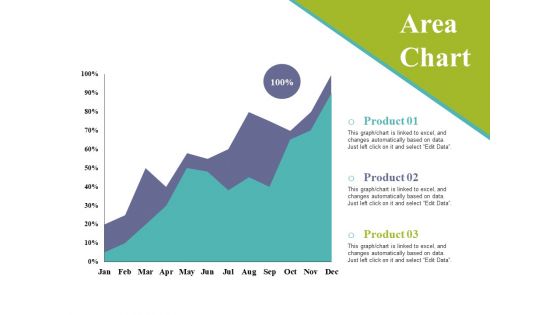
Area Chart Ppt PowerPoint Presentation Inspiration Elements
This is a area chart ppt powerpoint presentation inspiration elements. This is a two stage process. The stages in this process are chart, growth, percentage, strategy, business, marketing.
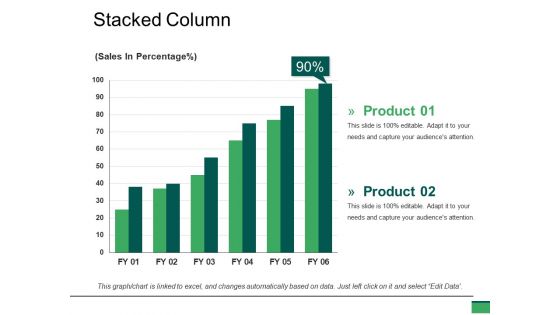
Stacked Column Ppt PowerPoint Presentation Summary Visuals
This is a stacked column ppt powerpoint presentation summary visuals. This is a two stage process. The stages in this process are growth, percentage, business, marketing, graph.

Line Chart Ppt PowerPoint Presentation Professional Template
This is a line chart ppt powerpoint presentation professional template. This is a two stage process. The stages in this process are business, finance, percentage, growth, success.

Area Chart Ppt PowerPoint Presentation Gallery Brochure
This is a area chart ppt powerpoint presentation gallery brochure. This is a two stage process. The stages in this process are product, growth in percentage, success, business.

Performance Comparison Across Quarters Ppt Ideas
This is a performance comparison across quarters ppt ideas. This is a four stage process. The stages in this process are pie, growth, percentage, finance, business, marketing.
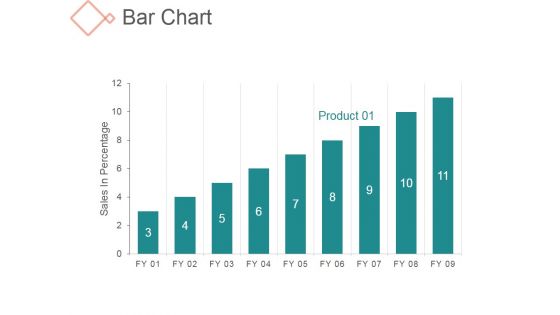
Bar Chart Ppt PowerPoint Presentation Styles
This is a bar chart ppt powerpoint presentation styles. This is a nine stage process. The stages in this process are business, management, sales in percentage, growth.
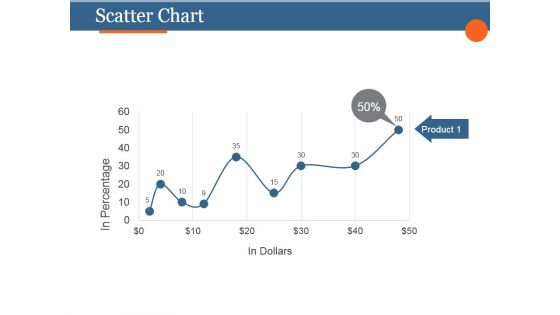
Scatter Chart Ppt PowerPoint Presentation Slides
This is a scatter chart ppt powerpoint presentation slides. This is a five stage process. The stages in this process are product, in dollars, in percentage.
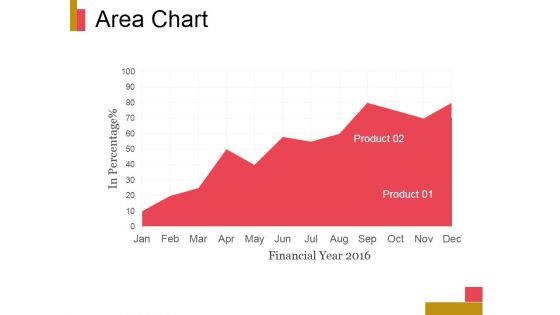
Area Chart Ppt PowerPoint Presentation Professional
This is a area chart ppt powerpoint presentation professional. This is a one stage process. The stages in this process are product, in percentage, jan, feb, mar, apr.

Line Chart Ppt PowerPoint Presentation Example
This is a line chart ppt powerpoint presentation example. This is a two stage process. The stages in this process are product, in percentage, business, marketing.

Area Chart Ppt PowerPoint Presentation Samples
This is a area chart ppt powerpoint presentation samples. This is a two stage process. The stages in this process are financial year, sales in percentage, jan, feb.
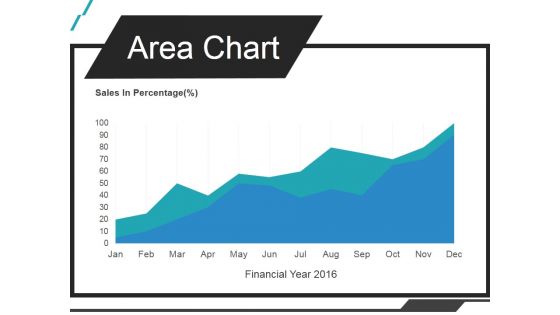
Area Chart Ppt PowerPoint Presentation Infographics
This is a area chart ppt powerpoint presentation infographics. This is a one stage process. The stages in this process are sales in percentage, jan, feb, mar, apr.
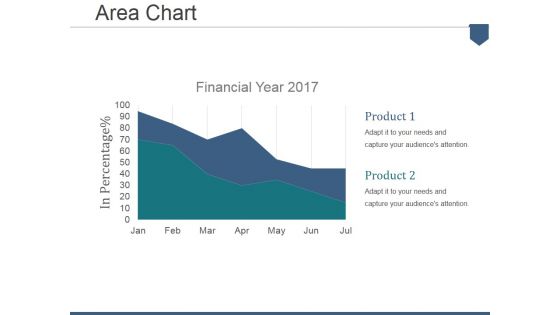
Area Chart Ppt PowerPoint Presentation Summary Example
This is a area chart ppt powerpoint presentation summary example. This is a two stage process. The stages in this process are financial year, in percentage, product.

Bar Graph Ppt PowerPoint Presentation Pictures Display
This is a bar graph ppt powerpoint presentation pictures display. This is a one stage process. The stages in this process are sales in percentage, financial year.

Line Chart Ppt PowerPoint Presentation Layouts Background Image
This is a line chart ppt powerpoint presentation layouts background image. This is a two stage process. The stages in this process are in percentage, in years, product.
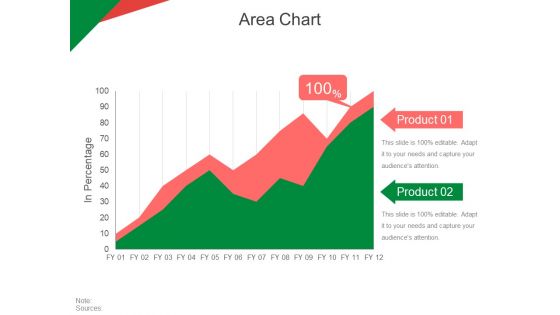
Area Chart Ppt PowerPoint Presentation Inspiration Aids
This is a area chart ppt powerpoint presentation inspiration aids. This is a two stage process. The stages in this process are in percentage, product, business, marketing, strategy.

Line Chart Ppt PowerPoint Presentation Styles Introduction
This is a line chart ppt powerpoint presentation styles introduction. This is a two stage process. The stages in this process are in percentage, product, chart, business, marketing.
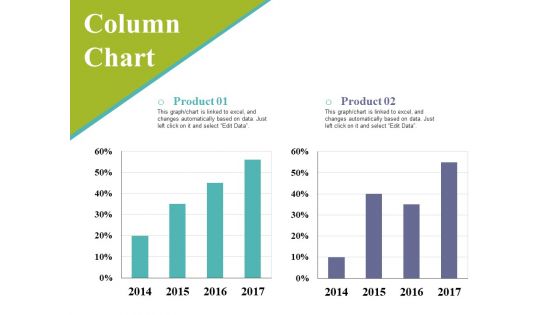
Column Chart Ppt PowerPoint Presentation Styles Background Image
This is a column chart ppt powerpoint presentation styles background image. This is a two stage process. The stages in this process are business, graph, percentage, marketing, strategy.
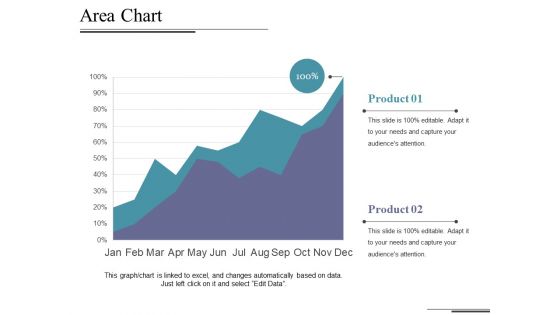
Area Chart Ppt PowerPoint Presentation Outline Graphics Download
This is a area chart ppt powerpoint presentation outline graphics download. This is a two stage process. The stages in this process are chart, percentage, business, marketing, strategy.

Combo Chart Ppt PowerPoint Presentation File Example
This is a combo chart ppt powerpoint presentation file example. This is a three stage process. The stages in this process are product, percentage, marketing, business, management.

Combo Chart Product Ppt PowerPoint Presentation Ideas Styles
This is a combo chart product ppt powerpoint presentation ideas styles. This is a three stage process. The stages in this process are business, management, marketing, percentage, product.
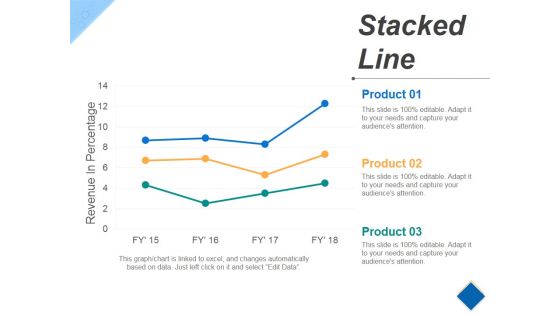
Stacked Line Ppt PowerPoint Presentation Pictures Maker
This is a stacked line ppt powerpoint presentation pictures maker. This is a three stage process. The stages in this process are revenue in percentage, growth, success, product.
Area Chart Ppt PowerPoint Presentation Icon Brochure
This is a area chart ppt powerpoint presentation icon brochure. This is a two stage process. The stages in this process are product, sales in percentage, growth, success.

Line Chart Ppt PowerPoint Presentation Portfolio Show
This is a line chart ppt powerpoint presentation portfolio show. This is a two stage process. The stages in this process are product, in percentage, growth, success.

Overall Revenue Analysis Bar Chart Powerpoint Slide Information
This is a overall revenue analysis bar chart powerpoint slide information. This is a nine stage process. The stages in this process are finance, success, business, marketing, percentage.
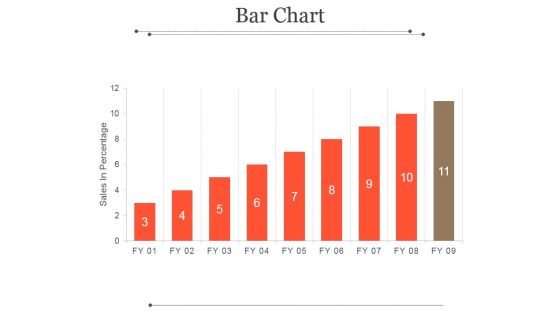
Bar Chart Ppt PowerPoint Presentation Microsoft
This is a bar chart ppt powerpoint presentation microsoft. This is a eleven stage process. The stages in this process are sales in percentage, fy, graph, success, business.
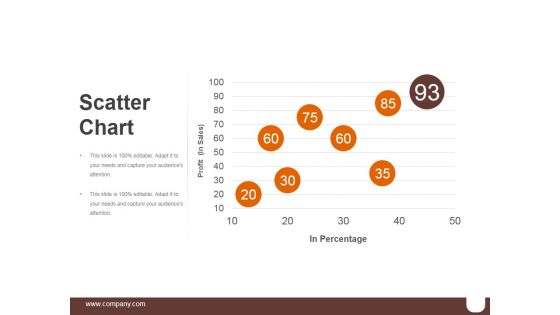
Scatter Chart Ppt PowerPoint Presentation Graphics
This is a scatter chart ppt powerpoint presentation graphics. This is a five stage process. The stages in this process are business, marketing, percentage, success, finance.
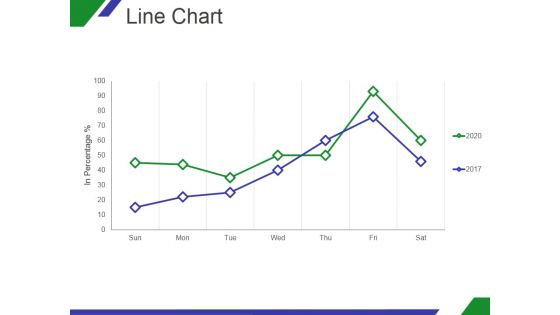
Line Chart Ppt PowerPoint Presentation Shapes
This is a line chart ppt powerpoint presentation shapes. This is a two stage process. The stages in this process are growth, in percentage, sun, mon, tue, wed.

Clustered Bar Ppt PowerPoint Presentation Inspiration
This is a clustered bar ppt powerpoint presentation inspiration. This is a five stage process. The stages in this process are bar graph, business, marketing, finance, percentage.
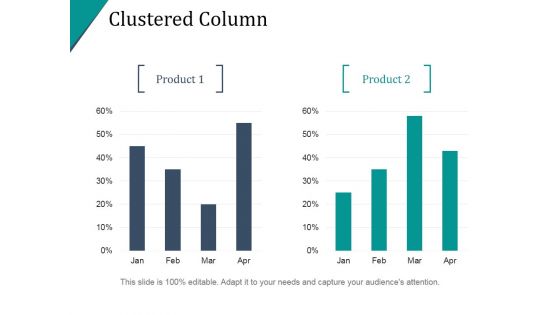
Clustered Column Ppt PowerPoint Presentation Infographic Template
This is a clustered column ppt powerpoint presentation infographic template. This is a two stage process. The stages in this process are finance, percentage, bar graph, business, marketing.
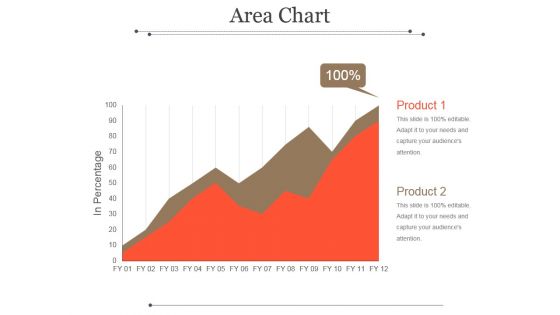
Area Chart Ppt PowerPoint Presentation Picture
This is a area chart ppt powerpoint presentation picture. This is a two stage process. The stages in this process are product, in percentage, graph, management, business.

Clustered Column Line Ppt PowerPoint Presentation Layout
This is a clustered column line ppt powerpoint presentation layout. This is a three stage process. The stages in this process are percentage, product, business, management.
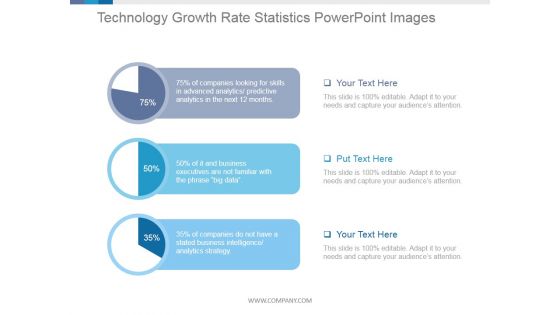
Technology Growth Rate Statistics Ppt PowerPoint Presentation Deck
This is a technology growth rate statistics ppt powerpoint presentation deck. This is a three stage process. The stages in this process are percentage, finance, marketing, business, marketing.
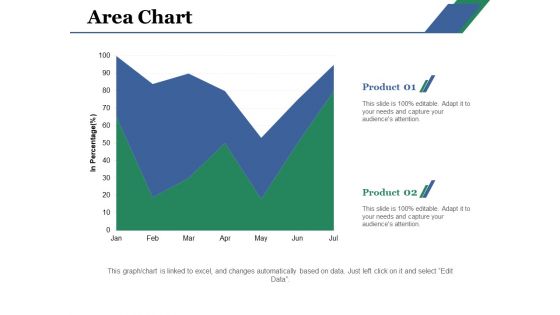
Area Chart Ppt PowerPoint Presentation Layouts Gridlines
This is a area chart ppt powerpoint presentation layouts gridlines. This is a two stage process. The stages in this process are area chart, product, percentage, analysis, capture.
Line Chart Ppt PowerPoint Presentation Icon Inspiration
This is a line chart ppt powerpoint presentation icon inspiration. This is a two stage process. The stages in this process are product, financial years, sales in percentage.

Combo Chart Ppt PowerPoint Presentation Styles Format Ideas
This is a combo chart ppt powerpoint presentation styles format ideas. This is a three stage process. The stages in this process are percentage, product, marketing.

Area Chart Ppt PowerPoint Presentation Designs
This is a area chart ppt powerpoint presentation designs. This is a two stage process. The stages in this process are product, graph, in percentage, growth, business.

Scatter Chart Ppt PowerPoint Presentation Styles Show
This is a scatter chart ppt powerpoint presentation styles show. This is a nine stage process. The stages in this process are dollars, in percentage, finance, growth strategy.
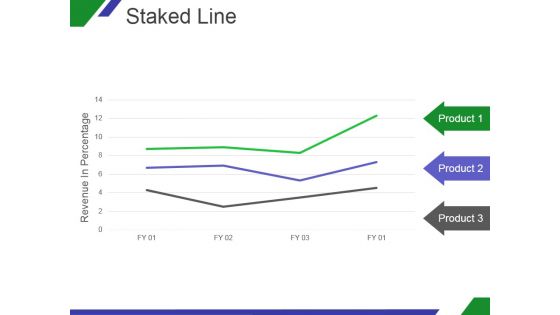
Staked Line Ppt PowerPoint Presentation Slide
This is a staked line ppt powerpoint presentation slide. This is a three stage process. The stages in this process are revenue in percentage, product, business.
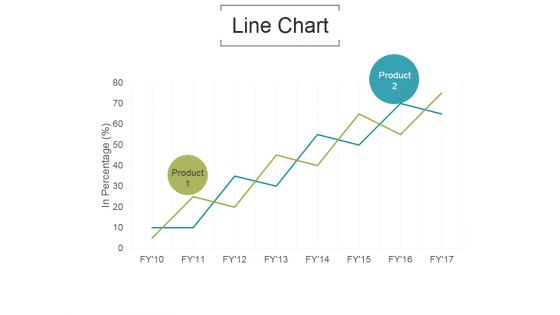
Line Chart Ppt PowerPoint Presentation Model
This is a line chart ppt powerpoint presentation model. This is a two stage process. The stages in this process are in percentage, product, business.

Stacked Line Ppt PowerPoint Presentation Guide
This is a stacked line ppt powerpoint presentation guide. This is a three stage process. The stages in this process are revenue in percentage, product.

Stacked Line Ppt PowerPoint Presentation Gallery Display
This is a stacked line ppt powerpoint presentation gallery display. This is a three stage process. The stages in this process are revenue in percentage, product, graph, finance.
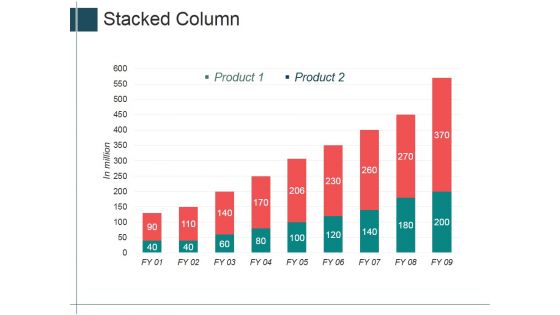
Stacked Column Ppt PowerPoint Presentation Model Good
This is a stacked column ppt powerpoint presentation model good. This is a nine stage process. The stages in this process are finance, percentage, business, product.
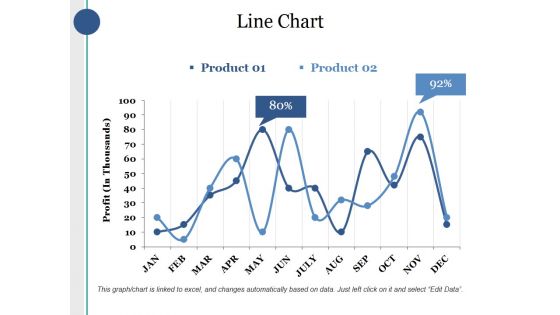
Line Chart Ppt PowerPoint Presentation Layouts Sample
This is a line chart ppt powerpoint presentation layouts sample. This is a two stage process. The stages in this process are product, profit, percentage, finance, business.

Line Chart Ppt PowerPoint Presentation Pictures Layout
This is a line chart ppt powerpoint presentation pictures layout. This is a two stage process. The stages in this process are product, financial years, sales in percentage.

Bubble Chart Ppt PowerPoint Presentation Layouts Demonstration
This is a bubble chart ppt powerpoint presentation icon structure. This is a three stage process. The stages in this process are product, sales in percentage, bubble chart.
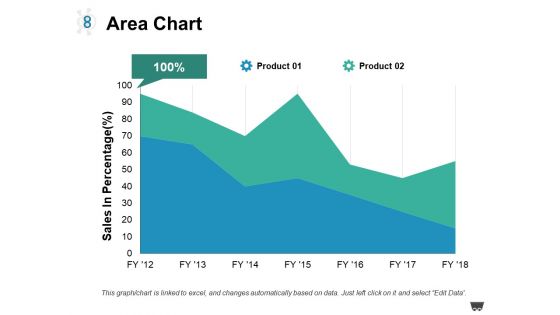
Area Chart Ppt PowerPoint Presentation Model Guidelines
This is a area chart ppt powerpoint presentation model guidelines. This is a two stage process. The stages in this process are product, area chart, sales in percentage.

Clustered Column Line Ppt PowerPoint Presentation Backgrounds
This is a clustered column line ppt powerpoint presentation backgrounds. This is a four stage process. The stages in this process are fire, earthquake, axis title, in percentage.
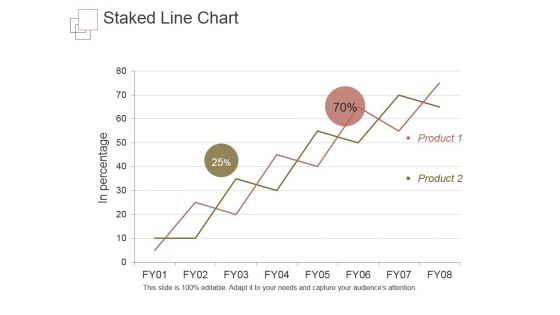
Staked Line Chart Ppt PowerPoint Presentation Topics
This is a staked line chart ppt powerpoint presentation topics. This is a two stage process. The stages in this process are in percentage, product.
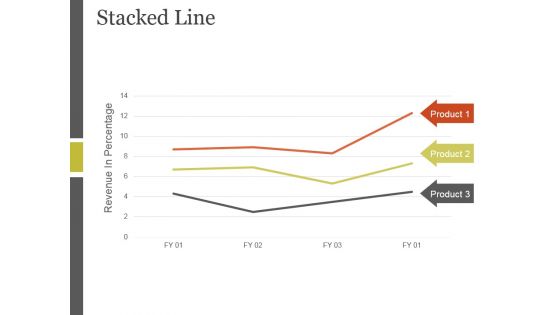
Stacked Line Ppt PowerPoint Presentation Inspiration
This is a stacked line ppt powerpoint presentation inspiration. This is a three stage process. The stages in this process are revenue in percentage, stacked line, product.
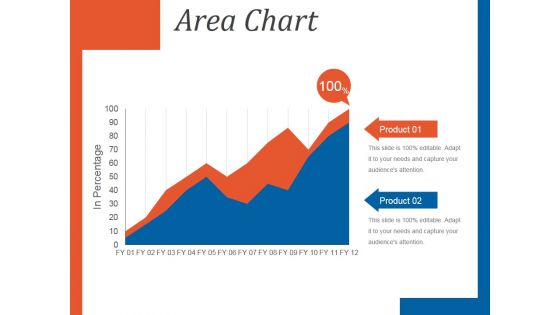
Area Chart Ppt PowerPoint Presentation Diagrams
This is a area chart ppt powerpoint presentation diagrams.This is a two stage process. The stages in this process are in percentage, area chart, product.
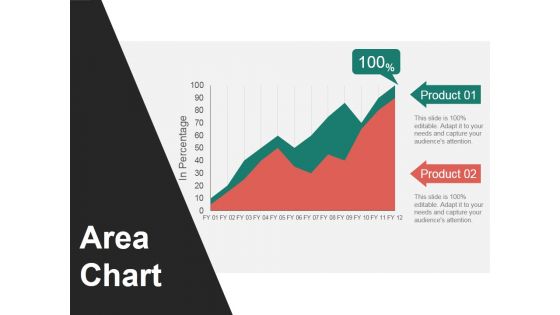
Area Chart Ppt PowerPoint Presentation Slides Graphics Design
This is a area chart ppt powerpoint presentation slides graphics design. This is a two stage process. The stages in this process are area chart, in percentage, product.

Line Chart Ppt PowerPoint Presentation Ideas Portfolio
This is a line chart ppt powerpoint presentation ideas portfolio. This is a two stage process. The stages in this process are line chart, in years, in percentage.
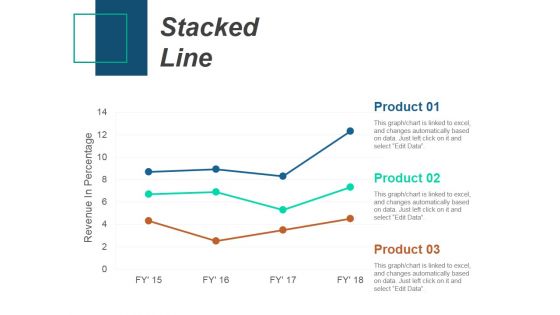
Stacked Line Ppt PowerPoint Presentation Infographics Slideshow
This is a stacked line ppt powerpoint presentation infographics slideshow. This is a three stage process. The stages in this process are stacked line, revenue in percentage, product.
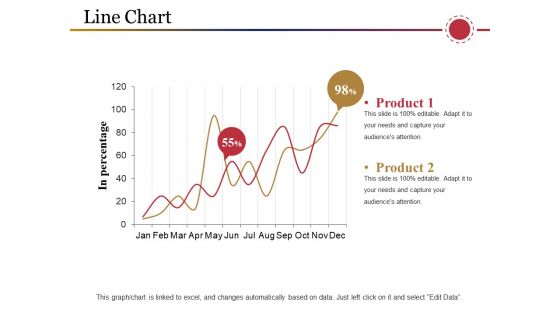
Line Chart Ppt PowerPoint Presentation Inspiration Samples
This is a line chart ppt powerpoint presentation inspiration samples. This is a two stage process. The stages in this process are product, in percentage, business, marketing, graph.

Marketing Roadmap Planner Ppt Ideas
This is a marketing roadmap planner ppt ideas. This is a eight stage process. The stages in this process are finance, percentage, planning, year, growth.

Big Data Database Comparison Ppt PowerPoint Presentation Outline
This is a big data database comparison ppt powerpoint presentation outline. This is a four stage process. The stages in this process are business, finance, management, percentage, growth.
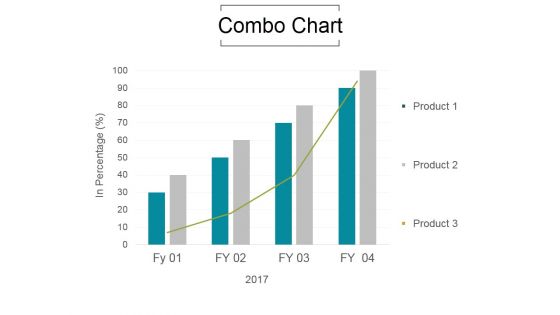
Combo Chart Ppt PowerPoint Presentation Information
This is a combo chart ppt powerpoint presentation information. This is a four stage process. The stages in this process are growth, product, in percentage.
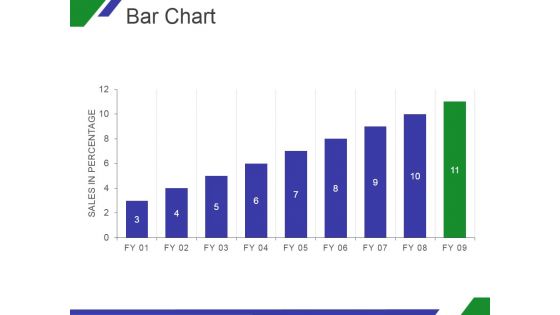
Bar Chart Ppt PowerPoint Presentation Ideas
This is a bar chart ppt powerpoint presentation ideas. This is a nine stage process. The stages in this process are graph, in percentage, growth, business, marketing.
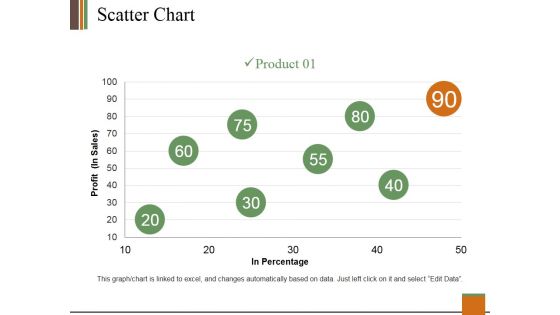
Scatter Chart Ppt PowerPoint Presentation Gallery Guide
This is a scatter chart ppt powerpoint presentation gallery guide. This is a one stage process. The stages in this process are profit, product, in percentage, growth, success.
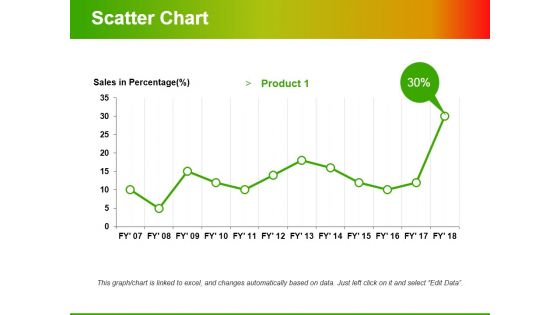
Scatter Chart Ppt PowerPoint Presentation Ideas Professional
This is a scatter chart ppt powerpoint presentation ideas professional. This is a one stage process. The stages in this process are product, percentage, growth, success, line graph.
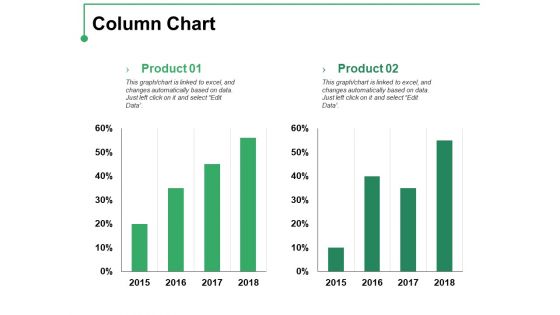
Column Chart Ppt PowerPoint Presentation Professional Template
This is a column chart ppt powerpoint presentation professional template. This is a two stage process. The stages in this process are product, percentage, finance, bar graph, growth.

Stacked Line Chart Ppt PowerPoint Presentation Styles Graphics
This is a stacked line chart ppt powerpoint presentation styles graphics. This is a two stage process. The stages in this process are product, year, profit, percentage, growth.

Comparison Ppt PowerPoint Presentation Show
This is a comparison ppt powerpoint presentation show. This is a five stage process. The stages in this process are compare, percentage, finance, people, ratio.

Dashboard Ppt PowerPoint Presentation Rules
This is a dashboard ppt powerpoint presentation rules. This is a three stage process. The stages in this process are dashboard, measurement, percentage, analysis, business.
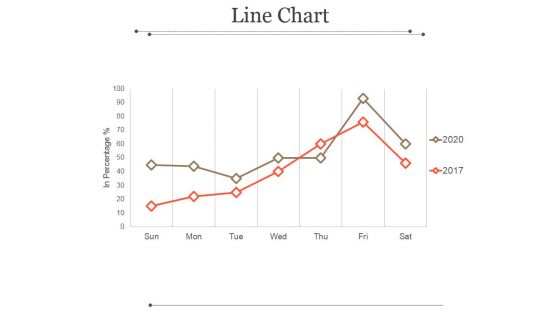
Line Chart Ppt PowerPoint Presentation Ideas
This is a line chart ppt powerpoint presentation ideas. This is a two stage process. The stages in this process are marketing, in percentage, sun, mon, tue, wed.
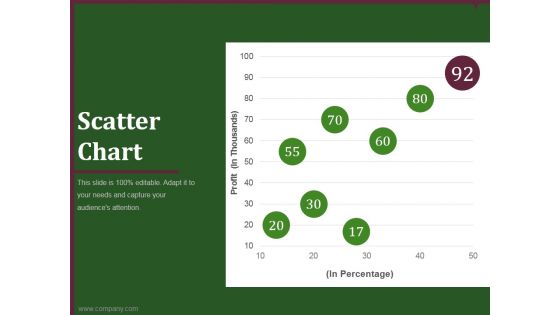
Scatter Chart Ppt PowerPoint Presentation Outline
This is a scatter chart ppt powerpoint presentation outline. This is a five stage process. The stages in this process are business, marketing, graph, percentage, finance.
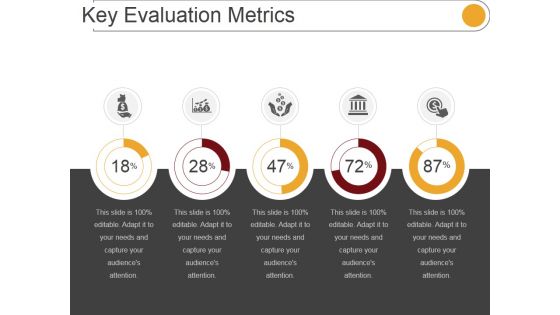
Key Evaluation Metrics Ppt PowerPoint Presentation Influencers
This is a key evaluation metrics ppt powerpoint presentation influencers. This is a five stage process. The stages in this process are icons, percentage, marketing, management.
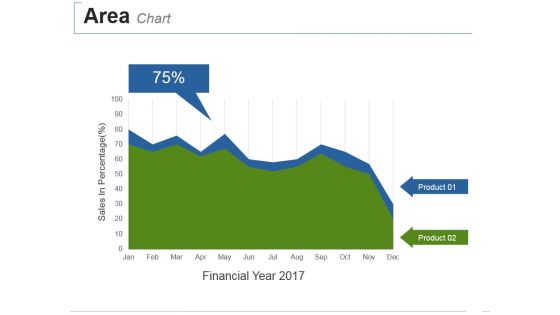
Area Chart Ppt PowerPoint Presentation Summary Deck
This is a area chart ppt powerpoint presentation summary deck. This is a two stage process. The stages in this process are sales in percentage, financial year.

Scatter Chart Ppt PowerPoint Presentation Professional Deck
This is a scatter chart ppt powerpoint presentation professional deck. This is a nine stage process. The stages in this process are percentage, business, marketing, graph, line.
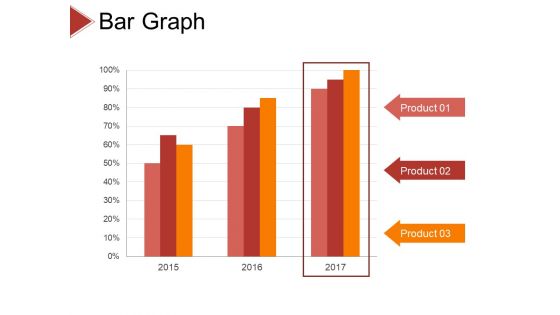
Bar Graph Ppt PowerPoint Presentation Layouts Gridlines
This is a bar graph ppt powerpoint presentation layouts gridlines. this is a three stage process. The stages in this process are product, percentage, business, marketing, management.
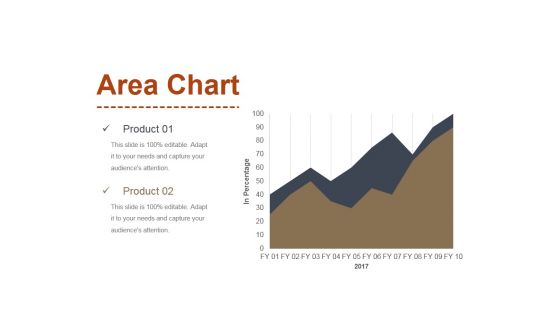
Area Chart Ppt PowerPoint Presentation Inspiration Slides
This is a area chart ppt powerpoint presentation inspiration slides. This is a two stage process. The stages in this process are area chart, product, in percentage.

Clustered Column Ppt PowerPoint Presentation Outline Slide Portrait
This is a clustered column ppt powerpoint presentation outline slide portrait. This is a two stage process. The stages in this process are product, finance, business, marketing, percentage.
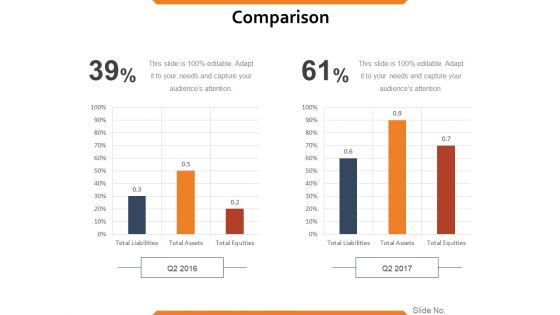
Comparison Ppt PowerPoint Presentation Gallery Outfit
This is a comparison ppt powerpoint presentation gallery outfit. This is a two stage process. The stages in this process are comparison, finance, business, percentage, marketing.

Financial Ppt PowerPoint Presentation Gallery Templates
This is a financial ppt powerpoint presentation gallery templates. This is a three stage process. The stages in this process are circular, percentage, strategy, business, finance.
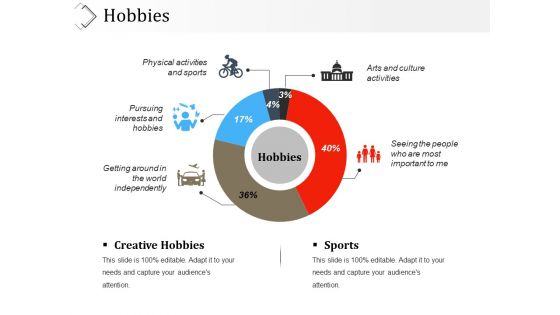
Hobbies Ppt PowerPoint Presentation Visual Aids Styles
This is a hobbies ppt powerpoint presentation visual aids styles. This is a five stage process. The stages in this process are icons, business, percentage, process, marketing.

Hobbies Ppt PowerPoint Presentation Show Templates
This is a hobbies ppt powerpoint presentation show templates. This is a five stage process. The stages in this process are creative hobbies, sports, icons, business, percentage.

Financial Ppt PowerPoint Presentation Show Graphics Pictures
This is a financial ppt powerpoint presentation show graphics pictures. This is a three stage process. The stages in this process are business, finance, percentage, icons.
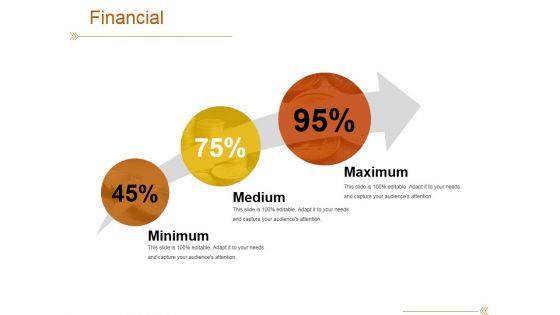
Financial Ppt PowerPoint Presentation Model Graphics Template
This is a financial ppt powerpoint presentation model graphics template. This is a three stage process. The stages in this process are minimum, medium, maximum, percentage, arrow.

Clustered Column Ppt PowerPoint Presentation Ideas Show
This is a clustered column ppt powerpoint presentation ideas show. This is a two stage process. The stages in this process are product, percentage, finance, business, bar graph.

Comparison Ppt PowerPoint Presentation Ideas Guidelines
This is a comparison ppt powerpoint presentation ideas guidelines. This is a four stage process. The stages in this process are compare, percentage, finance, business, marketing.
Area Chart Ppt PowerPoint Presentation Icon Gallery
This is a area chart ppt powerpoint presentation icon gallery. This is a two stage process. The stages in this process are sales in percentage, product, bar graph.
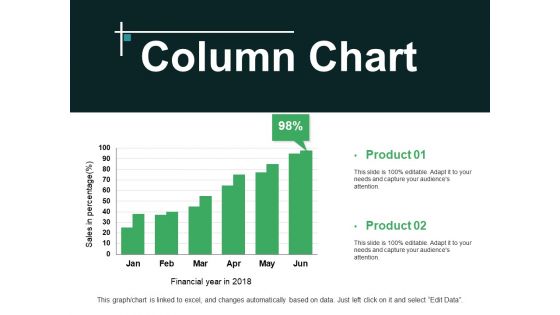
Column Chart Ppt PowerPoint Presentation Professional Aids
This is a column chart ppt powerpoint presentation professional aids. This is a two stage process. The stages in this process are product, sales in percentage, financial years.

Donut Pie Chart Ppt PowerPoint Presentation Show Outline
This is a donut pie chart ppt powerpoint presentation show outline. This is a six stage process. The stages in this process are business, marketing, percentage, chart, process.
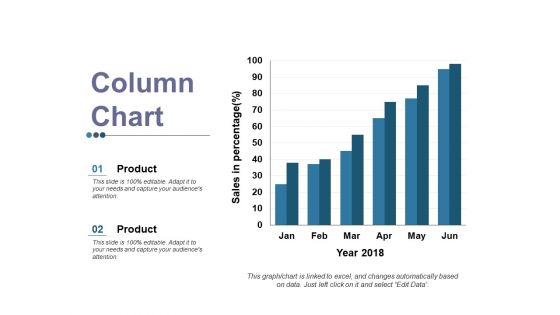
Column Chart Ppt PowerPoint Presentation Gallery Layout
This is a column chart ppt powerpoint presentation gallery layout. This is a two stage process. The stages in this process are product, sales in percentage, year.
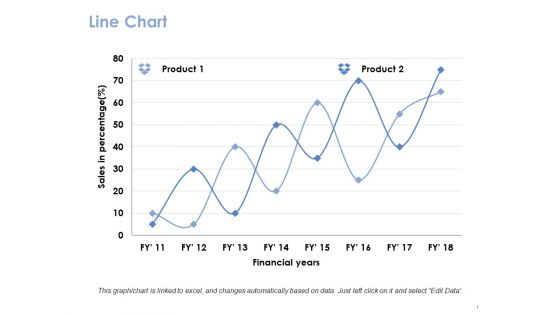
Line Chart Ppt PowerPoint Presentation Gallery Guide
This is a line chart ppt powerpoint presentation gallery guide. This is a two stage process. The stages in this process are product, financial years, sales in percentage.
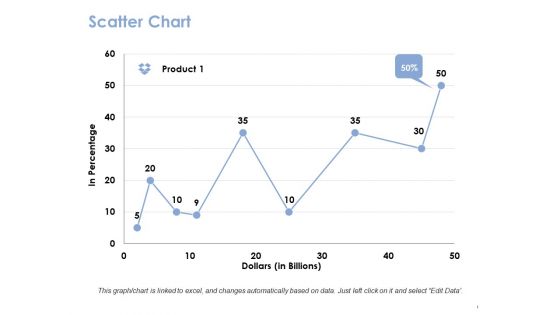
Scatter Chart Ppt PowerPoint Presentation Show Sample
This is a scatter chart ppt powerpoint presentation show sample. This is a one stage process. The stages in this process are product, dollar, in percentage.

Bar Graph Ppt PowerPoint Presentation Ideas Display
This is a bar graph ppt powerpoint presentation ideas display. This is a two stage process. The stages in this process are product, sales in percentage, bar graph.
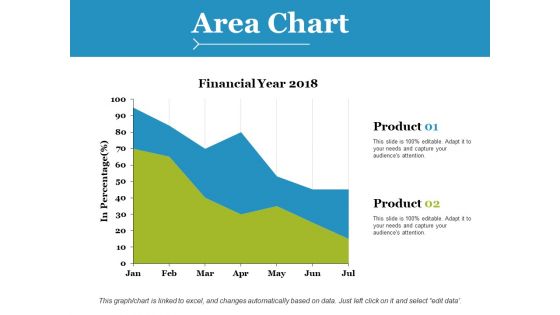
Area Chart Ppt PowerPoint Presentation Styles Brochure
This is a area chart ppt powerpoint presentation styles brochure. This is a two stage process. The stages in this process are product, financial years, in percentage.
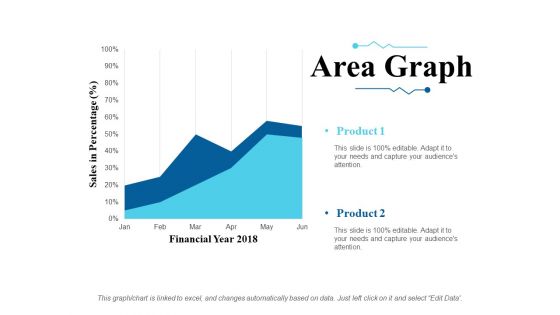
Area Graph Ppt PowerPoint Presentation Slides Ideas
This is a area graph ppt powerpoint presentation slides ideas. This is a two stage process. The stages in this process are sales in percentage, financial year, product.
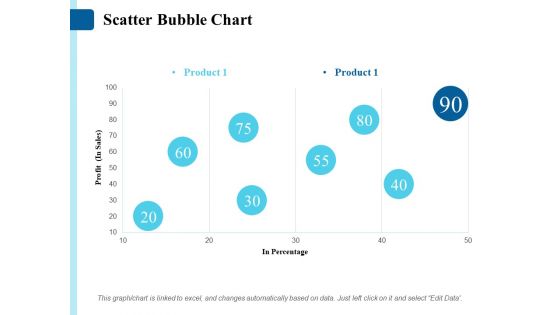
Scatter Bubble Chart Ppt PowerPoint Presentation Summary Slides
This is a scatter bubble chart ppt powerpoint presentation summary slides. This is a one stage process. The stages in this process are product, profit, in percentage.
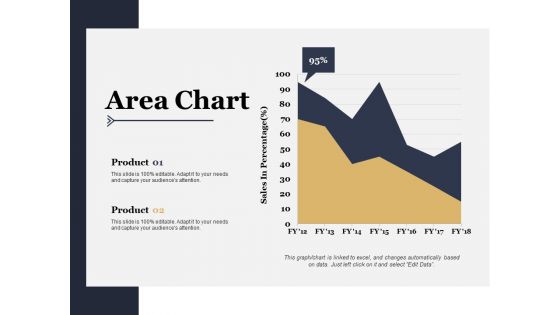
Area Chart Ppt PowerPoint Presentation Styles Professional
This is a area chart ppt powerpoint presentation styles professional. This is a two stage process. The stages in this process are sales in percentage, product, area chart.

Bubble Chart Ppt PowerPoint Presentation Outline Demonstration
This is a bubble chart ppt powerpoint presentation outline demonstration. This is a two stage process. The stages in this process are bubble chart, product, in percentage.
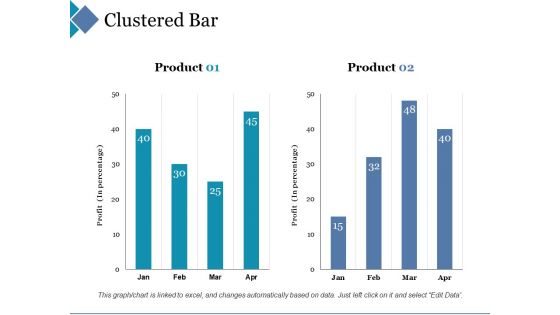
Clustered Bar Ppt PowerPoint Presentation Layouts Professional
This is a clustered bar ppt powerpoint presentation layouts professional. This is a two stage process. The stages in this process are clustered bar, product, profit, percentage.

Area Chart Ppt PowerPoint Presentation Show Graphics
This is a area chart ppt powerpoint presentation show graphics. This is a three stage process. The stages in this process are percentage, product, marketing, management, business.
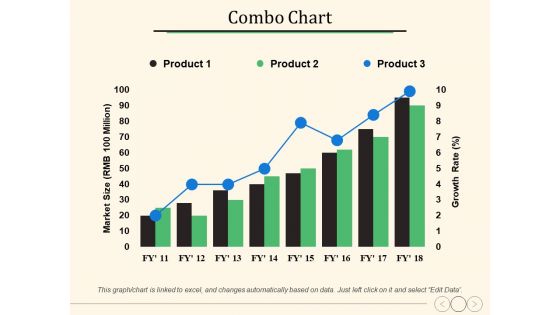
Combo Chart Ppt PowerPoint Presentation Slides Slideshow
This is a combo chart ppt powerpoint presentation slides slideshow. This is a three stage process. The stages in this process are percentage, product, marketing, management, business.
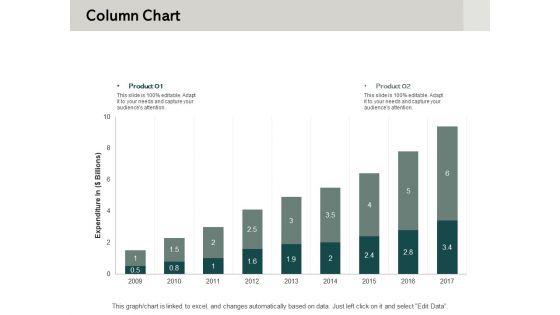
Column Chart Ppt PowerPoint Presentation Show Objects
This is a column chart ppt powerpoint presentation show objects. This is a two stage process. The stages in this process are percentage, product, business, management, marketing.

Column Chart Ppt PowerPoint Presentation Model Slideshow
This is a column chart ppt powerpoint presentation model slideshow. This is a two stage process. The stages in this process are percentage, product, business, marketing.
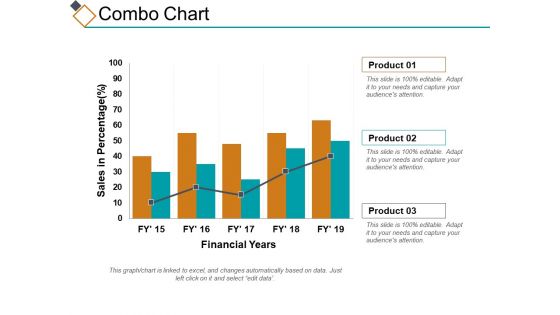
Combo Chart Ppt PowerPoint Presentation Styles Topics
This is a combo chart ppt powerpoint presentation styles topics. This is a three stage process. The stages in this process are percentage, product, business, management, marketing.
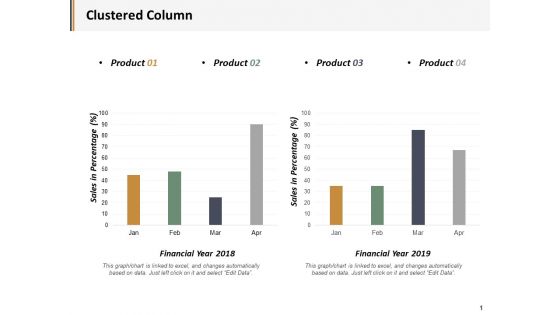
Clustered Column Product Ppt PowerPoint Presentation Show Guidelines
This is a clustered column product ppt powerpoint presentation show guidelines. This is a four stage process. The stages in this process are business, management, marketing, percentage, product.

Column Chart Financial Ppt PowerPoint Presentation Information
This is a column chart financial ppt powerpoint presentation information. This is a three stage process. The stages in this process are business, management, marketing, percentage, product.
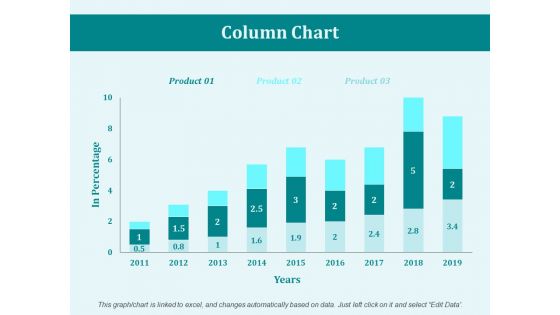
Column Chart Marketing Ppt PowerPoint Presentation Summary Images
This is a column chart marketing ppt powerpoint presentation summary images. This is a three stage process. The stages in this process are business, management, marketing, product, percentage.
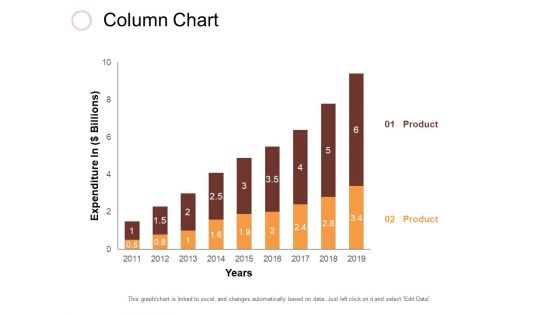
Column Chart Ppt PowerPoint Presentation Slides Clipart
This is a column chart ppt powerpoint presentation slides clipart. This is a two stage process. The stages in this process are business, management, marketing, percentage, product.
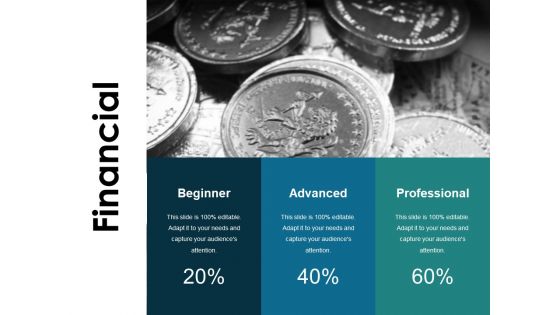
Financial Ppt PowerPoint Presentation Infographic Template
This is a financial ppt powerpoint presentation infographic template. This is a three stage process. The stages in this process are beginner, advanced, professional, finance, percentage.
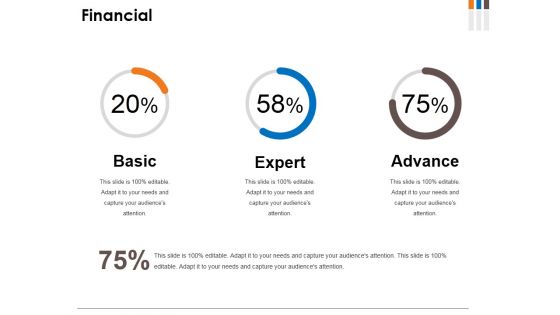
Financial Ppt PowerPoint Presentation Infographics Portfolio
This is a financial ppt powerpoint presentation infographics portfolio. This is a three stage process. The stages in this process are basic, expert, advance, percentage, finance.
Core Strategic Audience Powerpoint Graphics
This is a core strategic audience powerpoint graphics. This is a six stage process. The stages in this process are circular, growth, business, marketing, percentage.

Core Strategic Circular Diagram Powerpoint Images
This is a core strategic circular diagram powerpoint images. This is a six stage process. The stages in this process are circular, growth, business, marketing, percentage.

Marketing Plan And Budget Powerpoint Show
This is a marketing plan and budget powerpoint show. This is a six stage process. The stages in this process are growth, business, marketing, percentage, currency.
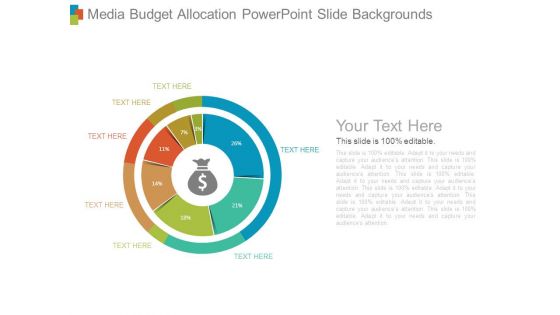
Media Budget Allocation Powerpoint Slide Backgrounds
This is a media budget allocation powerpoint slide backgrounds. This is a seven stage process. The stages in this process are growth, business, marketing, percentage, currency.
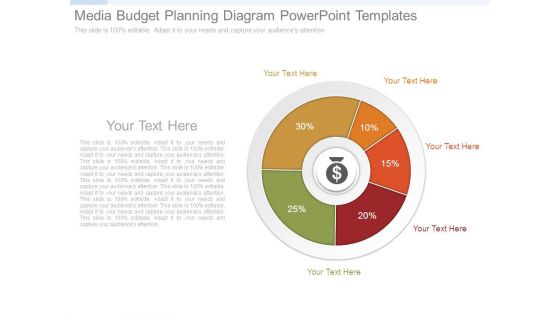
Media Budget Planning Diagram Powerpoint Templates
This is a media budget planning diagram powerpoint templates. This is a six stage process. The stages in this process are growth, business, marketing, percentage.
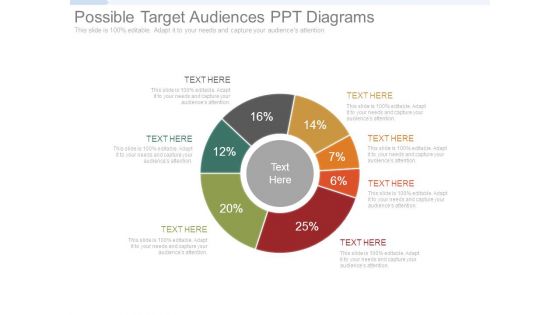
Possible Target Audiences Ppt Diagrams
This is a possible target audiences ppt diagrams. This is a seven stage process. The stages in this process are growth, business, marketing, percentage.

Social Media Marketing Budget Powerpoint Topics
This is a social media marketing budget powerpoint topics. This is a seven stage process. The stages in this process are pie, growth, business, marketing, percentage.

Area Chart Ppt PowerPoint Presentation Pictures Graphics Design
This is a area chart ppt powerpoint presentation pictures graphics design. This is a two stage process. The stages in this process are charts, success, finance, percentage, growth.

Comparison Ppt PowerPoint Presentation Layouts Gridlines
This is a comparison ppt powerpoint presentation layouts gridlines. This is a three stage process. The stages in this process are year, growth, success, percentage, finance.
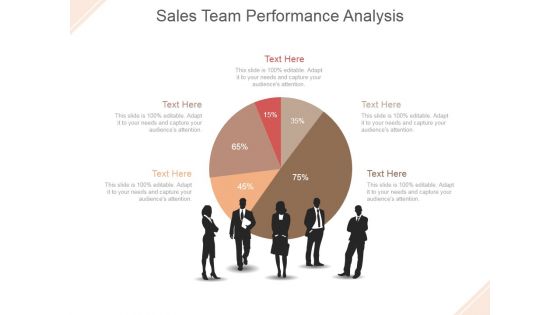
Sales Team Performance Analysis Ppt PowerPoint Presentation Inspiration
This is a sales team performance analysis ppt powerpoint presentation inspiration. This is a five stage process. The stage in this process are pie, finance, people, communication, percentage.

Our Market Template Ppt PowerPoint Presentation Design Templates
This is a our market template ppt powerpoint presentation design templates. This is a four stage process. The stages in this process are pie, percentage, finance, division, analysis.

Bar Graph Ppt PowerPoint Presentation Layouts Pictures
This is a bar graph ppt powerpoint presentation layouts pictures. This is a four stage process. The stages in this process are fire, earthquake, axis title, in percentage.

Combo Chart Ppt PowerPoint Presentation Model Grid
This is a combo chart ppt powerpoint presentation model grid. This is a three stage process. The stages in this process are growth, product, percentage, marketing.
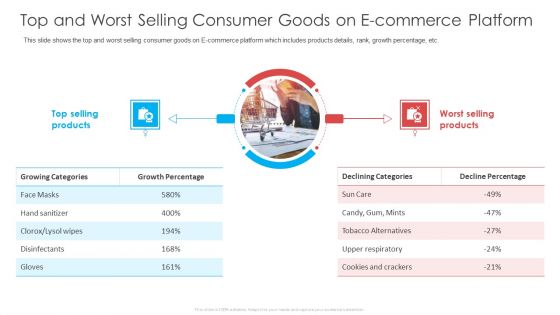
Top And Worst Selling Consumer Goods On E Commerce Platform Ppt File Outline PDF
This slide shows the top and worst selling consumer goods on E-commerce platform which includes products details, rank, growth percentage, etc. Deliver an awe-inspiring pitch with this creative top and worst selling consumer goods on e commerce platform ppt file outline pdf bundle. Topics like growth percentage, decline percentage, selling products can be discussed with this completely editable template. It is available for immediate download depending on the needs and requirements of the user.
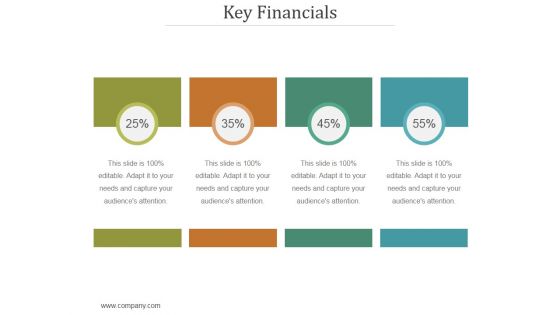
Key Financials Ppt PowerPoint Presentation Clipart
This is a key financials ppt powerpoint presentation clipart. This is a four stage process. The stages in this process are percentage, finance, success, growth, analysis.

Financial Data Analysis Ppt Samples Download
This is a financial data analysis ppt samples download. This is a three stage process. The stages in this process are arrow, growth, percentage, finance, success.
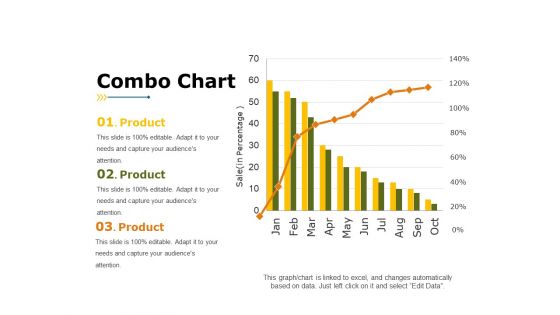
Combo Chart Ppt PowerPoint Presentation Portfolio Template
This is a combo chart ppt powerpoint presentation portfolio template. This is a three stage process. The stages in this process are product, business, marketing, combo chart, percentage.
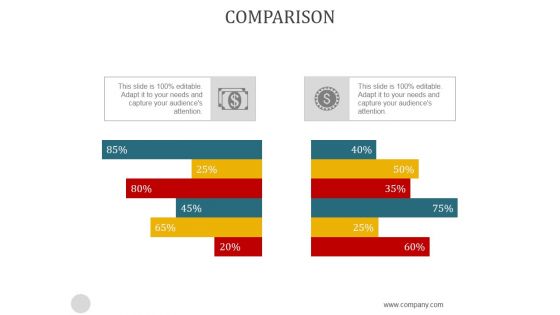
Comparison Ppt PowerPoint Presentation Visuals
This is a comparison ppt powerpoint presentation visuals. This is a two stage process. The stages in this process are percentage, business, marketing, strategy, success.

Key Evaluation Metrics Ppt PowerPoint Presentation Files
This is a key evaluation metrics ppt powerpoint presentation files. This is a five stage process. The stages in this process are icons, business, management, success, percentage.

Financials Ppt PowerPoint Presentation Clipart
This is a financials ppt powerpoint presentation clipart. This is a four stage process. The stages in this process are icons, percentage, finance, success, strategy.

Resource Utilization And Forecasting Powerpoint Guide
This is a resource utilization and forecasting powerpoint guide. This is a five stage process. The stages in this process are donut, business, marketing, growth, percentage.
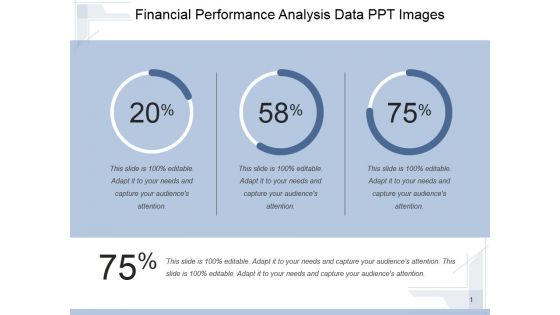
Financial Performance Analysis Data Ppt PowerPoint Presentation Topics
This is a financial performance analysis data ppt powerpoint presentation topics. This is a three stage process. The stages in this process are finance, percentage, marketing, business, growth.
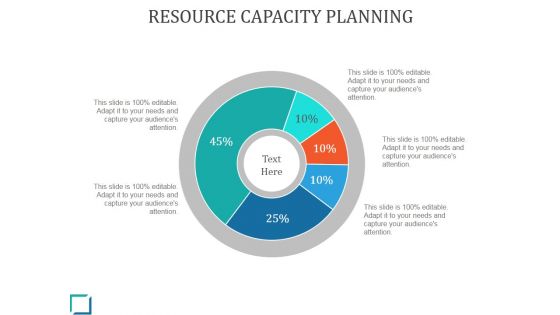
Resource Capacity Planning Ppt PowerPoint Presentation Example
This is a resource capacity planning ppt powerpoint presentation example. This is a five stage process. The stages in this process are pie, percentage, finance, management, growth.

Financial Ppt PowerPoint Presentation Ideas Show
This is a financial ppt powerpoint presentation ideas show. This is a four stage process. The stages in this process are percentage, finance, business, marketing, growth.

Competitor Positioning Ppt PowerPoint Presentation Styles Aids
This is a competitor positioning ppt powerpoint presentation styles aids. This is a two stage process. The stages in this process are company growth, business, percentage, finance, graph.

Pie Chart Ppt PowerPoint Presentation Layouts Elements
This is a pie chart ppt powerpoint presentation layouts elements. This is a four stage process. The stages in this process are product, business, marketing, percentage, growth.
Pie Ppt PowerPoint Presentation Icon Designs Download
This is a pie ppt powerpoint presentation icon designs download. This is a four stage process. The stages in this process are pie, growth, finance, business, percentage.

Financial Ppt PowerPoint Presentation Portfolio
This is a financial ppt powerpoint presentation portfolio. This is a four stage process. The stages in this process are finance, business, marketing, percentage, compare.

Development And Testing Ppt PowerPoint Presentation Gallery Slideshow
This is a development and testing ppt powerpoint presentation gallery slideshow. This is a five stage process. The stages in this process are percentage, business, finance, marketing, graph.
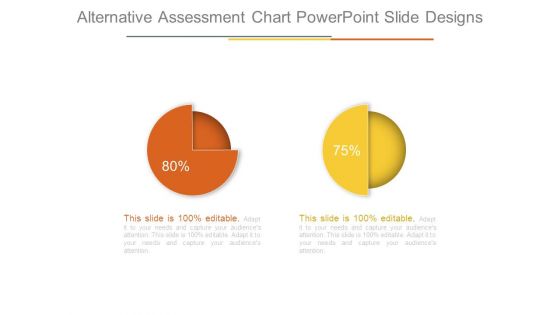
Alternative Assessment Chart Powerpoint Slide Designs
This is a alternative assessment chart powerpoint slide designs. This is a two stage process. The stages in this process are business, marketing, percentage, finance, success.

Alternatives Evaluation Process Powerpoint Slide Design Templates
This is a alternatives evaluation process powerpoint slide design templates. This is a three stage process. The stages in this process are arrows, business, marketing, percentage, finance, success.
Operating Expenses Analysis Pie Chart Ppt Icon
This is a operating expenses analysis pie chart ppt icon. This is a seven stage process. The stages in this process are finance, success, business, marketing, percentage.
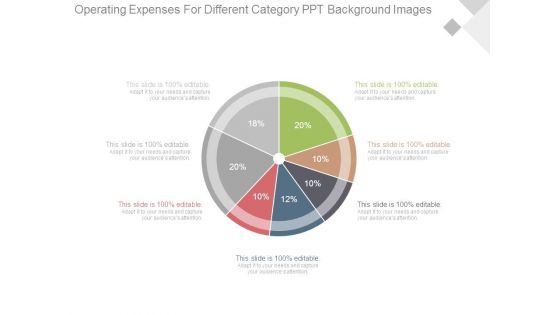
Operating Expenses For Different Category Ppt Background Images
This is a operating expenses for different category ppt background images. This is a seven stage process. The stages in this process are finance, success, business, marketing, percentage.

Operating Expenses With Category Segmentation Powerpoint Slide Inspiration
This is a operating expenses with category segmentation powerpoint slide inspiration. This is a five stage process. The stages in this process are finance, success, business, marketing, percentage.
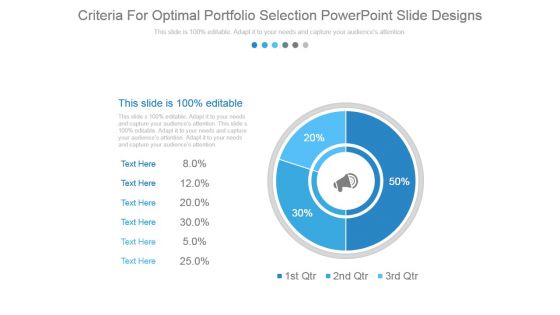
Criteria For Optimal Portfolio Selection Powerpoint Slide Designs
This is a criteria for optimal portfolio selection powerpoint slide designs. This is a three stage process. The stages in this process are business, marketing, success, percentage.
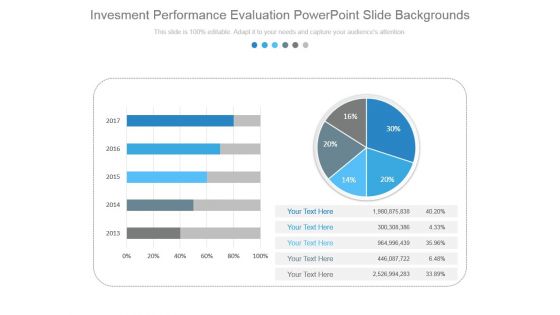
Investment Performance Evaluation Powerpoint Slide Backgrounds
This is a investment performance evaluation powerpoint slide backgrounds. This is a five stage process. The stages in this process are business, marketing, success, percentage, pie, years.
Comparison Ppt PowerPoint Presentation Icon
This is a comparison ppt powerpoint presentation icon. This is a two stage process. The stages in this process are business, comparison, strategy, percentage, success.
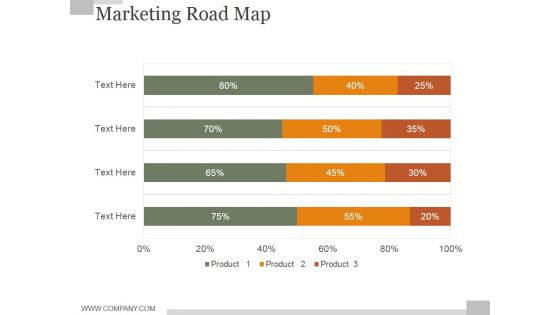
Marketing Road Map Ppt PowerPoint Presentation Ideas
This is a marketing road map ppt powerpoint presentation ideas. This is a four stage process. The stages in this process are business, percentage, marketing, strategy, success.
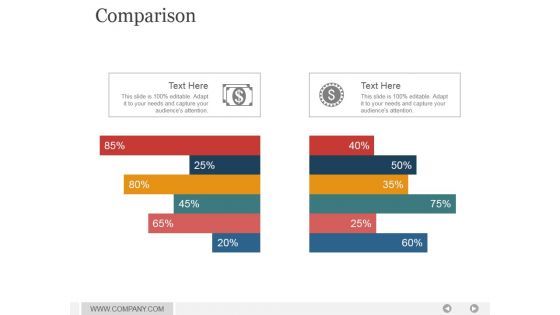
Comparison Ppt PowerPoint Presentation Pictures
This is a comparison ppt powerpoint presentation pictures. This is a two stage process. The stages in this process are business, comparison, percentage, marketing, analysis, success.
Compare Ppt PowerPoint Presentation Templates
This is a compare ppt powerpoint presentation templates. This is a two stage process. The stages in this process are business, comparison, percentage, people, finance.

Donut Ppt PowerPoint Presentation Diagrams
This is a donut ppt powerpoint presentation diagrams. This is a six stage process. The stages in this process are donut, percentage, analysis, marketing, strategy, business.

Portfolio Asset Allocation Ppt Images
This is a portfolio asset allocation ppt images. This is a six stage process. The stages in this process are percentage, finance, business, marketing, icons, strategy.
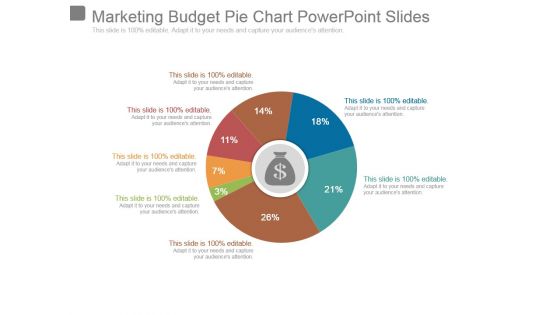
Marketing Budget Pie Chart Powerpoint Slides
This is a marketing budget pie chart powerpoint slides. This is a seven stage process. The stages in this process are business, marketing, strategy, finance, percentage.

Media Budget Planning Powerpoint Presentation Templates
This is a media budget planning powerpoint presentation templates. This is a seven stage process. The stages in this process are business, marketing, strategy, finance, percentage.
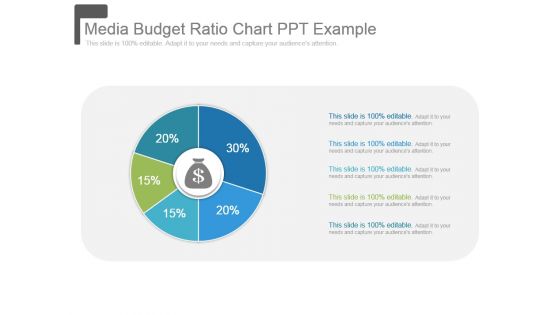
Media Budget Ratio Chart Ppt Example
This is a media budget ratio chart ppt example. This is a five stage process. The stages in this process are strategy, finance, percentage, business, marketing.

Pie Chart For Core Strategy Ppt Design Templates
This is a pie chart for core strategy ppt design templates. This is a five stage process. The stages in this process are business, marketing, strategy, finance, percentage.
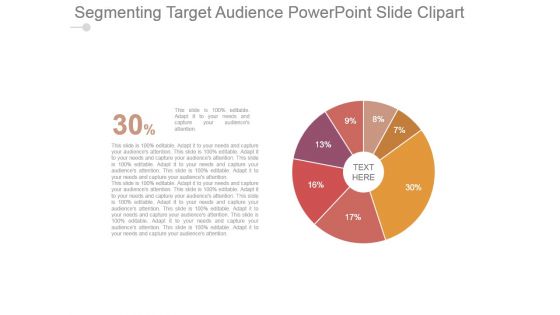
Segmenting Target Audience Powerpoint Slide Clipart
This is a segmenting target audience powerpoint slide clipart. This is a seven stage process. The stages in this process are strategy, finance, percentage, business, pie.

Marketing Activity Dashboard Ppt PowerPoint Presentation Samples
This is a marketing activity dashboard ppt powerpoint presentation samples. This is a three stage process. The stage in this process are dashboard, percentage, finance, measurement, business.
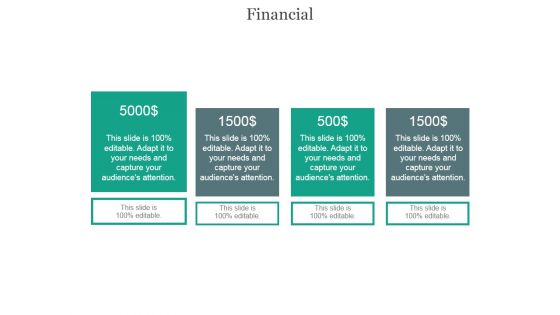
Financial Ppt PowerPoint Presentation Design Templates
This is a financial ppt powerpoint presentation design templates. This is a four stage process. The stages in this process are business, marketing, finance, analysis, percentage.
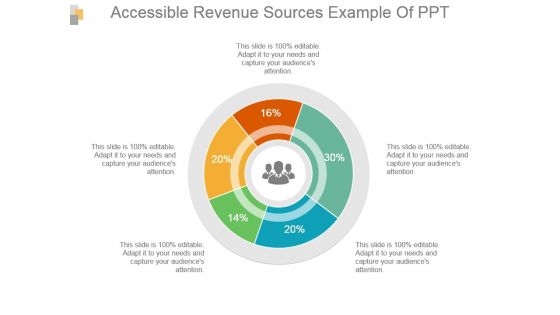
Accessible Revenue Sources Example Of Ppt
This is a accessible revenue sources example of ppt. This is a five stage process. The stages in this process are business, process, financial, percentage, revenue.

Radar Chart Ppt PowerPoint Presentation Portfolio Design Inspiration
This is a radar chart ppt powerpoint presentation portfolio design inspiration. This is a two stage process. The stages in this process are product, percentage, business, marketing, finance.

Pie Chart For Result Analysis Ppt Example File
This is a pie chart for result analysis ppt example file. This is a seven stage process. The stages in this process are pie, marketing, strategy, finance, percentage.
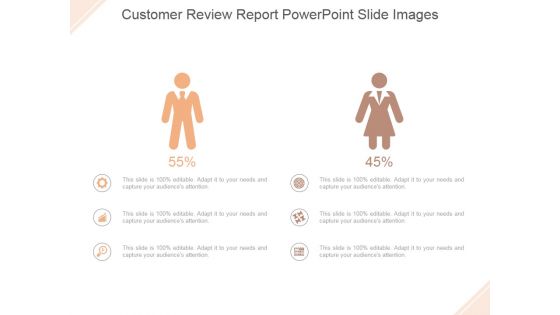
Customer Review Report Ppt PowerPoint Presentation Slide Download
This is a customer review report ppt powerpoint presentation slide download. This is a two stage process. The stage in this process are finance, percentage, icons, strategy, comparison.
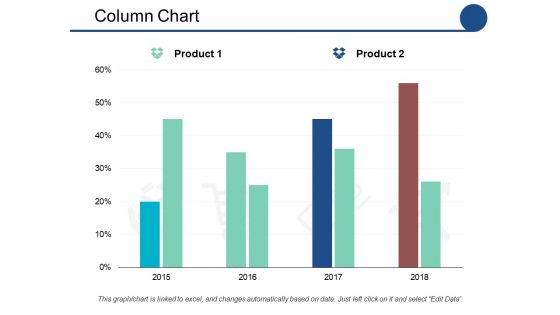
Column Chart Ppt PowerPoint Presentation Show Outfit
This is a column chart ppt powerpoint presentation show outfit. This is a two stage process. The stages in this process are product, percentage, marketing.
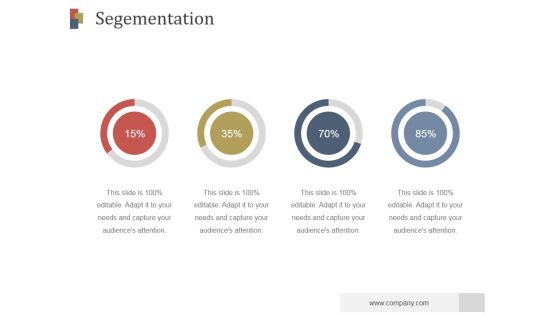
Segementation Ppt PowerPoint Presentation Visuals
This is a segementation ppt powerpoint presentation visuals. This is a four stage process. The stages in this process are marketing, business, finance, percentage, success.
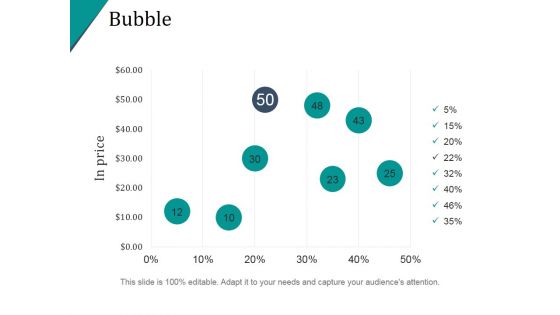
Bubble Ppt PowerPoint Presentation Show
This is a bubble ppt powerpoint presentation show. This is a six stage process. The stages in this process are finance, percentage, success, price, business.
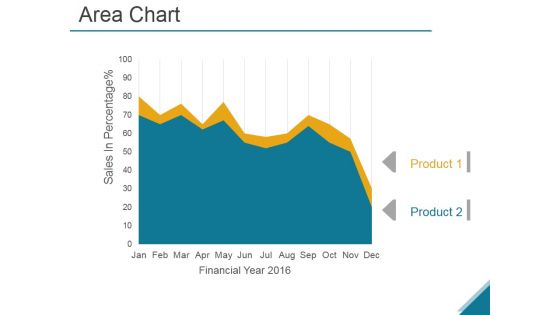
Area Chart Ppt PowerPoint Presentation Show
This is a area chart ppt powerpoint presentation show. This is a two stage process. The stages in this process are sales in percentage, business, marketing, analysis, success.

Dashboard Ppt PowerPoint Presentation Styles Format Ideas
This is a dashboard ppt powerpoint presentation styles format ideas. This is a four stage process. The stages in this process are percentage, process, success, business, marketing, dashboard.
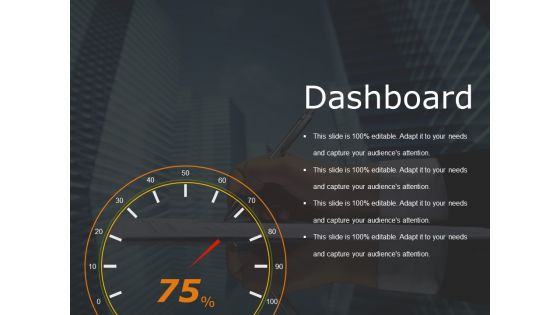
Dashboard Ppt PowerPoint Presentation Portfolio Designs Download
This is a dashboard ppt powerpoint presentation portfolio designs download. This is a one stage process. The stages in this process are dashboard, business, marketing, percentage, success.

Key Financial Analysis Powerpoint Slide Backgrounds
This is a key financial analysis powerpoint slide backgrounds. This is a four stage process. The stages in this process are business, marketing, success, finance, percentage.
Our Goals Ppt Powerpoint Presentation Icon Mockup
This is a our goals ppt powerpoint presentation icon mockup. This is a five stage process. The stages in this process are goal, marketing, success, percentage.
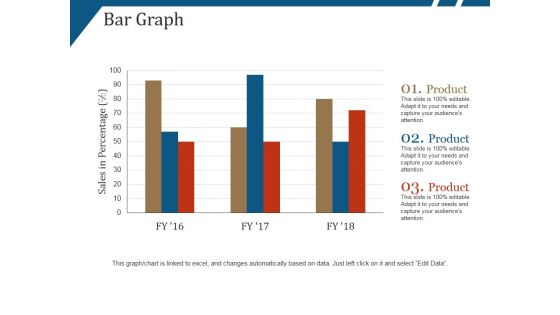
Bar Graph Ppt PowerPoint Presentation Gallery Inspiration
This is a bar graph ppt powerpoint presentation gallery inspiration. This is a three stage process. The stages in this process are product, sales in percentage, finance, success.
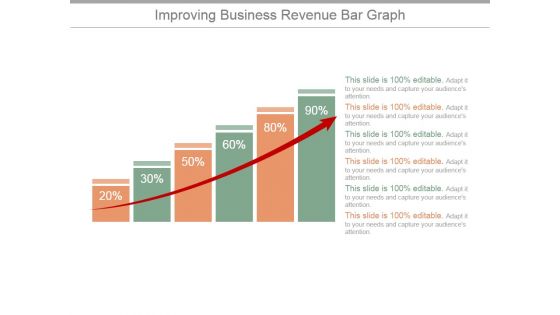
Improving Business Revenue Bar Graph Ppt PowerPoint Presentation Infographic Template
This is a improving business revenue bar graph ppt powerpoint presentation infographic template. This is a six stage process. The stages in this process are graph, arrow, finance, percentage, success.
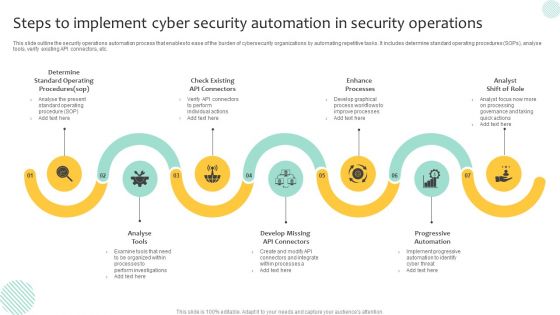
Steps To Implement Cyber Security Automation In Security Operations Demonstration PDF
This slide outline the security operations automation process that enables to ease of the burden of cybersecurity organizations by automating repetitive tasks. It includes determine standard operating procedures SOPs, analyse tools, verify existing API connectors, etc. Presenting Steps To Implement Cyber Security Automation In Security Operations Demonstration PDF to dispense important information. This template comprises seven stages. It also presents valuable insights into the topics including Progressive Automation, Enhance Processes, Analyse Tools. This is a completely customizable PowerPoint theme that can be put to use immediately. So, download it and address the topic impactfully.
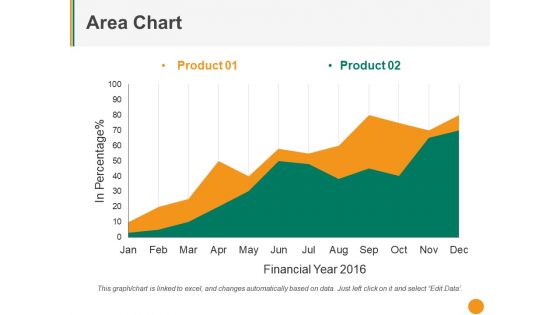
Area Chart Ppt PowerPoint Presentation File Graphic Tips
This is a area chart ppt powerpoint presentation file graphic tips. This is a two stage process. The stages in this process are product, in percentage, financial year, business, growth.

Stacked Line With Markers Ppt PowerPoint Presentation Inspiration Graphics Pictures
This is a stacked line with markers ppt powerpoint presentation inspiration graphics pictures. This is a one stage process. The stages in this process are in percentage, growth, business, marketing, chart.
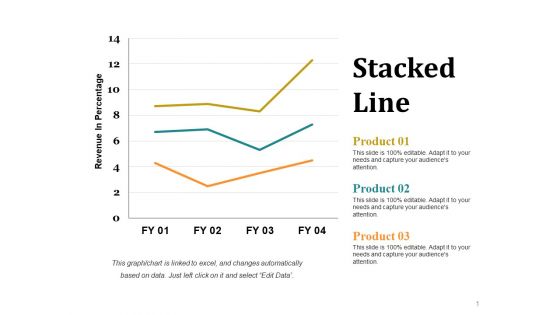
Stacked Line Ppt PowerPoint Presentation Portfolio Vector
This is a stacked line ppt powerpoint presentation portfolio vector. This is a three stage process. The stages in this process are revenue in percentage, business, marketing, growth, strategy.

 Home
Home