AI PPT Maker
Templates
PPT Bundles
Design Services
Business PPTs
Business Plan
Management
Strategy
Introduction PPT
Roadmap
Self Introduction
Timelines
Process
Marketing
Agenda
Technology
Medical
Startup Business Plan
Cyber Security
Dashboards
SWOT
Proposals
Education
Pitch Deck
Digital Marketing
KPIs
Project Management
Product Management
Artificial Intelligence
Target Market
Communication
Supply Chain
Google Slides
Research Services
 One Pagers
All Categories
-
Home
- Customer Favorites
- Percentage Growth
Percentage Growth

Consumer Journey Model With Key Marketing Tasks Ppt PowerPoint Presentation File Example Introduction PDF
Presenting consumer journey model with key marketing tasks ppt powerpoint presentation file example introduction pdf to dispense important information. This template comprises four stages. It also presents valuable insights into the topics including reach, convert, engage. This is a completely customizable PowerPoint theme that can be put to use immediately. So, download it and address the topic impactfully.

Our Mission Complete Guide On Marketing Communication Plan Elements PDF
Make sure to capture your audiences attention in your business displays with our gratis customizable Our Mission Complete Guide On Marketing Communication Plan Elements PDF. These are great for business strategies, office conferences, capital raising or task suggestions. If you desire to acquire more customers for your tech business and ensure they stay satisfied, create your own sales presentation with these plain slides.
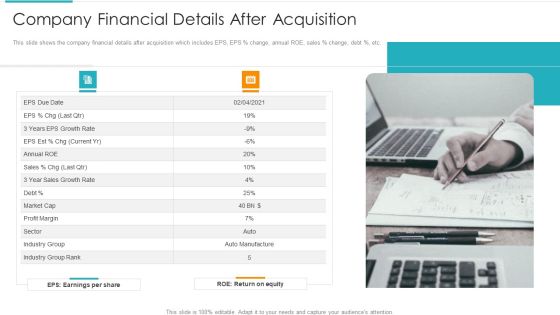
Inorganic Expansion Plan And Progression Company Financial Details After Acquisition Summary PDF
This slide shows the company financial details after acquisition which includes EPS, EPS percentage change, annual ROE, sales percentage change, debt percentage, etc. This is a inorganic expansion plan and progression company financial details after acquisition summary pdf template with various stages. Focus and dispense information on one stages using this creative set, that comes with editable features. It contains large content boxes to add your information on topics like sales, growth rate, profit margin, industry group rank, equity. You can also showcase facts, figures, and other relevant content using this PPT layout. Grab it now.

Lead Time Reduction Process Cycle Improvement Ppt PowerPoint Presentation Model Layout Ideas
Presenting this set of slides with name lead time reduction process cycle improvement ppt powerpoint presentation model layout ideas. This is a seven stage process. The stages in this process are understand the customers time bucket, study the supply profile, assess process capacity, develop a process map, study the customer demand profile, calculate current process task, identify waste that can be eliminated. This is a completely editable PowerPoint presentation and is available for immediate download. Download now and impress your audience.

Technology Automation Roadmap With Deep Learning Ppt PowerPoint Presentation Portfolio Infographics PDF
Presenting technology automation roadmap with deep learning ppt powerpoint presentation portfolio infographics pdf to dispense important information. This template comprises one stages. It also presents valuable insights into the topics including roadmap, strategy, task automation, intelligent automation, robotic process automation, optical character recognition, natural language processing, deep learning, technology choice. This is a completely customizable PowerPoint theme that can be put to use immediately. So, download it and address the topic impactfully.

6 Stages Of Leadership Coaching Plan With Key Priorities Ppt PowerPoint Presentation Gallery Infographics PDF
Following slide exhibits 6 stages of leadership and executive coaching plan. It includes multiple tasks such as- employee training and development, setting future objectives and training method for team members and so on. Presenting 6 stages of leadership coaching plan with key priorities ppt powerpoint presentation gallery infographics pdf to dispense important information. This template comprises six stages. It also presents valuable insights into the topics including stakeholder management, leadership, strategic role. This is a completely customizable PowerPoint theme that can be put to use immediately. So, download it and address the topic impactfully.

Annual Chronic Patients Change Linear Chart Demonstration PDF
The following slide highlights the percentage change of chronically ill patients. It shows the annual percentage change for the for a decade Showcasing this set of slides titled Annual Chronic Patients Change Linear Chart Demonstration PDF. The topics addressed in these templates are Key Observations, Annual Percentage, Linear Chart. All the content presented in this PPT design is completely editable. Download it and make adjustments in color, background, font etc. as per your unique business setting.

Facility Planning Management Workforce Productivity Dashboard Formats PDF
This slide showcase employees productivity driven by facility planning in organisation.it includes workforce productivity , organisation department , monthly productivity percentage and facility percentage. Showcasing this set of slides titled Facility Planning Management Workforce Productivity Dashboard Formats PDF. The topics addressed in these templates are Workforce Productivity, Work Productivity, Facility Percentage. All the content presented in this PPT design is completely editable. Download it and make adjustments in color, background, font etc. as per your unique business setting.

Employee Performance Information Chart Powerpoint Slides
This dashboard template contains employee picture with percentage slides. This dashboard PowerPoint template conveys employees performance in a visual manner. Download this PPT slide for quick decision-making.
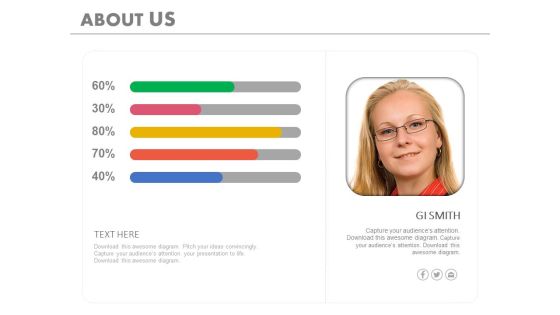
Overview Of Company Economic Analysis Powerpoint Slides
This PowerPoint template has been designed with employee picture and percentage tags. Download this PPT slide to depict company?s economic analysis. Make impressive presentation using this slide design.
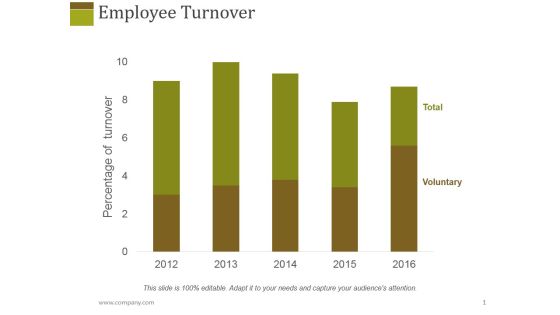
Employee Turnover Ppt PowerPoint Presentation Show Layouts
This is a employee turnover ppt powerpoint presentation show layouts. This is a five stage process. The stages in this process are total, voluntary, percentage of turnover, finance.
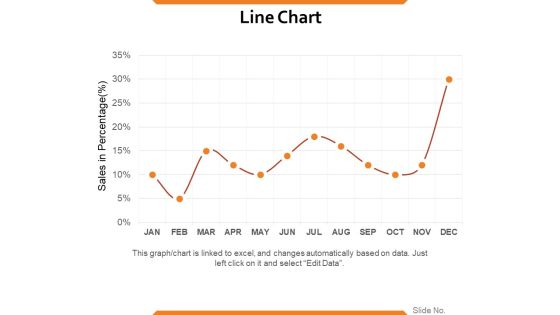
Line Chart Ppt PowerPoint Presentation Summary Samples
This is a line chart ppt powerpoint presentation summary samples. This is a one stage process. The stages in this process are sales in percentage, percentage, business, marketing, strategy.

Line Chart Ppt PowerPoint Presentation Portfolio Design Templates
This is a line chart ppt powerpoint presentation portfolio design templates. This is a two stage process. The stages in this process are in percentage, in years, percentage, business, graph.

Bar Graph Ppt PowerPoint Presentation Deck
This is a bar graph ppt powerpoint presentation deck. This is a five stage process. The stages in this process are percentage, process, strategy, success, marketing.

Area Chart Ppt PowerPoint Presentation Infographics
This is a area chart ppt powerpoint presentation infographics. This is a one stage process. The stages in this process are sales in percentage, jan, feb, mar, apr.

Bar Graph Ppt PowerPoint Presentation Pictures Display
This is a bar graph ppt powerpoint presentation pictures display. This is a one stage process. The stages in this process are sales in percentage, financial year.

Scatter Chart Ppt PowerPoint Presentation Slides
This is a scatter chart ppt powerpoint presentation slides. This is a five stage process. The stages in this process are product, in dollars, in percentage.

Line Chart Ppt PowerPoint Presentation Example
This is a line chart ppt powerpoint presentation example. This is a two stage process. The stages in this process are product, in percentage, business, marketing.

Stacked Line Ppt PowerPoint Presentation File Show
This is a stacked line ppt powerpoint presentation file show. This is a three stage process. The stages in this process are revenue in percentage, product.

Area Chart Ppt PowerPoint Presentation Summary Example
This is a area chart ppt powerpoint presentation summary example. This is a two stage process. The stages in this process are financial year, in percentage, product.

Line Chart Ppt PowerPoint Presentation Layouts Background Image
This is a line chart ppt powerpoint presentation layouts background image. This is a two stage process. The stages in this process are in percentage, in years, product.

Area Chart Ppt PowerPoint Presentation Inspiration Aids
This is a area chart ppt powerpoint presentation inspiration aids. This is a two stage process. The stages in this process are in percentage, product, business, marketing, strategy.
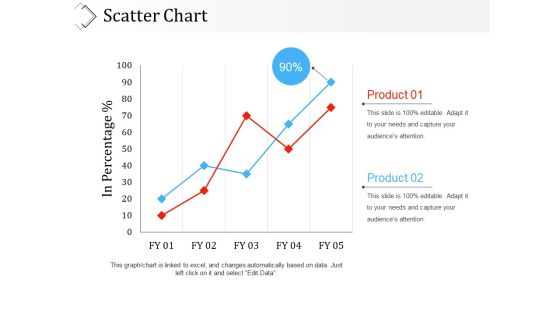
Scatter Chart Ppt PowerPoint Presentation Outline Picture
This is a scatter chart ppt powerpoint presentation outline picture. This is a two stage process. The stages in this process are in percentage, business, marketing, product, graph.

Line Chart Ppt PowerPoint Presentation Styles Introduction
This is a line chart ppt powerpoint presentation styles introduction. This is a two stage process. The stages in this process are in percentage, product, chart, business, marketing.

Column Chart Ppt PowerPoint Presentation Styles Background Image
This is a column chart ppt powerpoint presentation styles background image. This is a two stage process. The stages in this process are business, graph, percentage, marketing, strategy.

Area Chart Ppt PowerPoint Presentation Outline Graphics Download
This is a area chart ppt powerpoint presentation outline graphics download. This is a two stage process. The stages in this process are chart, percentage, business, marketing, strategy.

Combo Chart Ppt PowerPoint Presentation File Example
This is a combo chart ppt powerpoint presentation file example. This is a three stage process. The stages in this process are product, percentage, marketing, business, management.

Combo Chart Product Ppt PowerPoint Presentation Ideas Styles
This is a combo chart product ppt powerpoint presentation ideas styles. This is a three stage process. The stages in this process are business, management, marketing, percentage, product.

3d Circular Layout Diagram 5 Stages Network Marketing Business Plan PowerPoint Slides
We present our 3d circular layout diagram 5 stages network marketing business plan PowerPoint Slides.Download and present our Process and Flows PowerPoint Templates because You should Bet on your luck with our PowerPoint Templates and Slides. Be assured that you will hit the jackpot. Present our Flow Charts PowerPoint Templates because You can safely bank on our PowerPoint Templates and Slides. They will provide a growth factor to your valuable thoughts. Download and present our Ring Charts PowerPoint Templates because Our PowerPoint Templates and Slides will let your team Walk through your plans. See their energy levels rise as you show them the way. Present our Marketing PowerPoint Templates because Our PowerPoint Templates and Slides help you meet the demand of the Market. Just browse and pick the slides that appeal to your intuitive senses. Download our Success PowerPoint Templates because you can Add colour to your speech with our PowerPoint Templates and Slides. Your presentation will leave your audience speechless.Use these PowerPoint slides for presentations relating to Account, accounting, analyzing, business, calculate, chart, circle, concept, data, diagram, display, division, economy, five, finance, financial, graph, graphic, growth, illustration, information, market, marketing, part, partition, percentage, performance, pie, piece, planning, portion,presentation, profit, progress, report, round, sales, shape, slice, statistic, stock, success, survey, symbol, wealth. The prominent colors used in the PowerPoint template are Purple, Green lime, Blue light.
Scatter Line Ppt PowerPoint Presentation Icon Picture
This is a scatter line ppt powerpoint presentation icon picture. This is a nine stage process. The stages in this process are dollar in billions, sales in percentage, finance, management.

Line Chart Ppt PowerPoint Presentation Model Design Templates
This is a line chart ppt powerpoint presentation model design templates. This is a two stage process. The stages in this process are sales in percentage, financial years, product.

Combo Chart Ppt PowerPoint Presentation Summary Layouts
This is a combo chart ppt powerpoint presentation summary layouts. This is a eight stage process. The stages in this process are product, sales in percentage, in years, in price, graph.
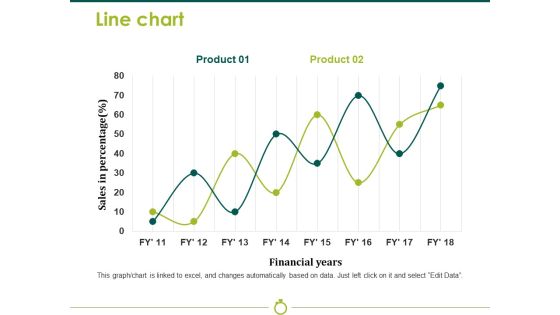
Line Chart Template 2 Ppt PowerPoint Presentation Model Background Image
This is a line chart template 2 ppt powerpoint presentation model background image. This is a two stage process. The stages in this process are sales in percentage, financial years, business, marketing, strategy, graph.

Column Chart Ppt PowerPoint Presentation Outline Styles
This is a column chart ppt powerpoint presentation outline styles. This is a two stage process. The stages in this process are sales in percentage, financial year in, business, marketing, graph.
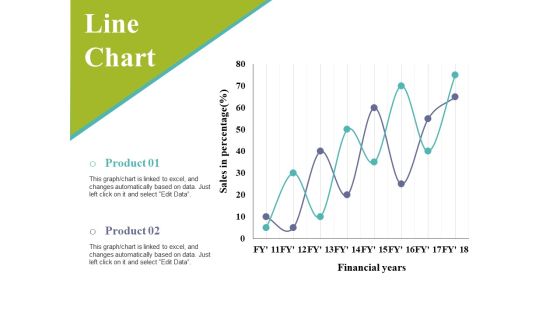
Line Chart Ppt PowerPoint Presentation Infographic Template Slides
This is a line chart ppt powerpoint presentation infographic template slides. This is a two stage process. The stages in this process are sales in percentage, financial years, business, marketing, graph.

Line Chart Ppt PowerPoint Presentation Styles Themes
This is a line chart ppt powerpoint presentation styles themes. This is a two stage process. The stages in this process are business, marketing, financial years, sales in percentage.
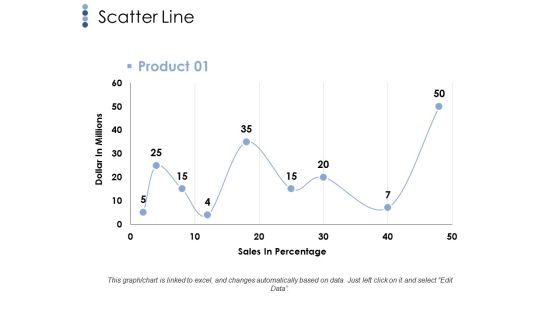
Scatter Line Ppt PowerPoint Presentation File Infographics
This is a scatter line ppt powerpoint presentation file infographics. This is a one stage process. The stages in this process are scatter line, dollar in millions, sales in percentage, business.
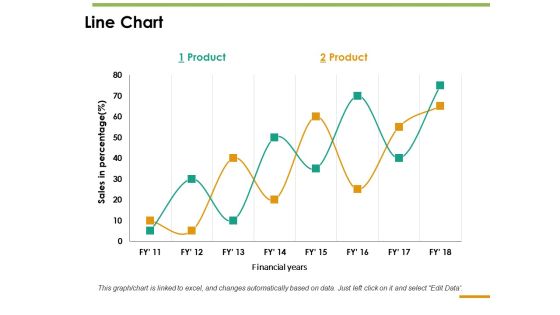
Line Chart Ppt PowerPoint Presentation Inspiration Guide
This is a line chart ppt powerpoint presentation inspiration guide. This is a two stage process. The stages in this process are line chart, sales in percentage, product, financial years.
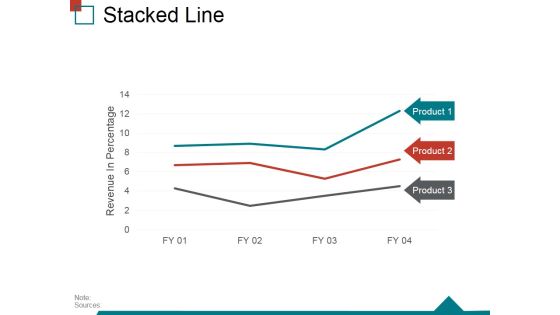
Stacked Line Ppt PowerPoint Presentation Ideas Summary
This is a stacked line ppt powerpoint presentation ideas summary. This is a three stage process. The stages in this process are revenue in percentage, stacked line, business, marketing, success.

Crm Dashboard Deals By Expected Close Date Ppt PowerPoint Presentation Show Information
This is a crm dashboard deals by expected close date ppt powerpoint presentation show information. This is a three stage process. The stages in this process are deals by expected close date, percentage, business, finance, success.

Area Chart Ppt PowerPoint Presentation Topics
This is a area chart ppt powerpoint presentation topics. This is a two stage process. The stages in this process are product, in percentage, jan, feb, mar, apr, may.

Column Chart Ppt PowerPoint Presentation Show
This is a column chart ppt powerpoint presentation show. This is a six stage process. The stages in this process are product, in percentage, jan, feb, mar, apr, may.
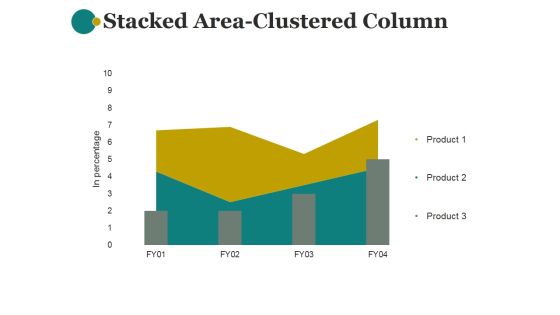
Stacked Area Clustered Column Ppt PowerPoint Presentation Layout
This is a stacked area clustered column ppt powerpoint presentation layout. This is a two stage process. The stages in this process are in percentage, product, business, marketing, management.
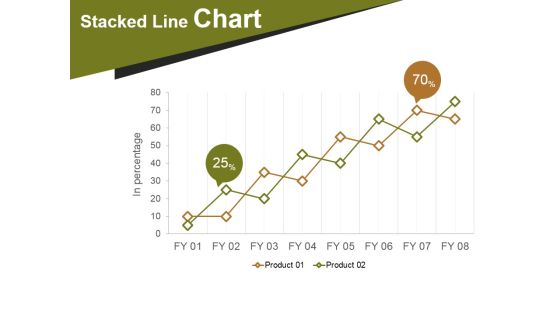
Stacked Line Chart Template 2 Ppt PowerPoint Presentation Rules
This is a stacked line chart template 2 ppt powerpoint presentation rules. This is a two stage process. The stages in this process are stacked line chart, in percentage, product.

Area Chart Ppt PowerPoint Presentation Professional Designs
This is a area chart ppt powerpoint presentation professional designs. This is a two stage process. The stages in this process are in percentage, product, in years, strategy, business, marketing.

Line Chart Ppt PowerPoint Presentation Layouts Professional
This is a line chart ppt powerpoint presentation layouts professional. This is a two stage process. The stages in this process are in percentage, product, in years, strategy, marketing, business.

Stacked Line Ppt PowerPoint Presentation Summary File Formats
This is a stacked line ppt powerpoint presentation summary file formats. This is a three stage process. The stages in this process are product, revenue in percentage, strategy, business, marketing.

Combo Chart Ppt PowerPoint Presentation Infographics Introduction
This is a combo chart ppt powerpoint presentation infographics introduction. This is a three stage process. The stages in this process are profit in percentage, business, graph, strategy, product.
Scatter Chart Ppt PowerPoint Presentation Professional Icons
This is a scatter chart ppt powerpoint presentation professional icons. This is a six stage process. The stages in this process are in dollars, in percentage, graph, business, marketing.

Line Chart Ppt PowerPoint Presentation Show Background Designs
This is a line chart ppt powerpoint presentation show background designs. This is a two stage process. The stages in this process are product, in months, in percentage, business.

Clustered Column Line Ppt PowerPoint Presentation Inspiration Layouts
This is a clustered column line ppt powerpoint presentation inspiration layouts. This is a four stage process. The stages in this process are in percentage, product, business, strategy, graph.
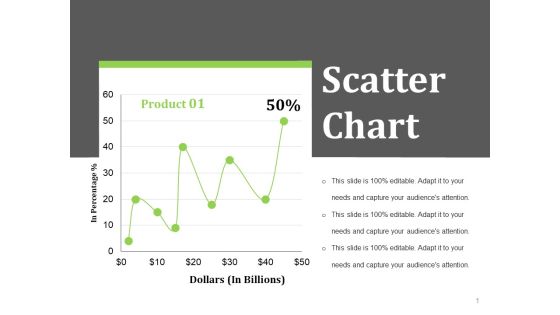
Scatter Chart Ppt PowerPoint Presentation Styles Layout Ideas
This is a scatter chart ppt powerpoint presentation styles layout ideas. This is a one stage process. The stages in this process are dollars in billions, in percentage, business, finance.

Stacked Area Clustered Column Ppt PowerPoint Presentation Pictures Brochure
This is a stacked area clustered column ppt powerpoint presentation pictures brochure. This is a three stage process. The stages in this process are in percentage, business, marketing, graph, strategy.
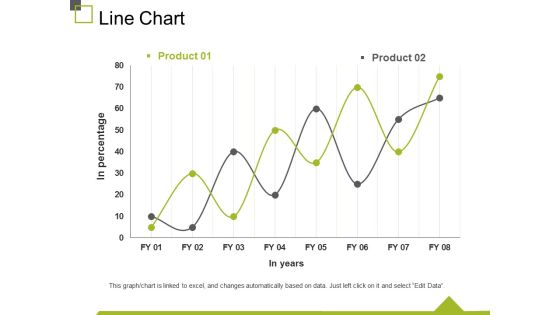
Line Chart Ppt PowerPoint Presentation Infographics Display
This is a line chart ppt powerpoint presentation infographics display. This is a two stage process. The stages in this process are in percentage, in years, chart, business, marketing.

Most Effective Media Channels Ppt PowerPoint Presentation Model Graphic Images
This is a most effective media channels ppt powerpoint presentation model graphic images. This is a nine stage process. The stages in this process are business, management, marketing, percentage, product.
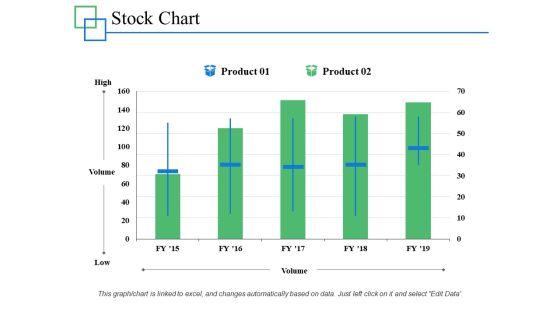
Stock Chart Management Investment Ppt PowerPoint Presentation Infographics Professional
This is a stock chart management investment ppt powerpoint presentation infographics professional. This is a two stage process. The stages in this process are marketing, business, management, percentage, product.

Column Chart Finance Marketing Ppt PowerPoint Presentation Model Example Introduction
This is a column chart finance marketing ppt powerpoint presentation model example introduction. This is a two stage process. The stages in this process are business, management, marketing, percentage, product.
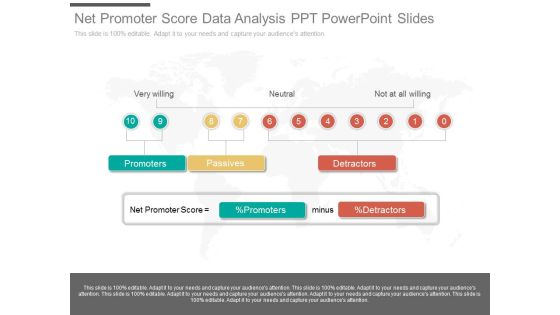
Net Promoter Score Data Analysis Ppt Powerpoint Slides
This is a net promoter score data analysis ppt powerpoint slides. This is a ten stage process. The stages in this process are very willing, neutral, not at all willing, promoters, passives, detractors, net promoter score, percentage promoters, minus, percentage detractors.

Net Promoter Score Methodology Ppt Powerpoint Guide
This is a net promoter score methodology ppt powerpoint guide. This is a ten stage process. The stages in this process are survey your customers, detractor, neutral, promoters, calculate your score, tally responses, net promoter score percentage of promoters percentage of detractors.

Asset Allocation Decision Sample Of Ppt
This is a asset allocation decision sample of ppt. This is a four stage process. The stages in this process are u s stocks, cash, intl stocks, intl bonds, u s bonds, alternatives, class, percentage total, 1 day percentage, value, grand total.

Business Capital Management Example Of Ppt Presentation
This is a business capital management example of ppt presentation. This is a four stage process. The stages in this process are u s stocks, cash, intl stocks, intl bonds, u s bonds, alternatives, class, percentage total, 1 day percentage, value, grand total.

PMO Dashboard With Strategy And Delivery KPI Elements PDF
Presenting PMO Dashboard With Strategy And Delivery KPI Elements PDF to dispense important information. This template comprises three stages. It also presents valuable insights into the topics including Percentage Of Projects, Organization Objectives, Percentage Of Projects This is a completely customizable PowerPoint theme that can be put to use immediately. So, download it and address the topic impactfully.

Gantt Chart Showing Critical And Flexible Task Planning Ppt PowerPoint Presentation Model Shapes
This is a gantt chart showing critical and flexible task planning ppt powerpoint presentation model shapes. The topics discussed in this diagram are critical path method, critical path analysis, cpm. This is a completely editable PowerPoint presentation, and is available for immediate download.
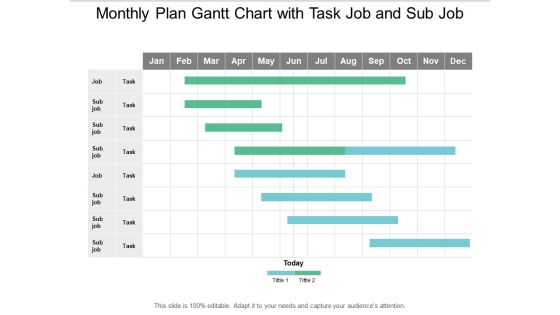
Monthly Plan Gantt Chart With Task Job And Sub Job Ppt PowerPoint Presentation Infographic Template Mockup
This is a monthly plan gantt chart with task job and sub job ppt powerpoint presentation infographic template mockup. The topics discussed in this diagram are critical path method, critical path analysis, cpm. This is a completely editable PowerPoint presentation, and is available for immediate download.

10 Stages Chart Implementation Of Donut Diagram Ppt Need Business Plan PowerPoint Templates
We present our 10 stages chart implementation of donut diagram ppt need business plan PowerPoint templates.Download and present our Communication PowerPoint Templates because Our PowerPoint Templates and Slides will let your team Walk through your plans. See their energy levels rise as you show them the way. Use our Advertising PowerPoint Templates because You can safely bank on our PowerPoint Templates and Slides. They will provide a growth factor to your valuable thoughts. Present our Circle Charts PowerPoint Templates because It can Conjure up grand ideas with our magical PowerPoint Templates and Slides. Leave everyone awestruck by the end of your presentation. Download our Business PowerPoint Templates because It is Aesthetically crafted by artistic young minds. Our PowerPoint Templates and Slides are designed to display your dexterity. Download our Shapes PowerPoint Templates because Watching this your Audience will Grab their eyeballs, they wont even blink.Use these PowerPoint slides for presentations relating to Chart, business, donut, market, sales, document, economy, display, corporate, income, concept, success, presentation, symbol, diagram, percentage, graphic, finance, analysis, report, marketing, accounting, management, graph, forecast, design, growth, competition, progress, profit, information, trade, investment, statistic, financial, infographics, 3d. The prominent colors used in the PowerPoint template are Green, White, Blue.
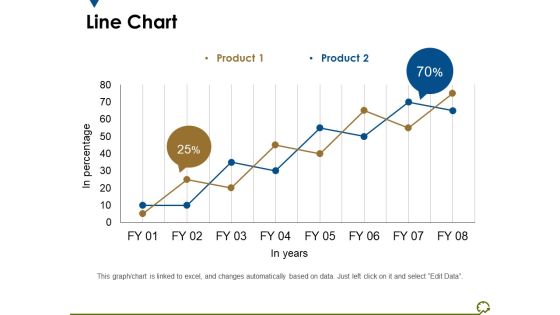
Line Chart Ppt PowerPoint Presentation Outline Diagrams
This is a line chart ppt powerpoint presentation outline diagrams. This is a two stage process. The stages in this process are in percentage, in years, percentage, business, marketing.

Key HR Service Delivery Statistics On A Global Scal Portrait PDF
This slide shows the some of the key HR Service Delivery Statistics on a Global Scale such as percentage of companies that are that are expected to perform better due to ethnic diversity, percentage of employees whose loyalty will increase to additional paid time, increase in annual growth rate due to more employee engagement programs etc. Deliver and pitch your topic in the best possible manner with this Key HR Service Delivery Statistics On A Global Scal Portrait PDF. Use them to share invaluable insights on Produce Better, Employee Engagement, Employee Termination and impress your audience. This template can be altered and modified as per your expectations. So, grab it now.

Area Chart Ppt PowerPoint Presentation Model Guidelines
This is a area chart ppt powerpoint presentation model guidelines. This is a two stage process. The stages in this process are product, area chart, sales in percentage.

Enhancing Stp Strategies For A Successful Market Promotion Global Technology Market Template PDF
Following slide displays the growth projections of global technology market. It shows that the tech market is estimated to from 4 percentage to 5.5 percentage in the year 2021. Presenting enhancing stp strategies for a successful market promotion global technology market template pdf to provide visual cues and insights. Share and navigate important information on one stages that need your due attention. This template can be used to pitch topics like global, technology, market. In addtion, this PPT design contains high resolution images, graphics, etc, that are easily editable and available for immediate download.
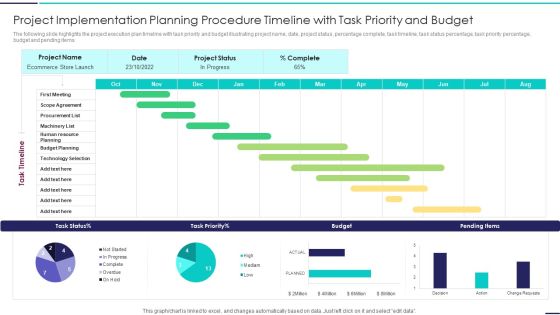
Project Implementation Planning Procedure Timeline With Task Priority And Budget Guidelines PDF
The following slide highlights the project execution plan timeline with task priority and budget illustrating project name, date, project status, percentage complete, task timeline, task status percentage, task priority percentage, budget and pending items. Showcasing this set of slides titled Project Implementation Planning Procedure Timeline With Task Priority And Budget Guidelines PDF. The topics addressed in these templates are Project Implementation Planning Procedure Timeline With Task Priority And Budget. All the content presented in this PPT design is completely editable. Download it and make adjustments in color, background, font etc. as per your unique business setting.
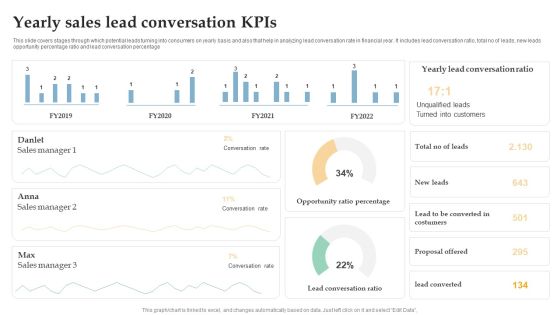
Yearly Sales Lead Conversation Kpis Ppt Inspiration Brochure PDF
This slide covers stages through which potential leads turning into consumers on yearly basis and also that help in analyzing lead conversation rate in financial year. It includes lead conversation ratio, total no of leads, new leads opportunity percentage ratio and lead conversation percentage. Pitch your topic with ease and precision using this Yearly Sales Lead Conversation Kpis Ppt Inspiration Brochure PDF. This layout presents information on Sales Manager, Conversation Rate, Opportunity Ratio Percentage. It is also available for immediate download and adjustment. So, changes can be made in the color, design, graphics or any other component to create a unique layout.
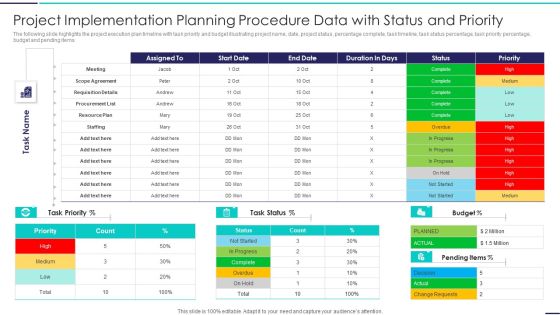
Project Implementation Planning Procedure Data With Status And Priority Demonstration PDF
The following slide highlights the project execution plan timeline with task priority and budget illustrating project name, date, project status, percentage complete, task timeline, task status percentage, task priority percentage, budget and pending items. Showcasing this set of slides titled Project Implementation Planning Procedure Data With Status And Priority Demonstration PDF. The topics addressed in these templates are Project Implementation Planning Procedure Data With Status And Priority. All the content presented in this PPT design is completely editable. Download it and make adjustments in color, background, font etc. as per your unique business setting.

Software Development Project Issues Performance Monitoring Dashboard Structure PDF
This slide represents the dashboard showing software development project issues faced by the clients for the purpose of its monitoring and controlling by the IT department. It shows downtime issues, count and percentage of unsolved tickets etc. related to the project.Showcasing this set of slides titled Software Development Project Issues Performance Monitoring Dashboard Structure PDF. The topics addressed in these templates are Downtime Issues, Count Percentage, Unsolved Percentage. All the content presented in this PPT design is completely editable. Download it and make adjustments in color, background, font etc. as per your unique business setting.

Coronavirus Cases And Deaths Update By Age Group Icons PDF
Following slide provides information regarding distribution of confirmed coronavirus cases and deaths which government uses to take necessary measure in containing virus outspread. Percentage of confirmed cases and deaths are demonstrated in this slide. Showcasing this set of slides titled Coronavirus Cases And Deaths Update By Age Group Icons PDF. The topics addressed in these templates are Highest Percentage, Age Group, Least Percentage. All the content presented in this PPT design is completely editable. Download it and make adjustments in color, background, font etc. as per your unique business setting.
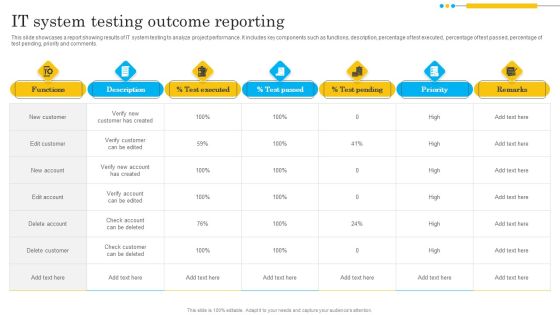
IT System Testing Outcome Reporting Formats PDF
This slide showcases a report showing results of IT system testing to analyze project performance. It includes key components such as functions, description, percentage of test executed, percentage of test passed, percentage of test pending, priority and comments. Showcasing this set of slides titled IT System Testing Outcome Reporting Formats PDF. The topics addressed in these templates are Verify Customer Created, Check Account, Check Customer. All the content presented in this PPT design is completely editable. Download it and make adjustments in color, background, font etc. as per your unique business setting.

Area Chart Ppt PowerPoint Presentation Samples
This is a area chart ppt powerpoint presentation samples. This is a two stage process. The stages in this process are financial year, sales in percentage, jan, feb.

Clustered Column Line Ppt PowerPoint Presentation Backgrounds
This is a clustered column line ppt powerpoint presentation backgrounds. This is a four stage process. The stages in this process are fire, earthquake, axis title, in percentage.

Staked Line Chart Ppt PowerPoint Presentation Topics
This is a staked line chart ppt powerpoint presentation topics. This is a two stage process. The stages in this process are in percentage, product.

Area Chart Ppt PowerPoint Presentation Professional
This is a area chart ppt powerpoint presentation professional. This is a one stage process. The stages in this process are product, in percentage, jan, feb, mar, apr.
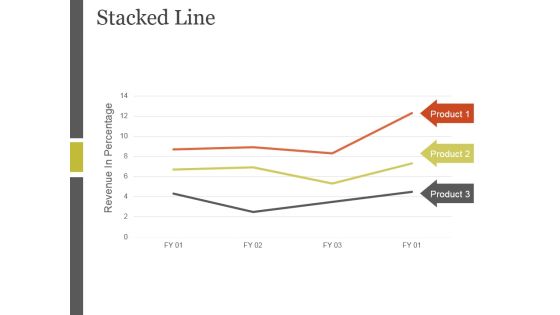
Stacked Line Ppt PowerPoint Presentation Inspiration
This is a stacked line ppt powerpoint presentation inspiration. This is a three stage process. The stages in this process are revenue in percentage, stacked line, product.

Area Chart Ppt PowerPoint Presentation Diagrams
This is a area chart ppt powerpoint presentation diagrams.This is a two stage process. The stages in this process are in percentage, area chart, product.

Area Chart Ppt PowerPoint Presentation Slides Graphics Design
This is a area chart ppt powerpoint presentation slides graphics design. This is a two stage process. The stages in this process are area chart, in percentage, product.

Line Chart Ppt PowerPoint Presentation Ideas Portfolio
This is a line chart ppt powerpoint presentation ideas portfolio. This is a two stage process. The stages in this process are line chart, in years, in percentage.
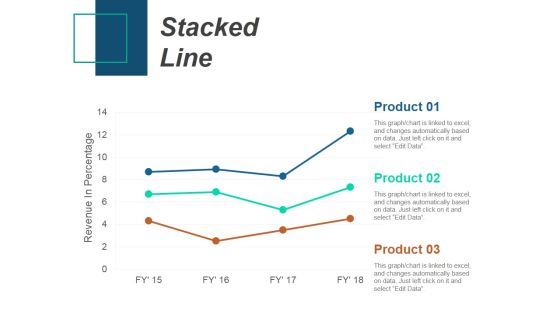
Stacked Line Ppt PowerPoint Presentation Infographics Slideshow
This is a stacked line ppt powerpoint presentation infographics slideshow. This is a three stage process. The stages in this process are stacked line, revenue in percentage, product.
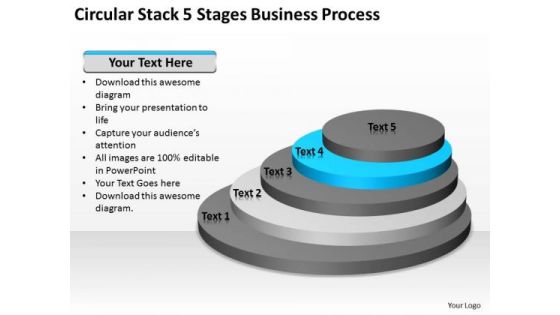
Circular Stack 5 Stages Business Process Ppt What Is Planning PowerPoint Slides
We present our circular stack 5 stages business process ppt what is planning PowerPoint Slides.Use our Process and Flows PowerPoint Templates because Our PowerPoint Templates and Slides are effectively colour coded to prioritise your plans They automatically highlight the sequence of events you desire. Present our Flow Charts PowerPoint Templates because Our PowerPoint Templates and Slides will provide the perfect balance. Your weighty ideas will get the ideal impetus. Download our Circle Charts PowerPoint Templates because Our PowerPoint Templates and Slides will weave a web of your great ideas. They are gauranteed to attract even the most critical of your colleagues. Download and present our Shapes PowerPoint Templates because you can Add colour to your speech with our PowerPoint Templates and Slides. Your presentation will leave your audience speechless. Download our Business PowerPoint Templates because Our PowerPoint Templates and Slides are Clear and concise. Use them and dispel any doubts your team may have.Use these PowerPoint slides for presentations relating to Graph, pyramid, circle, diagram, segment,business, graphic, web, percent, economics, slice, isometric, concept, success, internet, commercial, circle, percentage, finance, report, modern, illustration, strategy, collection, design, growth, profit, commerce, banking, financial, communication. The prominent colors used in the PowerPoint template are Blue, Gray, White.
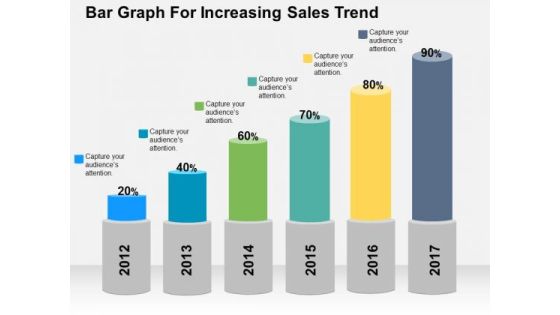
Bar Graph For Increasing Sales Trend PowerPoint Template
Deliver amazing presentations with our above template showing bar graph with percentage values. You may download this slide to depict increase in sales trends. Capture the attention of your audience using this diagram.

Clustered Column Line Ppt PowerPoint Presentation Infographic Template Deck
This is a clustered column line ppt powerpoint presentation infographic template deck. This is a three stage process. The stages in this process are business, strategy, analysis, planning, sales in percentage, financial year.

Area Chart Ppt PowerPoint Presentation Icon Layout Ideas
This is a area chart ppt powerpoint presentation icon layout ideas. This is a two stage process. The stages in this process are area chart, sales in percentage, years, planning, business.

Bar Chart Ppt PowerPoint Presentation Infographic Template Skills
This is a bar chart ppt powerpoint presentation infographic template skills. This is a nine stage process. The stages in this process are sales in percentage, finance, business, marketing, strategy, success.
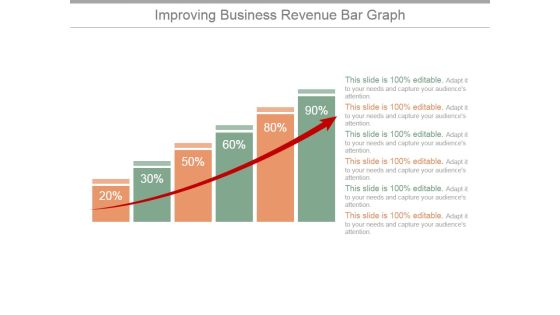
Improving Business Revenue Bar Graph Ppt PowerPoint Presentation Infographic Template
This is a improving business revenue bar graph ppt powerpoint presentation infographic template. This is a six stage process. The stages in this process are graph, arrow, finance, percentage, success.

Combo Chart Ppt PowerPoint Presentation Shapes
This is a combo chart ppt powerpoint presentation shapes. This is a eight stage process. The stages in this process are combo chart, business, marketing, sales in percentage, bar graph.

Bar Graph Ppt PowerPoint Presentation Visual Aids Model
This is a bar graph ppt powerpoint presentation visual aids model. This is a three stage process. The stages in this process are business, strategy, analysis, planning, sales in percentage.

Column Chart Ppt PowerPoint Presentation Gallery Design Inspiration
This is a column chart ppt powerpoint presentation gallery design inspiration. This is a two stage process. The stages in this process are column chart, product, sales in percentage, financial years.

Area Chart Ppt PowerPoint Presentation Styles Images
This is a area chart ppt powerpoint presentation styles images. This is a two stage process. The stages in this process are sales in percentage, product, graph, business, marketing.
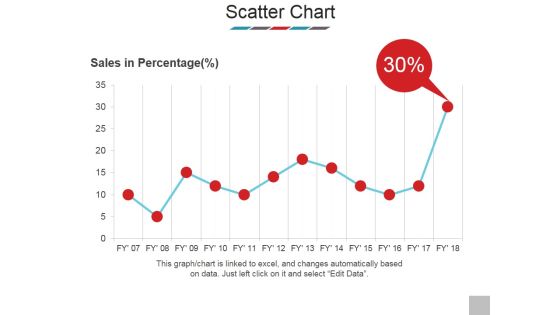
Scatter Chart Ppt PowerPoint Presentation Model Show
This is a scatter chart ppt powerpoint presentation model show. This is a one stage process. The stages in this process are sales in percentage, scatter chart, business, bar graph, marketing.

Area Chart Ppt PowerPoint Presentation Inspiration Themes
This is a area chart ppt powerpoint presentation inspiration themes. This is a two stage process. The stages in this process are sales in percentage, product, area chart, business, marketing.

Area Chart Financial Ppt PowerPoint Presentation Outline Professional
This is a area chart financial ppt powerpoint presentation outline professional. This is a four stage process. The stages in this process are product, sales in percentage, financial year.
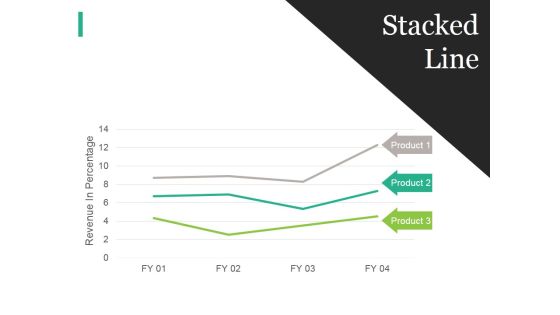
Stacked Line Ppt PowerPoint Presentation File Display
This is a stacked line ppt powerpoint presentation file display. This is a three stage process. The stages in this process are business, strategy, marketing, analysis, revenue in percentage, stacked line.

Real Estate Home Price Index Ppt PowerPoint Presentation Samples
This is a real estate home price index ppt powerpoint presentation samples. This is a one stage process. The stages in this process are in percentage, business, bar graph, marketing, success, management.
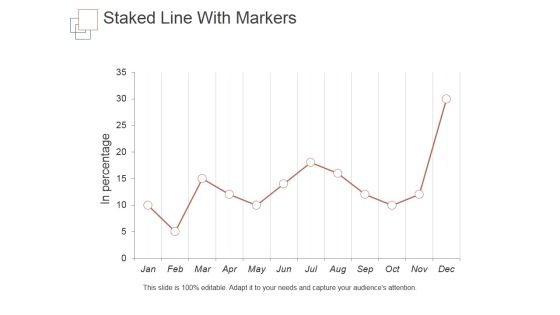
Staked Line With Markers Ppt PowerPoint Presentation Introduction
This is a staked line with markers ppt powerpoint presentation introduction. This is a one stage process. The stages in this process are in percentage, business, marketing, success, management.

Stacked Area Clustered Column Ppt PowerPoint Presentation Clipart
This is a stacked area clustered column ppt powerpoint presentation clipart. This is a four stage process. The stages in this process are in percentage, stacked area clustered column, product.

Stacked Line Ppt PowerPoint Presentation Summary Master Slide
This is a stacked line ppt powerpoint presentation summary master slide. This is a three stage process. The stages in this process are revenue in percentage, stacked line, product.

Scatter Chart Ppt PowerPoint Presentation Show Graphic Images
This is a scatter chart ppt powerpoint presentation show graphic images. This is a one stage process. The stages in this process are in percentage, in billions, scatter chart.

Line Chart Ppt PowerPoint Presentation Summary Graphic Tips
This is a line chart ppt powerpoint presentation summary graphic tips. This is a two stage process. The stages in this process are line chart, product, in percentage, analysis, business.
Business Diagram Boxes With Icons For Progress Presentation Template
Concept of currency output has been displayed with suitable icons given in this diagram. This diagram contains the graphic of four text boxes and percentage symbol. Use this template to highlight the key issues of your presentation.

Dashboard With Increasing Values Powerpoint Slides
This innovative, stunningly beautiful dashboard has been designed for data visualization. It contains pie charts with increasing percentage values. This PowerPoint template helps to display your information in a useful, simple and uncluttered way.
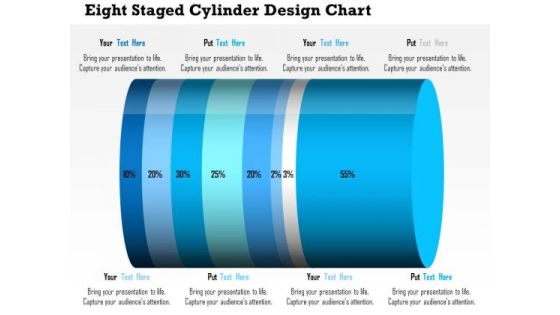
Business Daigram Eight Staged Cylinder Design Chart Presentation Templets
This business diagram contains eight staged cylinder design chart with percentage ratio. Download this diagram to display financial analysis. Use this diagram to make business and marketing related presentations.
Quality Cost Report Ppt PowerPoint Presentation Icon Information
This is a quality cost report ppt powerpoint presentation icon information. This is a three stage process. The stages in this process are types of cost, quality cost, percentage of sales, prevention cost business.

Stock Photo Pyramid Of Balls With Percent Symbols Pwerpoint Slide
This image has been crafted for displaying the concept of discount and leadership. This image contains the graphic of metal balls with percentage symbol on each ball. Use this image and build a unique presentation for business and marketing topics.

Rich Diversity And Inclusion Benefits Business Training Ppt
This slide provides five major quantitative figures to prove that rich D and I indeed means good business. The most powerful, example, perhaps, is that diverse and inclusive businesses capture new markets 70 percentage more successfully.

Social Media For Human Resources Powerpoint Slide Deck
This is a social media for human resources powerpoint slide deck. This is a four stage process. The stages in this process are cooperative advertising, manufacturer reimburse retailer for ad expanses, based on a percentage sales to retailer, ad allowances.
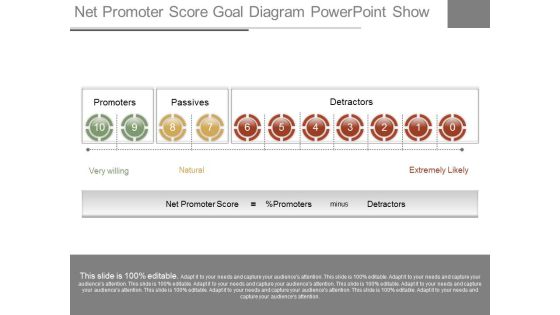
Net Promoter Score Goal Diagram Powerpoint Show
This is a net promoter score goal diagram powerpoint show. This is a ten stage process. The stages in this process are promoters, passives, detractors, very willing, natural, extremely likely, net promoter score, percentage promoters, minus.
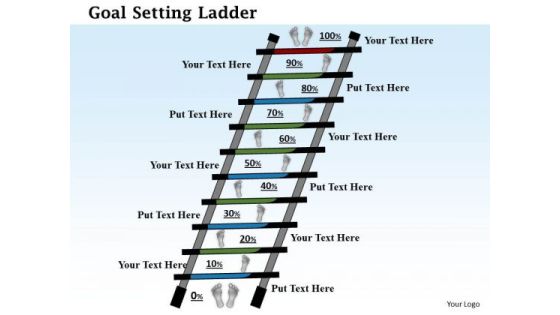
Business Framework Goal Setting Ladder PowerPoint Presentation
This image slide has been designed to express views on goals, targets and achievements. This image slide displays goal setting ladder with percentage steps. This image slide will enhance the quality of your presentations.
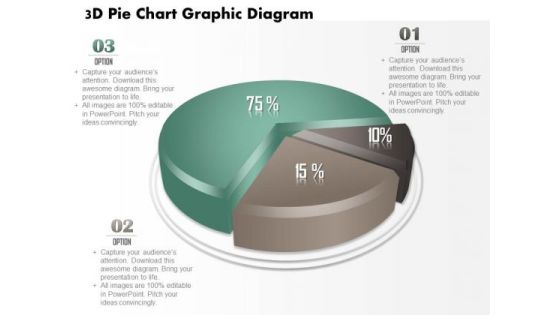
Business Diagram 3d Pie Chart Graphic Diagram PowerPoint Ppt Presentation
This business diagram displays 3d pie chart. It contains pie chart with percentage ratios. This pie chart is a visual way of displaying data. Use this diagram to make outstanding presentations.

Business Diagram Business Bar Graph For Data Analysis Presentation Template
This business slide displays pie charts with percentage ratios. This diagram is a data visualization tool that gives you a simple way to present statistical information. This slide helps your audience examines and interprets the data you present.

Business Framework 10 Percent To 90 Percent PowerPoint Presentation
This business diagram has been designed with graphic of multiple pie graphs. This diagram slide contains the concept of result analysis with percentage values. Use this diagram to present and compare data in an impressive manner

Business Diagram Diagram For Visual Data Display Presentation Template
Four colored cylindrical bars with percentage values are used to design this power point template. This diagram slide helps to display financial data analysis. Use this diagram for your business and finance related presentations.
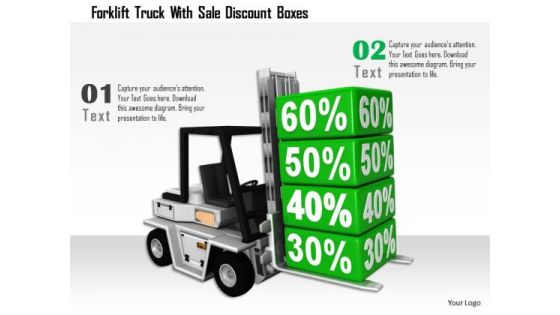
Stock Photo Forklift Truck With Sale Discount Boxes PowerPoint Slide
This image is designed with forklift truck with percentage box. It contains objects like delivery truck with boxes to make meaningful presentations. This is an excellent graphics to attract your viewers.

Business Diagram Circles For Accounting Equation PowerPoint Templates
Graphic of Venn diagram with percentage value has been used to design this business diagram. These circles may also be used to depict accounting equations. Use this diagram to illustrate your thoughts and experiences to your staff.

Bar Graph For Statistical Analysis Powerpoint Slides
This PowerPoint template has been designed with bar chart and percentage values. You may download this PPT slide to depict statistical analysis. Add this slide to your presentation and impress your superiors.
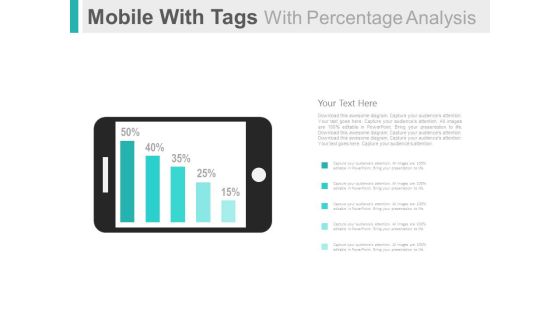
Mobile For Online Survey And Analysis Powerpoint Slides
This PowerPoint template has been designed with graphics of mobile and percentage bar graph. This PPT slide can be used to display online survey and analysis. You can download finance PowerPoint template to prepare awesome presentations.

Pie Chart For Customer Analysis Powerpoint Slides
This PowerPoint template has been designed with percentage ratio pie chart. This PPT slide can be used to display customer analysis. You can download finance PowerPoint template to prepare awesome presentations.

Bar Graph With Yearly Statistical Analysis Powerpoint Slides
This PowerPoint template contains diagram of bar graph with yearly percentage ratios. You may download this slide to display statistical analysis. You can easily customize this template to make it more unique as per your need.
Four Colored Text Boxes With Icons Powerpoint Slides
This PowerPoint template has been designed with graphics of four text boxes. Download this PPT slide to display percentage data display. Use this professional template to build an exclusive presentation.

Four Steps For Financial Data Analysis Powerpoint Slides
This PowerPoint contains four circles with percentage values. Download this diagram slide to display financial data analysis. This template is editable, You can edit text, color, shade and style of this diagram as per you need.
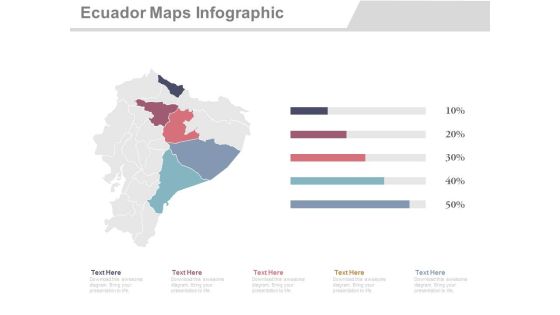
Ecuador Map With States Economic Analysis Powerpoint Slides
This PowerPoint template displays graphics of Ecuador map with different locations and percentage values. This Map template can be used in business presentations to depict economic analysis. This slide can also be used by school students for educational projects.

Business Partners About Us Slide Powerpoint Slides
The PowerPoint template has been designed with business men and percentage ratio. Use this PPT slide for business and partnership related topics. Explain your strategy to co-ordinate business activities.

Four Months Sales Statistics Chart Powerpoint Slides
This PowerPoint template has been designed with four shopping bags with percentage values. Download this PPT slide to display four months sales statistics. Add this slide to your presentation and impress your superiors.
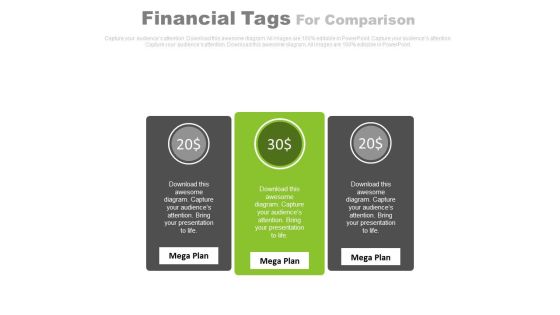
Three Text Tags Compare Chart Powerpoint Slides
This PowerPoint template has been designed with text tags and percentage data. You may download this PPT slide to display data comparison and analysis. Add this slide to your presentation and impress your superiors.
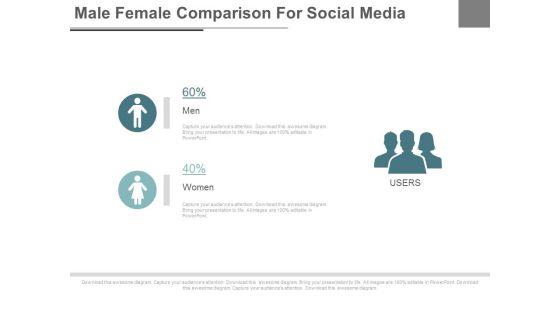
Male Female Social Media Users Powerpoint Slides
This PPT slide displays graphics of male female icons with percentage values. Use this PPT design to display male female ratios of social media users. This PowerPoint template can be customized as per requirements of business presentation.
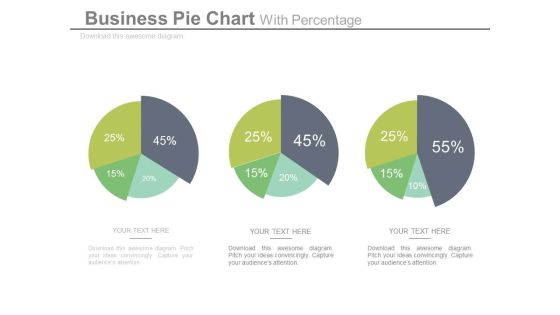
Pie Charts For Relative Comparison Study Powerpoint Slides
This power point template illustrates diagram of three pie charts with percentage values. This business slide can be used for relative comparison study. Present your views and ideas with this impressive slide.

Map Diagram With Four Locations Powerpoint Slides
This PowerPoint template displays graphics of map diagram with four locations and percentage values. This Map template can be used in business presentations to depict economic analysis. This slide can also be used by school students for educational projects.

Financial Reporting Manager With Data Powerpoint Slides
This PowerPoint template has been designed with graphics of finance manager and percentage data. This diagram is useful to exhibit financial management. This diagram slide can be used to make impressive presentations.

Skill Assessment Chart For Employee Performance Powerpoint Slides
Sliders with percentage values have been displayed in this business slide. This business diagram may be used as skill assessment chart. Download this PowerPoint template to build an exclusive presentation.

Column Chart For Financial Analysis Powerpoint Slides
This PowerPoint template has been designed with graphics of column chart with percentage values. You may use this business slide design for topics like financial analysis and planning. This PPT slide is powerful tool to describe your ideas.

Two Teams Performance Analysis Chart Powerpoint Slides
This PowerPoint template has been designed with icons of two teams with percentage values. Download this PPT slide to depict team?s performance analysis. Deliver amazing presentations to mesmerize your audience by using this PPT slide design.
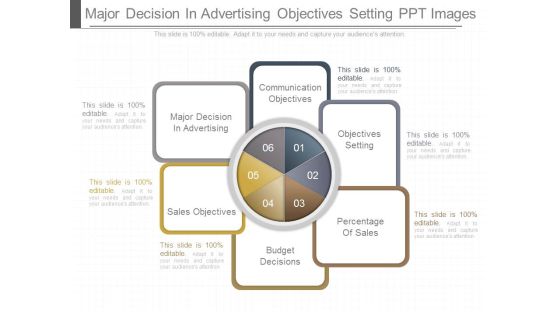
Major Decision In Advertising Objectives Setting Ppt Images
This is a major decision in advertising objectives setting ppt images. This is a six stage process. The stages in this process are communication objectives, objectives setting, percentage of sales, budget decisions, sales objectives, major decision in advertising.
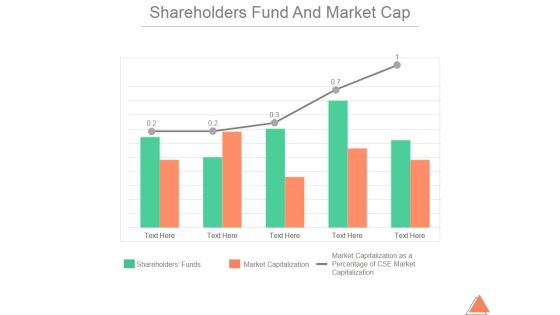
Shareholders Fund And Market Cap Ppt PowerPoint Presentation Guidelines
This is a shareholders fund and market cap ppt powerpoint presentation guidelines. This is a five stage process. The stages in this process are shareholders funds, market capitalization, market capitalization as a percentage of cse market capitalization.

Top Marketing Campaigns Ppt PowerPoint Presentation Inspiration Structure
This is a top marketing campaigns ppt powerpoint presentation inspiration structure. This is a four stage process. The stages in this process are campaign, daily budget, margin, max percentage of budget.
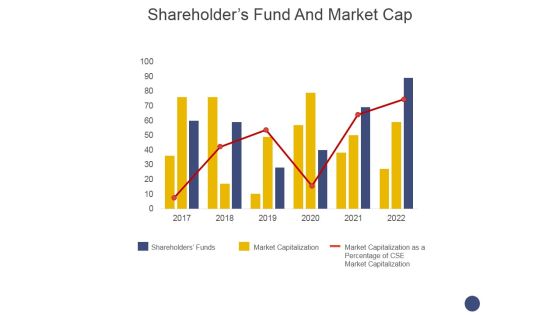
Shareholders Fund And Market Cap Ppt PowerPoint Presentation Show Background Image
This is a shareholders fund and market cap ppt powerpoint presentation show background image. This is a three stage process. The stages in this process are shareholders funds, market capitalization, market capitalization as a percentage of cse market capitalization.

Current Staff Profile Years Of Experience Needs Ppt PowerPoint Presentation Portfolio Deck
This is a current staff profile years of experience needs ppt powerpoint presentation portfolio deck. This is a four stage process. The stages in this process are least experience, staff types, percentage of staff.

Current Staff Profile Years Of Experience Needs Ppt PowerPoint Presentation Model Structure
This is a current staff profile years of experience needs ppt powerpoint presentation model structure. This is a four stage process. The stages in this process are percentage of staff, staff types, least experience, years of experience of hospital.

Current Staff Profile Years Of Experience Needs Ppt PowerPoint Presentation Layouts Influencers
This is a current staff profile years of experience needs ppt powerpoint presentation layouts influencers. This is a four stage process. The stages in this process are years of experience of hospital staff, percentage of staff, staff types, least experience.

Shareholders Fund And Market Cap Ppt PowerPoint Presentation Layouts Aids
This is a shareholders fund and market cap ppt powerpoint presentation layouts aids. This is a five stage process. The stages in this process are shareholders funds, market capitalization, market capitalization as a percentage of cse market capitalization.

Current Staff Profile Years Of Experience Ppt PowerPoint Presentation Shapes
This is a current staff profile years of experience ppt powerpoint presentation shapes. This is a four stage process. The stages in this process are staff types, percentage of staff, least experience, years.

Quality Cost Report Template 2 Ppt PowerPoint Presentation Professional
This is a quality cost report template 2 ppt powerpoint presentation professional. This is a two stage process. The stages in this process are types of cost, quality cost, percentage of sales, prevention cost.
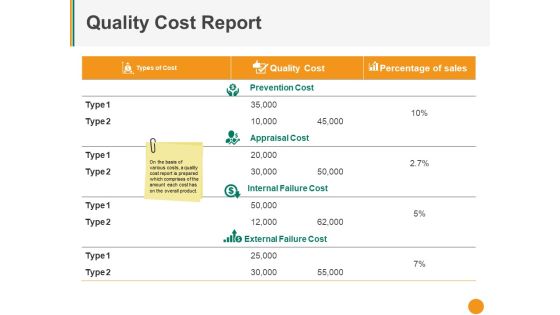
Quality Cost Report Ppt PowerPoint Presentation Model Portrait
This is a quality cost report ppt powerpoint presentation model portrait. This is a three stage process. The stages in this process are types of cost, quality cost, percentage of sales, prevention cost, appraisal cost.

Quality Cost Report Ppt PowerPoint Presentation Portfolio Show
This is a quality cost report ppt powerpoint presentation portfolio show. This is a four stage process. The stages in this process are types of cost, quality cost, percentage of sales, prevention cost, appraisal cost.

Bar Chart Ppt PowerPoint Presentation File Slide
This is a bar chart ppt powerpoint presentation file slide. This is a one stage process. The stages in this process are sales in percentage financial years, business, marketing, strategy, graph.

Quality Cost Report Ppt PowerPoint Presentation Tips
This is a quality cost report ppt powerpoint presentation tips. This is a two stage process. The stages in this process are types of cost, quality cost, percentage of sales.
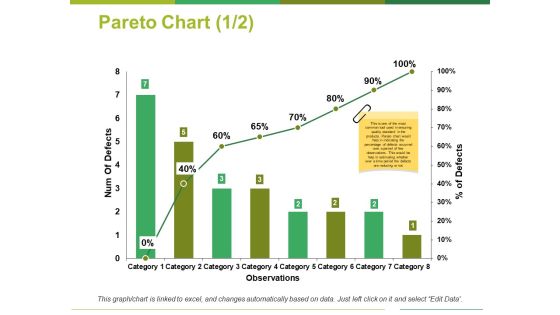
Pareto Chart Template 1 Ppt PowerPoint Presentation Outline Show
This is a pareto chart template 1 ppt powerpoint presentation outline show. This is a eight stage process. The stages in this process are num of defects, percentage of defects, observations, category.
Operational Performance Metrics Days Ppt PowerPoint Presentation Icon Maker
This is a operational performance metrics days ppt powerpoint presentation icon maker. This is a four stage process. The stages in this process are customer support tickets, lob efficiency measure, process downtime level, percentage of product defects.
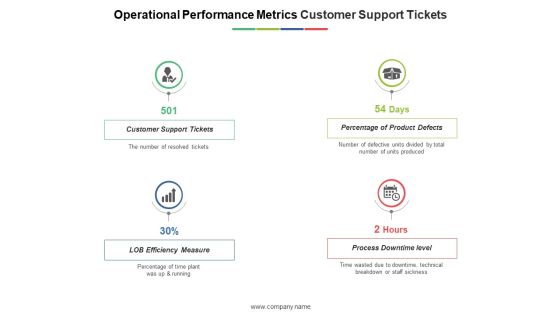
Operational Performance Metrics Customer Support Tickets Ppt PowerPoint Presentation Outline Graphics Design
This is a operational performance metrics customer support tickets ppt powerpoint presentation outline graphics design. This is a four stage process. The stages in this process are customer support tickets, percentage of product defects, lob efficiency measure, process downtime level.

Portfolio Management Securities Allocation Dashboard Ppt PowerPoint Presentation Professional Design Ideas
This is a portfolio management securities allocation dashboard ppt powerpoint presentation professional design ideas. This is a four stage process. The stages in this process are percentage product, business, management, marketing.

Portfolio Summary Management Dashboard Ppt PowerPoint Presentation File Design Templates
This is a portfolio summary management dashboard ppt powerpoint presentation file design templates. This is a five stage process. The stages in this process are percentage product, business, management, marketing.
Human Hand With Percent Sign Ppt PowerPoint Presentation Icon Clipart Images
This is a human hand with percent sign ppt powerpoint presentation icon clipart images. This is a three stage process. The stages in this process are percentage icon, dividend icon, portion icon.

Employees Sales Performance Comparison Circle Chart Topics PDF
This slide shows the sales share percentage chart by salespersons to gain an understanding of the performance of employees. It includes teams and their sales percentage. Pitch your topic with ease and precision using this Employees Sales Performance Comparison Circle Chart Topics PDF. This layout presents information on Employees Sales Performance, Comparison Circle Chart. It is also available for immediate download and adjustment. So, changes can be made in the color, design, graphics or any other component to create a unique layout.

Kpis For Effectiveness Of Business Training Ppt PowerPoint Presentation Ideas Summary PDF
Persuade your audience using this kpis for effectiveness of business training ppt powerpoint presentation ideas summary pdf. This PPT design covers five stages, thus making it a great tool to use. It also caters to a variety of topics including average test score, training completion percentage rate, departmental job percentage rate, class attendance rate, operational effectiveness measures. Download this PPT design now to present a convincing pitch that not only emphasizes the topic but also showcases your presentation skills.

Creating Successful Strategies To Enhance Customer Experience Which Social Network Mockup PDF
This slide shows the graphical representation of customer engagement by social media sites such as snapchat, Instagram, twitter, etc. with total minutes and percentage reach of digital population.Deliver and pitch your topic in the best possible manner with this Creating Successful Strategies To Enhance Customer Experience Which Social Network Mockup PDF Use them to share invaluable insights on Digital Population, Percentage Reach, Digital Population and impress your audience. This template can be altered and modified as per your expectations. So, grab it now.
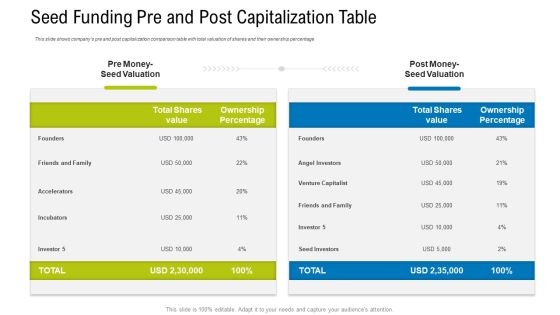
Seed Funding Pre And Post Capitalization Table Ppt Show Templates PDF
This slide shows companys pre and post capitalization comparison table with total valuation of shares and their ownership percentage.Deliver an awe-inspiring pitch with this creative seed funding pre and post capitalization table ppt show templates pdf. bundle. Topics like total shares value, ownership percentage can be discussed with this completely editable template. It is available for immediate download depending on the needs and requirements of the user.
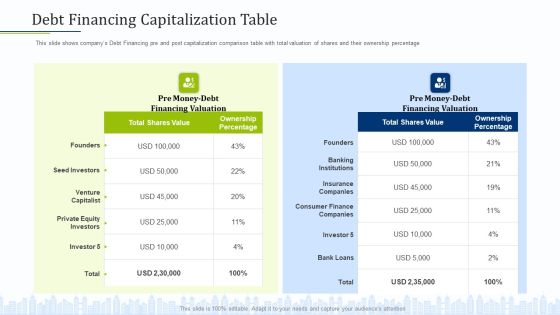
Pitch Deck To Draw External Capital From Commercial Banking Institution Debt Financing Capitalization Table Rules PDF
This slide shows companys Debt Financing pre and post capitalization comparison table with total valuation of shares and their ownership percentage Deliver and pitch your topic in the best possible manner with this pitch deck to draw external capital from commercial banking institution debt financing capitalization table rules pdf. Use them to share invaluable insights on total shares value, ownership percentage, private equity investors and impress your audience. This template can be altered and modified as per your expectations. So, grab it now.

Investor Pitch Deck For Seed Funding From Private Investor Seed Funding Pre And Post Capitalization Table Sample PDF
This slide shows companys pre and post capitalization comparison table with total valuation of shares and their ownership percentage.Deliver an awe-inspiring pitch with this creative investor pitch deck for seed funding from private investor seed funding pre and post capitalization table sample pdf. bundle. Topics like total shares value, ownership percentage can be discussed with this completely editable template. It is available for immediate download depending on the needs and requirements of the user.
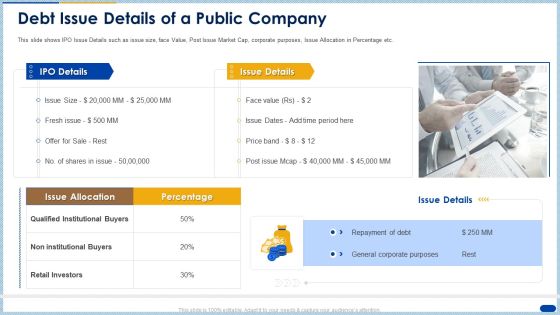
Raising Capital Banking Organizations Post Initial Public Offering Debt Issue Details Of A Public Company Topics PDF
This slide shows IPO Issue Details such as issue size, face Value, Post Issue Market Cap, corporate purposes, Issue Allocation in Percentage etc. Deliver an awe inspiring pitch with this creative raising capital banking organizations post initial public offering debt issue details of a public company topics pdf bundle. Topics like percentage, retail investors, repayment of debt can be discussed with this completely editable template. It is available for immediate download depending on the needs and requirements of the user.
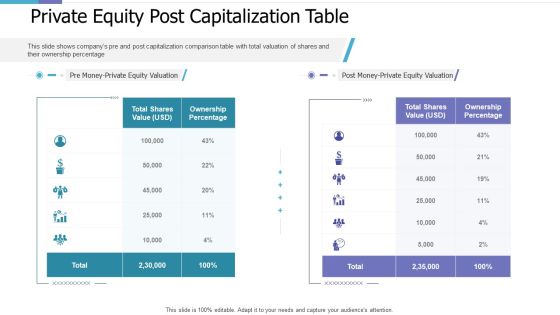
Private Equity Post Capitalization Table Investor Pitch Deck For PE Funding Formats PDF
This slide shows companys pre and post capitalization comparison table with total valuation of shares and their ownership percentage. Deliver and pitch your topic in the best possible manner with this private equity post capitalization table investor pitch deck for pe funding formats pdf. Use them to share invaluable insights on shares value, ownership percentage and impress your audience. This template can be altered and modified as per your expectations. So, grab it now.

Generating Logistics Value Business Financial Elements PDF
This is a generating logistics value business fall in on time pickup percentage of hcl plus logistics company slides pdf template with various stages. Focus and dispense information on three stages using this creative set, that comes with editable features. It contains large content boxes to add your information on topics like fall in on time pickup percentage of hcl plus logistics company for 5 years. You can also showcase facts, figures, and other relevant content using this PPT layout. Grab it now.
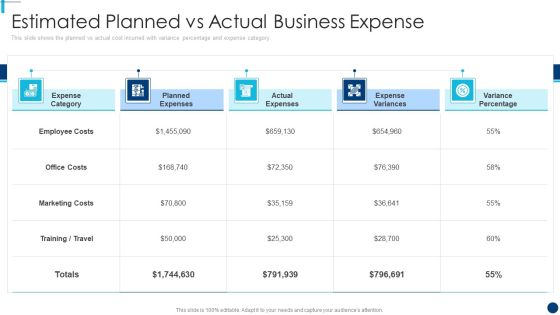
Finance And Accountancy BPO Estimated Planned Vs Actual Business Expense Sample PDF
This slide shows the planned vs actual cost incurred with variance percentage and expense category. Deliver and pitch your topic in the best possible manner with this finance and accountancy bpo estimated planned vs actual business expense sample pdf. Use them to share invaluable insights on expense category, planned expenses, actual expenses, expense variances, variance percentage and impress your audience. This template can be altered and modified as per your expectations. So, grab it now.
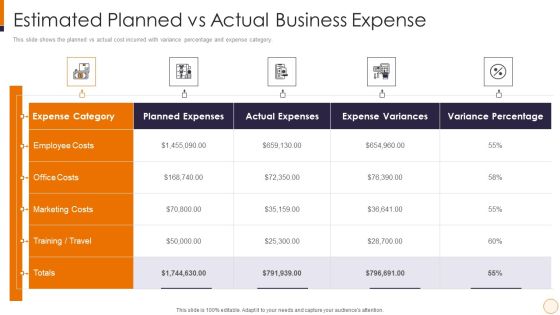
SME And Startups Financing Services Estimated Planned Vs Actual Business Expense Summary PDF
This slide shows the planned vs actual cost incurred with variance percentage and expense category. Deliver an awe inspiring pitch with this creative sme and startups financing services estimated planned vs actual business expense summary pdf bundle. Topics like planned expenses, actual expenses, expense variances, variance percentage can be discussed with this completely editable template. It is available for immediate download depending on the needs and requirements of the user.

Corporate Physical Health And Fitness Culture Playbook Physical Wellbeing Evaluation Inspiration PDF
Mentioned slide showcases checklist that can be used by managers to evaluate employees monthly calorie intake. Sections covered in the checklist are meal, calories, grams of fat, fat percentage etc. Deliver an awe inspiring pitch with this creative corporate physical health and fitness culture playbook physical wellbeing evaluation inspiration pdf bundle. Topics like monthly summary, calories consumed, fat percentage can be discussed with this completely editable template. It is available for immediate download depending on the needs and requirements of the user.

Cost Allocation Method Used Ppt Gallery Designs PDF
This slide covers the final allocation base percentage of the allocation base with its numerator, denominator and percentage of the total multiplied by indirect cost Deliver an awe inspiring pitch with this creative cost allocation method used ppt gallery designs pdf bundle. Topics like V can be discussed with this completely editable template. It is available for immediate download depending on the needs and requirements of the user.
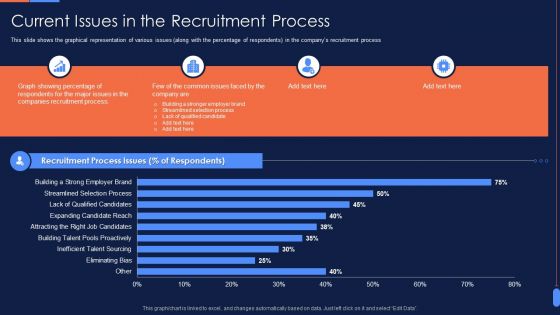
Recruitment Training To Optimize Current Issues In The Recruitment Process Designs PDF
This slide shows the graphical representation of various issues along with the percentage of respondents in the companys recruitment process. Deliver an awe inspiring pitch with this creative Recruitment Training To Optimize Current Issues In The Recruitment Process Designs PDF bundle. Topics like Graph Showing Percentage, Recruitment Process Issues, Eliminating Bias, Inefficient Talent Sourcing can be discussed with this completely editable template. It is available for immediate download depending on the needs and requirements of the user.
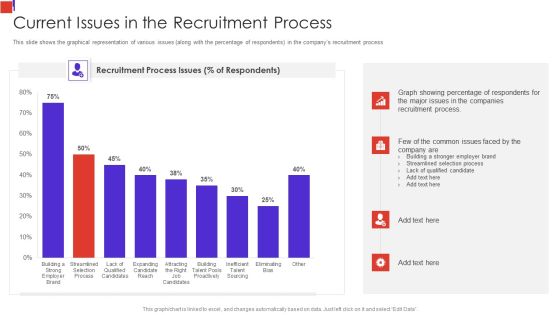
Outline Of Employee Recruitment Current Issues In The Recruitment Process Information PDF
This slide shows the graphical representation of various issues along with the percentage of respondents in the companys recruitment process Deliver an awe inspiring pitch with this creative Outline Of Employee Recruitment Current Issues In The Recruitment Process Information PDF bundle. Topics like Showing Percentage, Issues In The Companies, Recruitment Process can be discussed with this completely editable template. It is available for immediate download depending on the needs and requirements of the user.
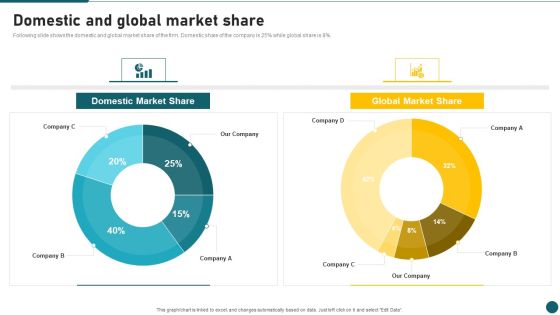
Due Diligence In Amalgamation And Acquisition Domestic And Global Market Share Slides PDF
Following slide shows the domestic and global market share of the firm. Domestic share of the company is 25 percentage while global share is 8 percentage. Deliver an awe inspiring pitch with this creative Due Diligence In Amalgamation And Acquisition Domestic And Global Market Share Slides PDF bundle. Topics like Domestic Market Share, Global Market Share can be discussed with this completely editable template. It is available for immediate download depending on the needs and requirements of the user.
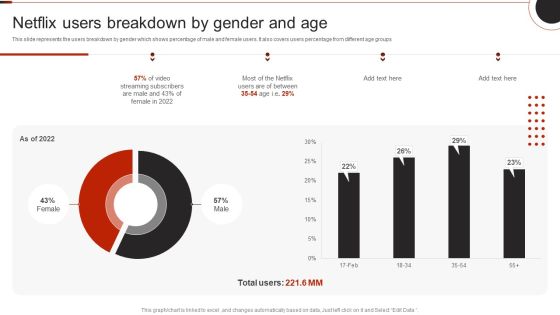
Netflix Company Outline Netflix Users Breakdown By Gender And Age Template PDF
This slide represents the users breakdown by gender which shows percentage of male and female users. It also covers users percentage from different age groups.Deliver an awe inspiring pitch with this creative Netflix Company Outline Netflix Users Breakdown By Gender And Age Template PDF bundle. Topics like Streaming Subscribers, Male Female, Total Users can be discussed with this completely editable template. It is available for immediate download depending on the needs and requirements of the user.

Cost Distribution Accounting Techniques Cost Allocation Method Used Download PDF
This slide covers the final allocation base percentage of the allocation base with its numerator, denominator and percentage of the total multiplied by indirect cost. Deliver and pitch your topic in the best possible manner with this Cost Distribution Accounting Techniques Cost Allocation Method Used Download PDF. Use them to share invaluable insights on Indirect Cost, Allocated Cost and impress your audience. This template can be altered and modified as per your expectations. So, grab it now.

Computer Virtualization Problems Faced By The Company Download PDF
This slide describes the problems faced by the company that include the percentage of total spreadsheets, percentage of excel sheets that contains errors and number of managers who dont know about high risk spreadsheets.Deliver an awe inspiring pitch with this creative Computer Virtualization Problems Faced By The Company Download PDF bundle. Topics like Spreadsheets Make, Spreadsheets That Posses, Provide Official can be discussed with this completely editable template. It is available for immediate download depending on the needs and requirements of the user.

BPO Call Center Company Profile Integrated Performance Of The Company Portrait PDF
This slide highlights the integrated performance of call center which covers different elements such as jobs created, percentage of women, renewable energy consumption, employees trained on data security and code of conduct.Deliver an awe inspiring pitch with this creative BPO Call Center Company Profile Integrated Performance Of The Company Portrait PDF bundle. Topics like Percentage Women, Agents Trained, Technology Analytics can be discussed with this completely editable template. It is available for immediate download depending on the needs and requirements of the user.

Cost Allocation Method Used Cost Sharing And Exercisebased Costing System Brochure PDF
This slide covers the final allocation base percentage of the allocation base with its numerator, denominator and percentage of the total multiplied by indirect cost. Deliver an awe inspiring pitch with this creative Cost Allocation Method Used Cost Sharing And Exercisebased Costing System Brochure PDF bundle. Topics like Allocation Base, Percent Allocation, Allocation Cost can be discussed with this completely editable template. It is available for immediate download depending on the needs and requirements of the user.
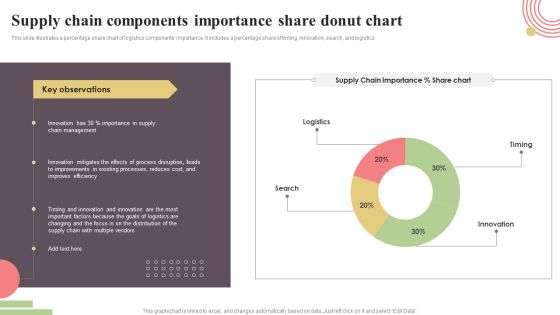
Supply Chain Components Importance Share Donut Chart Rules PDF
This slide illustrates a percentage share chart of logistics components importance. It includes a percentage share of timing, innovation, search, and logistics. Showcasing this set of slides titled Supply Chain Components Importance Share Donut Chart Rules PDF. The topics addressed in these templates are Timing, Innovation, Search, Logistics. All the content presented in this PPT design is completely editable. Download it and make adjustments in color, background, font etc. as per your unique business setting.

Providing HR Service To Improve Key HR Service Delivery Statistics On A Global Scale Designs PDF
This slide shows the some of the key HR Service Delivery Statistics on a Global Scale such as percentage of companies that are that are expected to perform better due to ethnic diversity, percentage of employees whose loyalty will increase to additional paid time, increase in annual growth rate due to more employee engagement programs etc. Deliver and pitch your topic in the best possible manner with this providing hr service to improve key hr service delivery statistics on a global scale designs pdf. Use them to share invaluable insights on revenue growth, employee, employee termination costs and impress your audience. This template can be altered and modified as per your expectations. So, grab it now.

Gears Interconnected Process Arrow 2 Steps Help Writing Business Plan PowerPoint Slides
We present our gears interconnected process arrow 2 steps help writing business plan PowerPoint Slides.Download and present our Arrows PowerPoint Templates because Our PowerPoint Templates and Slides will let your team Walk through your plans. See their energy levels rise as you show them the way. Use our Shapes PowerPoint Templates because You have a driving passion to excel in your field. Our PowerPoint Templates and Slides will prove ideal vehicles for your ideas. Download our Gear Wheels PowerPoint Templates because Our PowerPoint Templates and Slides will provide weight to your words. They will bring out the depth of your thought process. Present our Business PowerPoint Templates because Our PowerPoint Templates and Slides are Clear and concise. Use them and dispel any doubts your team may have. Present our Success PowerPoint Templates because Watching this your Audience will Grab their eyeballs, they wont even blink.Use these PowerPoint slides for presentations relating to accounting, arrow, ascending, background, bank, blue, business, charts, compare, comparison, computer, corporate, count, descending, fame, famous, finance, generated, gradient, grow, growth, illustration, income, international, linear, money, papers, parallel, percentage, point, record, scale, shares, signs, stock, success, symbols, tax, tip, vary, white, world. The prominent colors used in the PowerPoint template are Yellow, Green, Gray.
