AI PPT Maker
Templates
PPT Bundles
Design Services
Business PPTs
Business Plan
Management
Strategy
Introduction PPT
Roadmap
Self Introduction
Timelines
Process
Marketing
Agenda
Technology
Medical
Startup Business Plan
Cyber Security
Dashboards
SWOT
Proposals
Education
Pitch Deck
Digital Marketing
KPIs
Project Management
Product Management
Artificial Intelligence
Target Market
Communication
Supply Chain
Google Slides
Research Services
 One Pagers
All Categories
-
Home
- Customer Favorites
- Percentage Growth
Percentage Growth
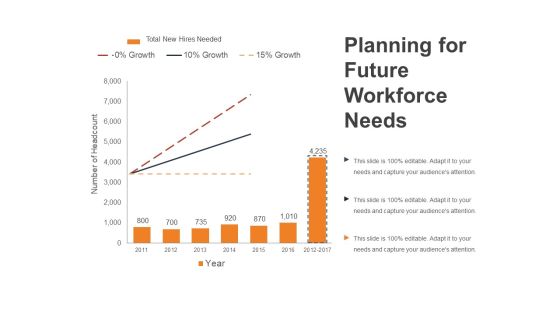
Planning For Future Workforce Needs Ppt PowerPoint Presentation Outline Smartart
This is a planning for future workforce needs ppt powerpoint presentation outline smartart. This is a three stage process. The stages in this process are growth, percentage, number of headcount, year, finance.
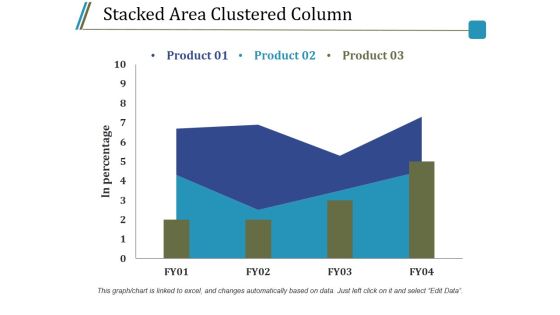
Stacked Area Clustered Column Ppt PowerPoint Presentation Model Guidelines
This is a stacked area clustered column ppt powerpoint presentation model guidelines. This is a three stage process. The stages in this process are product, in percentage, bar graph, growth, success.

Clustered Column Template 2 Ppt PowerPoint Presentation Summary Smartart
This is a clustered column template 2 ppt powerpoint presentation summary smartart. This is a two stage process. The stages in this process are product, bar graph, in percentage, clustered column, growth.

Clustered Column Line Ppt PowerPoint Presentation Summary Background Image
This is a clustered column line ppt powerpoint presentation summary background image. This is a four stage process. The stages in this process are in percentage, product, graph, growth, success.

Line Chart Ppt PowerPoint Presentation File Example File
This is a line chart ppt powerpoint presentation file example file. This is a two stage process. The stages in this process are product, in percentage, in years, growth, success.

Performance Analysis Of Mutual Funds Scheme Ppt Professional Grid PDF
This slide shows assessment of mutual fund scheme performance. It provides details about return from fund, long term , short term, weekly, average return rate, rank amongst categories, percentage growth, etc. Pitch your topic with ease and precision using this Performance Analysis Of Mutual Funds Scheme Ppt Professional Grid PDF. This layout presents information on Return From Fund, Average Return Rate, Rank Amongst Categories. It is also available for immediate download and adjustment. So, changes can be made in the color, design, graphics or any other component to create a unique layout.

Careers In Supply Chain SCM Planning Ppt Inspiration Smartart PDF
This slide shows different career roles in planning of supply chain marketing with placement percentage and job growth. It include various career roles like supply chain analyst, purchasing specialist, operations analyst etc. Persuade your audience using this Careers In Supply Chain SCM Planning Ppt Inspiration Smartart PDF. This PPT design covers one stages, thus making it a great tool to use. It also caters to a variety of topics including Job Description, Placement Percentage, Job Growth, Median Salary. Download this PPT design now to present a convincing pitch that not only emphasizes the topic but also showcases your presentation skills.

Area Chart Ppt PowerPoint Presentation File Graphic Tips
This is a area chart ppt powerpoint presentation file graphic tips. This is a two stage process. The stages in this process are product, in percentage, financial year, business, growth.
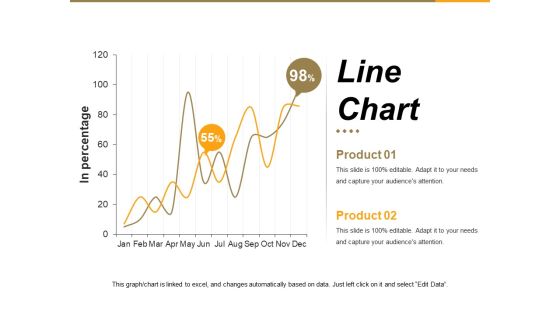
Line Chart Ppt PowerPoint Presentation Summary File Formats
This is a line chart ppt powerpoint presentation summary file formats. This is a two stage process. The stages in this process are in percentage, graph, business, marketing, growth.

Combo Chart Ppt PowerPoint Presentation Information
This is a combo chart ppt powerpoint presentation information. This is a four stage process. The stages in this process are growth, product, in percentage.
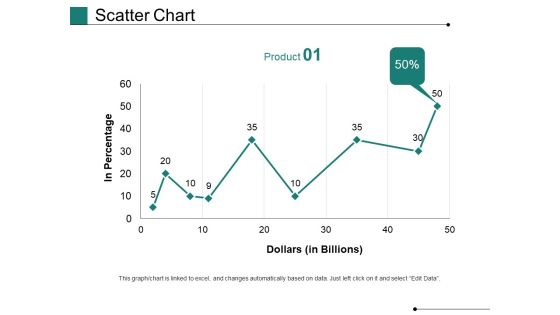
Scatter Chart Ppt PowerPoint Presentation Gallery Show
This is a scatter chart ppt powerpoint presentation gallery show. This is a one stage process. The stages in this process are in percentage, dollars, business, marketing, growth, graph.
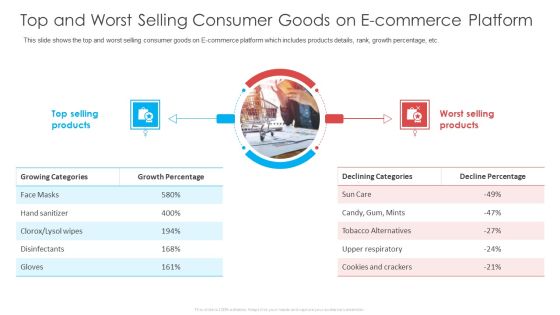
Top And Worst Selling Consumer Goods On E Commerce Platform Ppt File Outline PDF
This slide shows the top and worst selling consumer goods on E-commerce platform which includes products details, rank, growth percentage, etc. Deliver an awe-inspiring pitch with this creative top and worst selling consumer goods on e commerce platform ppt file outline pdf bundle. Topics like growth percentage, decline percentage, selling products can be discussed with this completely editable template. It is available for immediate download depending on the needs and requirements of the user.

Bar Graph Ppt PowerPoint Presentation Good
This is a bar graph ppt powerpoint presentation good. This is a four stage process. The stages in this process are bar graph, growth, business, marketing, management, percentage.

Combo Chart Ppt PowerPoint Presentation Infographic Template Graphic Images
This is a combo chart ppt powerpoint presentation infographic template graphic images. This is a three stage process. The stages in this process are market size, growth rate, percentage, business, marketing.
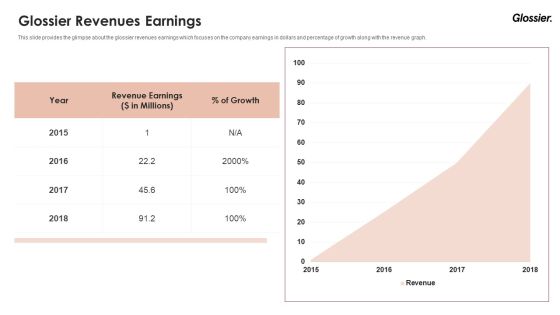
Glossier Financing Elevator Pitch Deck Glossier Revenues Earnings Ppt Slides Graphics Example PDF
This slide provides the glimpse about the glossier revenues earnings which focuses on the company earnings in dollars and percentage of growth along with the revenue graph. Deliver an awe-inspiring pitch with this creative glossier financing elevator pitch deck glossier revenues earnings ppt slides graphics example pdf bundle. Topics like glossier revenues earnings can be discussed with this completely editable template. It is available for immediate download depending on the needs and requirements of the user.

Scatter Chart Template 3 Ppt PowerPoint Presentation Styles Demonstration
This is a scatter chart template 3 ppt powerpoint presentation styles demonstration. This is a one stage process. The stages in this process are sales in percentage, finance, business, marketing, growth.

Comparison Ppt PowerPoint Presentation Layouts Gridlines
This is a comparison ppt powerpoint presentation layouts gridlines. This is a three stage process. The stages in this process are year, growth, success, percentage, finance.

Combo Chart Ppt PowerPoint Presentation Model Grid
This is a combo chart ppt powerpoint presentation model grid. This is a three stage process. The stages in this process are growth, product, percentage, marketing.

Financial Ppt PowerPoint Presentation Ideas Show
This is a financial ppt powerpoint presentation ideas show. This is a four stage process. The stages in this process are percentage, finance, business, marketing, growth.

Competitor Positioning Ppt PowerPoint Presentation Styles Aids
This is a competitor positioning ppt powerpoint presentation styles aids. This is a two stage process. The stages in this process are company growth, business, percentage, finance, graph.

Line Chart Ppt PowerPoint Presentation Layouts Example
This is a line chart ppt powerpoint presentation layouts example. This is a two stage process. The stages in this process are sales in percentage, product, financial years, growth, success.

Bar Graph Ppt PowerPoint Presentation Ideas Graphic Tips
This is a bar graph ppt powerpoint presentation ideas graphic tips. This is a three stage process. The stages in this process are financial year, sales in percentage, product, bar graph, growth.
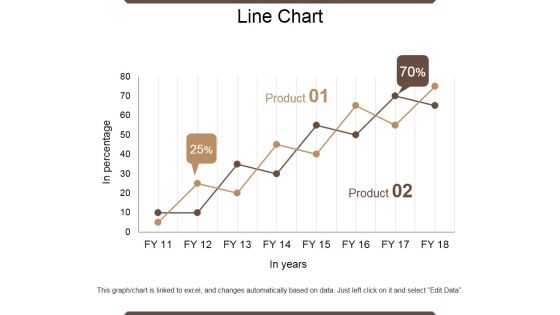
Line Chart Ppt PowerPoint Presentation Outline Infographic Template
This is a line chart ppt powerpoint presentation outline infographic template. This is a two stage process. The stages in this process are in percentage, product, in year, growth, success.

Stacked Area Clustered Column Ppt PowerPoint Presentation Show Guidelines
This is a stacked area clustered column ppt powerpoint presentation show guidelines. This is a four stage process. The stages in this process are in percentage, product, bar graph, growth, success.
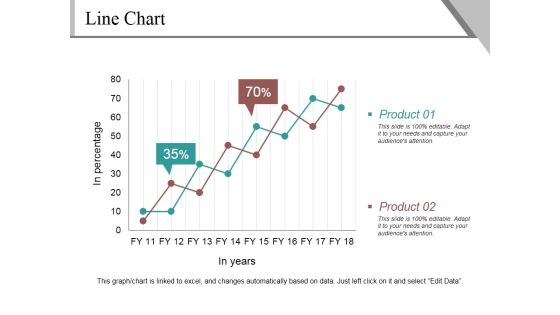
Line Chart Ppt PowerPoint Presentation Infographics Example
This is a line chart ppt powerpoint presentation infographics example. This is a two stage process. The stages in this process are product, in percentage, in years, finance, growth.
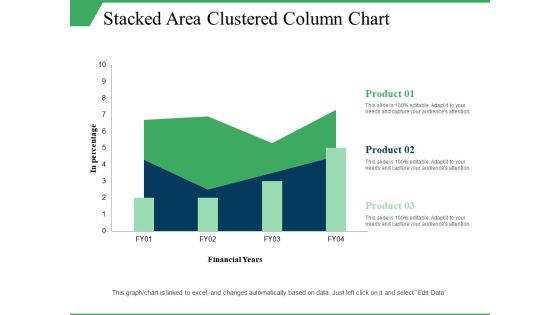
Stacked Area Clustered Column Chart Ppt PowerPoint Presentation Visual Aids Model
This is a stacked area clustered column chart ppt powerpoint presentation visual aids model. This is a three stage process. The stages in this process are in percentage, product, financial years, growth, column chart.
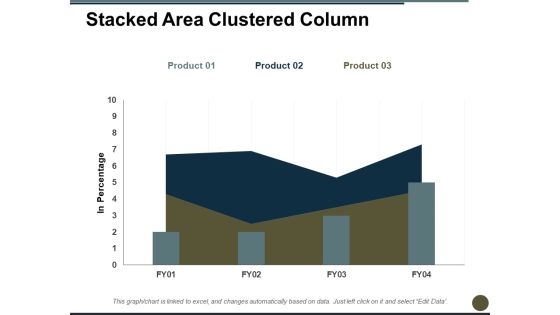
Stacked Area Clustered Column Ppt PowerPoint Presentation Professional Graphics
This is a stacked area clustered column ppt powerpoint presentation professional graphics. This is a three stage process. The stages in this process are in percentage, bar chart, product, growth, year.
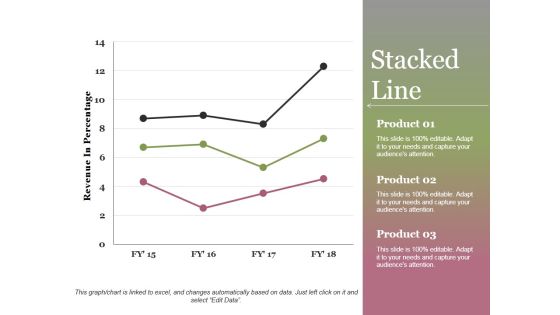
Stacked Line Ppt PowerPoint Presentation Show
This is a stacked line ppt powerpoint presentation show. This is a three stage process. The stages in this process are revenue in percentage, product, stacked line, growth, success.

Line Chart Ppt PowerPoint Presentation Slides Mockup
This is a line chart ppt powerpoint presentation slides mockup. This is a two stage process. The stages in this process are in percentage, in years, product, growth, success.

Clustered Column Line Ppt PowerPoint Presentation Icon Ideas
This is a clustered column line ppt powerpoint presentation icon ideas. This is a three stage process. The stages in this process are product, in percentage, bar graph, success, growth.
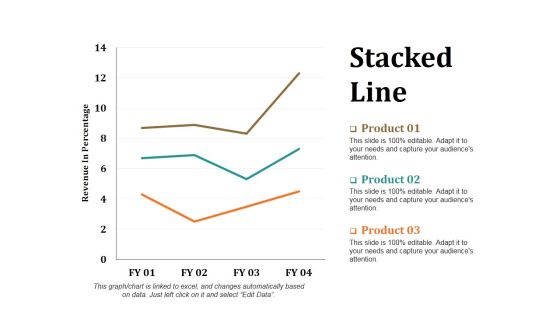
Stacked Line Ppt PowerPoint Presentation Layouts Portrait
This is a stacked line ppt powerpoint presentation layouts portrait. This is a three stage process. The stages in this process are revenue in percentage, stacked line, product, growth, success.
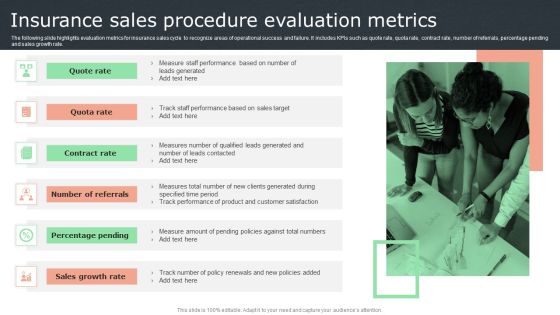
Insurance Sales Procedure Evaluation Metrics Graphics PDF
The following slide highlights evaluation metrics for insurance sales cycle to recognize areas of operational success and failure. It includes KPIs such as quote rate, quota rate, contract rate, number of referrals, percentage pending and sales growth rate. Presenting Insurance Sales Procedure Evaluation Metrics Graphics PDF to dispense important information. This template comprises six stages. It also presents valuable insights into the topics including Contract Rate, Percentage Pending, Sales Growth Rate . This is a completely customizable PowerPoint theme that can be put to use immediately. So, download it and address the topic impactfully.

Column Chart Ppt PowerPoint Presentation Slides Smartart
This is a column chart ppt powerpoint presentation slides smartart. This is a two stage process. The stages in this process are sales in percentage, financial year in, business, growth, strategy.
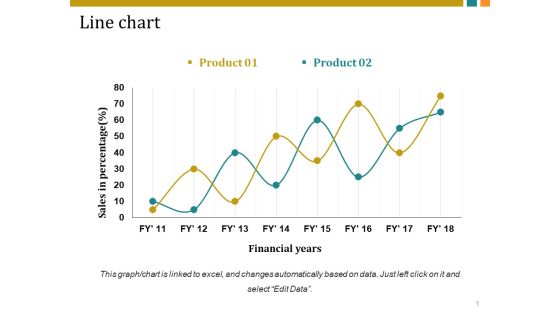
Line Chart Ppt PowerPoint Presentation Inspiration Vector
This is a line chart ppt powerpoint presentation inspiration vector. This is a two stage process. The stages in this process are sales in percentage, financial years, business, marketing, growth.

Line Chart Ppt PowerPoint Presentation Pictures Templates
This is a line chart ppt powerpoint presentation pictures templates. This is a two stage process. The stages in this process are sales in percentage, financial years, business, marketing, growth.

Bar Graph Ppt PowerPoint Presentation File Slides
This is a bar graph ppt powerpoint presentation file slides. This is a three stage process. The stages in this process are product, sales in percentage, bar graph, growth, success.

Resource Capacity Planning Template 2 Ppt PowerPoint Presentation Show
This is a resource capacity planning template 2 ppt powerpoint presentation show. This is a four stage process. The stages in this process are percentage, finance, donut, growth, success.

Big Data Opportunities And Challenges In Construction Ppt PowerPoint Presentation Outline
This is a big data opportunities and challenges in construction ppt powerpoint presentation outline. This is a three stage process. The stages in this process are finance, management, growth, percentage, business.

Bar Chart Ppt PowerPoint Presentation Icon Design Templates
This is a bar chart ppt powerpoint presentation icon design templates. This is a nine stage process. The stages in this process are sales in percentage, bar graph, business, marketing, growth.

Line Chart Ppt PowerPoint Presentation Ideas Example
This is a line chart ppt powerpoint presentation ideas example. This is a two stage process. The stages in this process are sales in percentage, bar graph, business, marketing, growth.
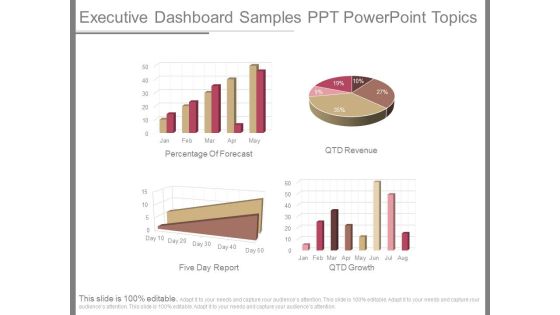
Executive Dashboard Samples Ppt Powerpoint Topics
This is a executive dashboard samples ppt powerpoint topics. This is a four stage process. The stages in this process are percentage of forecast, qtd revenue, five day report, qtd growth
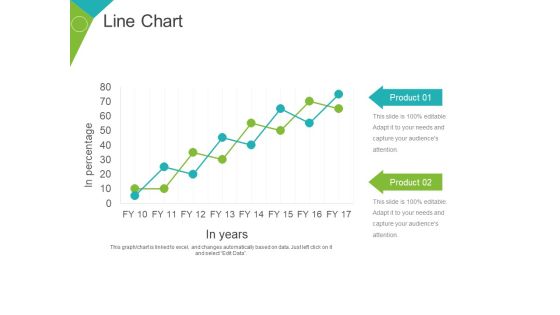
Line Chart Ppt PowerPoint Presentation Gallery Objects
This is a line chart ppt powerpoint presentation gallery objects. This is a two stage process. The stages in this process are product, business, marketing, growth, in years, in percentage.
Stacked Column Ppt PowerPoint Presentation Icon Inspiration
This is a stacked column ppt powerpoint presentation icon inspiration. This is a two stage process. The stages in this process are stacked column, product, sales, growth, sales in percentage.

Bar Chart Ppt PowerPoint Presentation Icon Information
This is a bar chart ppt powerpoint presentation icon information. This is a one stage process. The stages in this process are product, sales in percentage, financial years, bar graph, growth.

Column Chart Ppt PowerPoint Presentation Layouts Tips
This is a column chart ppt powerpoint presentation layouts tips. This is a six stage process. The stages in this process are sales in percentage, financial year, bar graph, growth, success.

Clustered Column Line Ppt PowerPoint Presentation Portfolio Outline
This is a clustered column line ppt powerpoint presentation portfolio outline. This is a four stage process. The stages in this process are sales in percentage, financial year, product, graph, growth.

Area Chart Ppt PowerPoint Presentation Inspiration Graphics
This is a area chart ppt powerpoint presentation inspiration graphics. This is a two stage process. The stages in this process are product, area chart, business, growth, sales in percentage.

Stacked Area Clustered Column Ppt PowerPoint Presentation Summary Professional
This is a stacked area clustered column ppt powerpoint presentation summary professional. This is a three stage process. The stages in this process are product, bar graph, growth, success, in percentage.
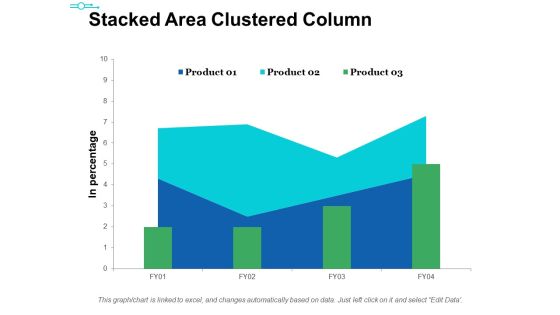
Stacked Area Clustered Column Ppt PowerPoint Presentation Ideas Themes
This is a stacked area clustered column ppt powerpoint presentation ideas themes. This is a three stage process. The stages in this process are product, in percentage, bar graph, area chart, growth.

Core Strategic Audience Powerpoint Graphics
This is a core strategic audience powerpoint graphics. This is a six stage process. The stages in this process are circular, growth, business, marketing, percentage.

Core Strategic Circular Diagram Powerpoint Images
This is a core strategic circular diagram powerpoint images. This is a six stage process. The stages in this process are circular, growth, business, marketing, percentage.
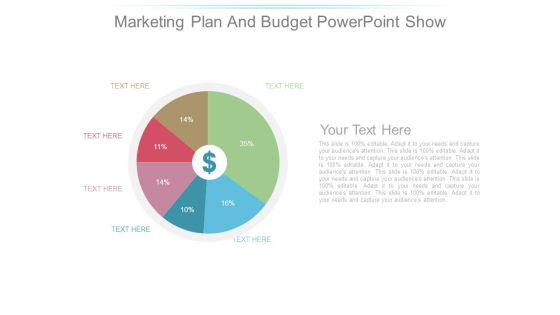
Marketing Plan And Budget Powerpoint Show
This is a marketing plan and budget powerpoint show. This is a six stage process. The stages in this process are growth, business, marketing, percentage, currency.
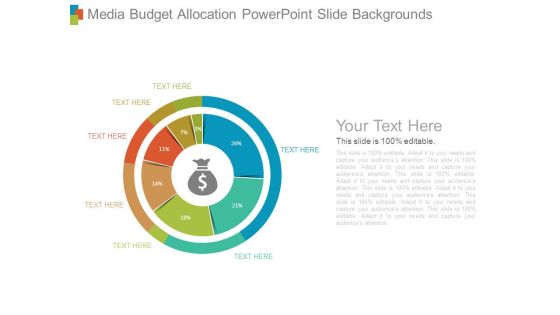
Media Budget Allocation Powerpoint Slide Backgrounds
This is a media budget allocation powerpoint slide backgrounds. This is a seven stage process. The stages in this process are growth, business, marketing, percentage, currency.
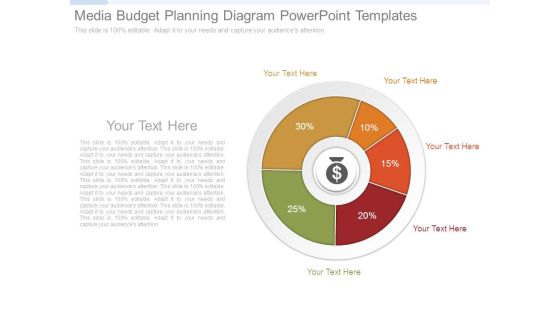
Media Budget Planning Diagram Powerpoint Templates
This is a media budget planning diagram powerpoint templates. This is a six stage process. The stages in this process are growth, business, marketing, percentage.

Possible Target Audiences Ppt Diagrams
This is a possible target audiences ppt diagrams. This is a seven stage process. The stages in this process are growth, business, marketing, percentage.
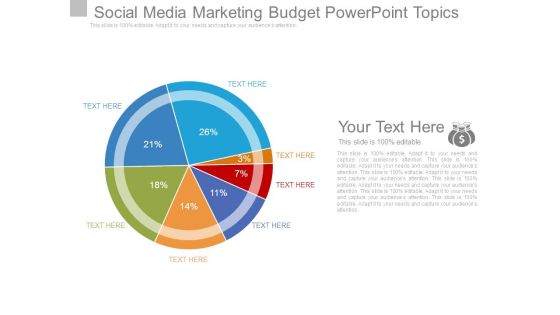
Social Media Marketing Budget Powerpoint Topics
This is a social media marketing budget powerpoint topics. This is a seven stage process. The stages in this process are pie, growth, business, marketing, percentage.
Pie Ppt PowerPoint Presentation Icon Designs Download
This is a pie ppt powerpoint presentation icon designs download. This is a four stage process. The stages in this process are pie, growth, finance, business, percentage.

Big Latest Facts About Data Market In IT Industry Pictures PDF
This slide covers big data market trends and analytics in IT industries. It involves percentage of growth over years, third party platforms and challenges to deliver successful business analytics solutions. Showcasing this set of slides titled Big Latest Facts About Data Market In IT Industry Pictures PDF. The topics addressed in these templates are Unskilled Workforce, Data Integration, Data Quality Management. All the content presented in this PPT design is completely editable. Download it and make adjustments in color, background, font etc. as per your unique business setting.

Ppt Group Of World Business PowerPoint Slide Text People With 3d Pie Chart Templates
PPT group of world business powerpoint slide text people with 3d pie chart Templates-This 3D Business PowerPoint Diagram consists of group of people standing on circle representing the growth percentage of individual Business perspective. This Diagram will fit for Business Presentations.-PPT group of world business powerpoint slide text people with 3d pie chart Templates-Abstract, Arrow, Art, Artistic, Background, Business, Colorful, Communication, Computer-Graphics, Concept, Creation, Data, Decoration, Decorative, Design, Design-Element, Digital, Direction, Effect, Elegance, Element, Energy, Flow, Go, Idea, Illustration, Modern, Movement, Network, Symbol

Column Chart Ppt PowerPoint Presentation Gallery Slide Portrait
This is a column chart ppt powerpoint presentation gallery slide portrait. This is a two stage process. The stages in this process are sales in percentage, financial year, product, bar graph, growth.

Column Chart Ppt PowerPoint Presentation Slides Visual Aids
This is a column chart ppt powerpoint presentation slides visual aids. This is a six stage process. The stages in this process are bar graph, growth, success, sales in percentage, financial year.

Assessing The Impact Of COVID On Retail Business Segment Top And Worst Selling Consumer Goods Background PDF
Presenting this set of slides with name assessing the impact of covid on retail business segment top and worst selling consumer goods background pdf. The topics discussed in these slides are growth percentage, growing categories, sauce and seasoning mix, alcoholic beverage mixers. This is a completely editable PowerPoint presentation and is available for immediate download. Download now and impress your audience.

Ppt 3d Men Standing On New Business PowerPoint Presentation Pie Chart Templates
PPT 3d men standing on new business powerpoint presentation pie chart Templates-This 3D Business PowerPoint Diagram consists of men standing on circle representing their percentage of work and growth individually. This Diagram will fit for Business Presentations.-PPT 3d men standing on new business powerpoint presentation pie chart Templates-Adult, Art, Background, Business, Career, Chart, Communication, Concept, Conference, Corporate, Creative, Design, Economy, Executive, Finance, Group, Growth, Idea, Illustration, Leadership, Meeting, New, Occupation, Office, People, Person, Progress, Silhouette, Space, Speaking, Standing, Success

Artificial Intelligence Platform The Company Purpose Ppt Slides Files PDF
This template briefly explains the purpose of the company, why it exists, who it exists for and what is mission of the company. Its also includes revenue growth in percentage and, list of stakeholders etc. Deliver an awe inspiring pitch with this creative artificial intelligence platform the company purpose ppt slides files pdf bundle. Topics like communicate, develop can be discussed with this completely editable template. It is available for immediate download depending on the needs and requirements of the user.
Forecasted Global Medicare IT Market Size Pictures PDF
This slide shows predicted healthcare IT Market Size over six years from 2022-26 for highlighting various reasons behind it. It includes elements such as annual average growth, next year growth percentage etc. Presenting Forecasted Global Medicare IT Market Size Pictures PDF to dispense important information. This template comprises six stages. It also presents valuable insights into the topics including Annual Average Growth, Fragmented Market, Neutral Market Impact. This is a completely customizable PowerPoint theme that can be put to use immediately. So, download it and address the topic impactfully.

Competitor Positioning Ppt PowerPoint Presentation Show Example Introduction
This is a competitor positioning ppt powerpoint presentation show example introduction. This is a two stage process. The stages in this process are market growth, company growth, business, finance, percentage.

Competitor Positioning Ppt PowerPoint Presentation Gallery Portrait
This is a competitor positioning ppt powerpoint presentation gallery portrait. This is a two stage process. The stages in this process are company growth, market growth, business, marketing, percentage.
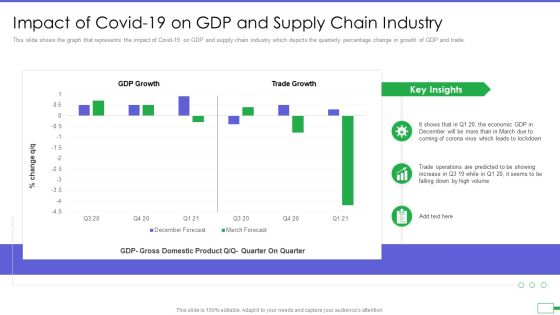
Iot And Digital Twin To Reduce Costs Post Covid Impact Of Covid 19 On Gdp And Supply Chain Industry Ideas PDF
This slide shows the graph that represents the impact of Covid 19 on GDP and supply chain industry which depicts the quarterly percentage change in growth of GDP and trade. Deliver an awe inspiring pitch with this creative iot and digital twin to reduce costs post covid impact of covid 19 on gdp and supply chain industry ideas pdf bundle. Topics like impact of covid 19 on gdp and supply chain industry can be discussed with this completely editable template. It is available for immediate download depending on the needs and requirements of the user.
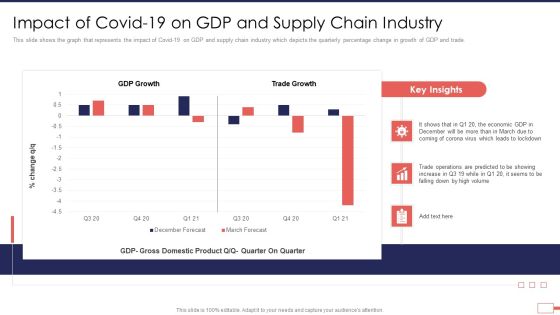
Iot Digital Twin Technology Post Covid Expenditure Management Impact Of Covid 19 On GDP And Supply Chain Industry Designs PDF
This slide shows the graph that represents the impact of Covid-19 on GDP and supply chain industry which depicts the quarterly percentage change in growth of GDP and trade. Deliver an awe inspiring pitch with this creative iot digital twin technology post covid expenditure management impact of covid 19 on gdp and supply chain industry designs pdf bundle. Topics like impact of covid 19 on gdp and supply chain industry can be discussed with this completely editable template. It is available for immediate download depending on the needs and requirements of the user.
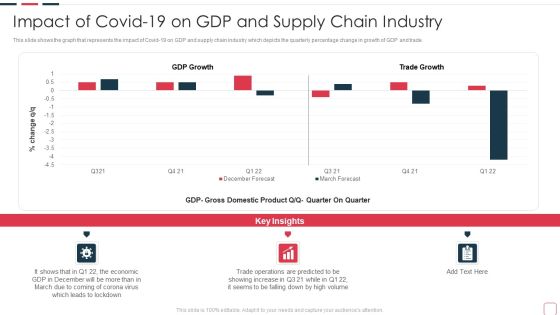
Price Benefit Internet Things Digital Twins Execution After Covid Impact Of Covid 19 On GDP Professional PDF
This slide shows the graph that represents the impact of Covid 19 on GDP and supply chain industry which depicts the quarterly percentage change in growth of GDP and trade. Deliver an awe inspiring pitch with this creative price benefit internet things digital twins execution after covid impact of covid 19 on gdp professional pdf bundle. Topics like impact of covid 19 on gdp and supply chain industry can be discussed with this completely editable template. It is available for immediate download depending on the needs and requirements of the user.
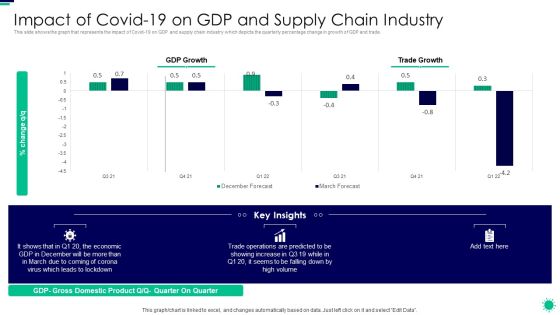
Purpose Digital Twin Internet Things Reducing Costs After COVID Era Impact Of Covid 19 On GDP Microsoft PDF
This slide shows the graph that represents the impact of Covid 19 on GDP and supply chain industry which depicts the quarterly percentage change in growth of GDP and trade. Deliver and pitch your topic in the best possible manner with this purpose digital twin internet things reducing costs after covid era impact of covid 19 on gdp microsoft pdf. Use them to share invaluable insights on impact of covid 19 on gdp and supply chain industry and impress your audience. This template can be altered and modified as per your expectations. So, grab it now.

Minimizing Operational Cost Through Iot Virtual Twins Implementation Impact Of Covid 19 On Healthcare Microsoft PDF
This slide shows the graph that represents the impact of Covid 19 on GDP and supply chain industry which depicts the quarterly percentage change in growth of GDP and trade. Deliver and pitch your topic in the best possible manner with this minimizing operational cost through iot virtual twins implementation impact of covid 19 on healthcare microsoft pdf. Use them to share invaluable insights on costs, pandemic, expenditures and impress your audience. This template can be altered and modified as per your expectations. So, grab it now.
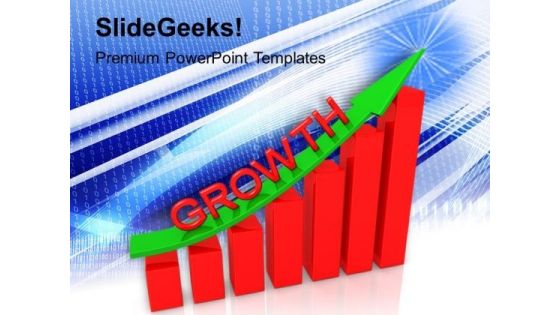
Business Graph Up PowerPoint Templates And PowerPoint Themes 1012
Business Graph Up PowerPoint Templates And PowerPoint Themes 1012-This PowerPoint Template shows the Bar Graph with increasing percentage which signifies the Financial Growth. The Template signifies the concept of Team Work, Team Leader etc. The structure of our templates allows you to effectively highlight the key issues concerning the growth of your business.-Business Graph Up PowerPoint Templates And PowerPoint Themes 1012-This PowerPoint template can be used for presentations relating to-Business graph, success, arrows, business, signs, shapes

Stack Of Dollar Notes And Gold Coins PowerPoint Template
Talking about investment is always boring and especially if somebody tries to make you understand the same, people often lose interest early. You have the same problem? Do not want to bore your audience? Choose this creatively designed PPT template having an image of piles of dollars and coins. You can use this design which clearly depicts that you may want to talk about the investment, money growth and much more. This slide can also be taken as to convey message about money planning, wealth management, strategies and planning. There are two icons present at the sides of the image. Percentage and growth icons both depict the returns or the profit you can get by investing your money at the right place. Icon, color and text are customizable. You can change them the way you want. So use this template and make your presentation interesting.
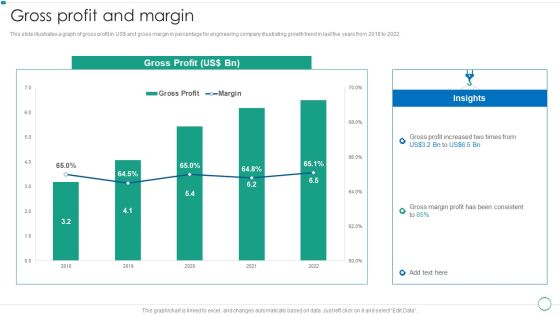
Real Estate Construction And Engineering Company Profile Gross Profit And Margin Demonstration PDF
This slide illustrates a graph of gross profit in US and gross margin in percentage for engineering company illustrating growth trend in last five years from 2018 to 2022.Deliver an awe inspiring pitch with this creative Real Estate Construction And Engineering Company Profile Gross Profit And Margin Demonstration PDF bundle. Topics like Gross Profit, Insights, Profit Increased can be discussed with this completely editable template. It is available for immediate download depending on the needs and requirements of the user.
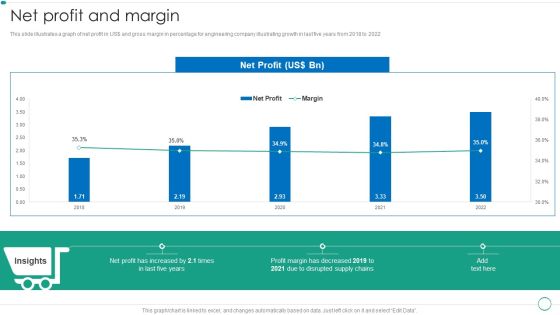
Real Estate Construction And Engineering Company Profile Net Profit And Margin Diagrams PDF
This slide illustrates a graph of net profit in US and gross margin in percentage for engineering company illustrating growth in last five years from 2018 to 2022.Deliver an awe inspiring pitch with this creative Real Estate Construction And Engineering Company Profile Net Profit And Margin Diagrams PDF bundle. Topics like Disrupted Supply, Profit Margin, Increased can be discussed with this completely editable template. It is available for immediate download depending on the needs and requirements of the user.
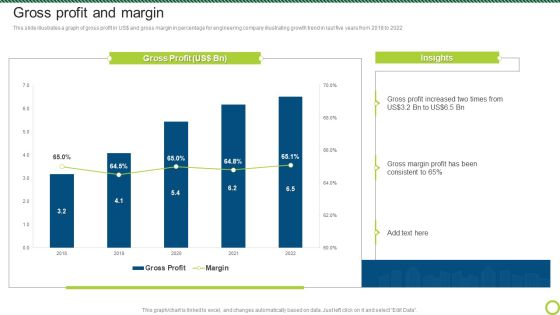
Engineering Solutions Company Detail Gross Profit And Margin Topics PDF
This slide illustrates a graph of gross profit in US and gross margin in percentage for engineering company illustrating growth trend in last five years from 2018 to 2022.Deliver and pitch your topic in the best possible manner with this Engineering Solutions Company Detail Gross Profit And Margin Topics PDF. Use them to share invaluable insights on Profit Increased, Gross Margin, Gross Profit and impress your audience. This template can be altered and modified as per your expectations. So, grab it now.
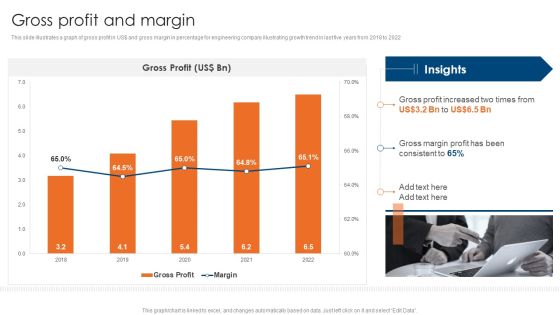
Engineering Consultancy Works Company Profile Gross Profit And Margin Infographics PDF
This slide illustrates a graph of gross profit in US doller and gross margin in percentage for engineering company illustrating growth trend in last five years from 2018 to 2022. Deliver an awe inspiring pitch with this creative Engineering Consultancy Works Company Profile Gross Profit And Margin Infographics PDF bundle. Topics like Gross Profit, Margin can be discussed with this completely editable template. It is available for immediate download depending on the needs and requirements of the user.

Engineering Consultancy Works Company Profile Net Profit And Margin Clipart PDF
This slide illustrates a graph of net profit in US doller and gross margin in percentage for engineering company illustrating growth in last five years from 2018 to 2022. Deliver an awe inspiring pitch with this creative Engineering Consultancy Works Company Profile Net Profit And Margin Clipart PDF bundle. Topics like Net Profit And Margin can be discussed with this completely editable template. It is available for immediate download depending on the needs and requirements of the user.

Engineering Solutions Company Detail Net Profit And Margin Graphics PDF
This slide illustrates a graph of net profit in US and gross margin in percentage for engineering company illustrating growth in last five years from 2018 to 2022.Deliver and pitch your topic in the best possible manner with this Engineering Solutions Company Detail Net Profit And Margin Graphics PDF. Use them to share invaluable insights on Margin Has Decreased, Due To Disrupted, Supply Chains and impress your audience. This template can be altered and modified as per your expectations. So, grab it now.

Emerging Technology Selling Forecasts Report Clipart PDF
This slide covers sales projections for consumer tech products. It includes unit sales for devices such wearable devices, smart speakers, smart home, 4K ultra televisions, virtual reality devices and drones along with percentage of unit sales growth and revenue projections. Showcasing this set of slides titled Emerging Technology Selling Forecasts Report Clipart PDF. The topics addressed in these templates are Emerging Technology Selling Forecasts, Market. All the content presented in this PPT design is completely editable. Download it and make adjustments in color, background, font etc. as per your unique business setting.

AI Investor Financing Pitch Deck The Company Purpose Ppt Ideas Display PDF
This template briefly explains the purpose of the company, why it exists, who it exists for and what is mission of the company. Its also includes revenue growth in percentage and, list of stakeholders etc. Presenting ai investor financing pitch deck the company purpose ppt ideas display pdf to provide visual cues and insights. Share and navigate important information on five stages that need your due attention. This template can be used to pitch topics like company mission statement, company vision statement, companys values. In addtion, this PPT design contains high resolution images, graphics, etc, that are easily editable and available for immediate download.

Artificial Intelligence Investor The Company Purpose Information PDF
This template briefly explains the purpose of the company, why it exists, who it exists for and what is mission of the company. Its also includes revenue growth in percentage and, list of stakeholders etc. This is a artificial intelligence investor the company purpose information pdf template with various stages. Focus and dispense information on one stages using this creative set, that comes with editable features. It contains large content boxes to add your information on topics like the company purpose. You can also showcase facts, figures, and other relevant content using this PPT layout. Grab it now.
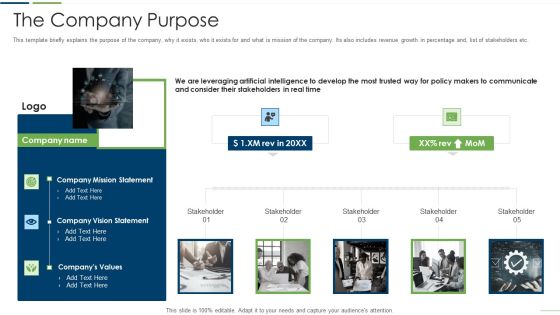
Technology Investor Financing Pitch Deck The Company Purpose Guidelines PDF
This template briefly explains the purpose of the company, why it exists, who it exists for and what is mission of the company. Its also includes revenue growth in percentage and, list of stakeholders etc. This is a technology investor financing pitch deck the company purpose guidelines pdf template with various stages. Focus and dispense information on five stages using this creative set, that comes with editable features. It contains large content boxes to add your information on topics like company mission statement, company vision statement, companys values. You can also showcase facts, figures, and other relevant content using this PPT layout. Grab it now.
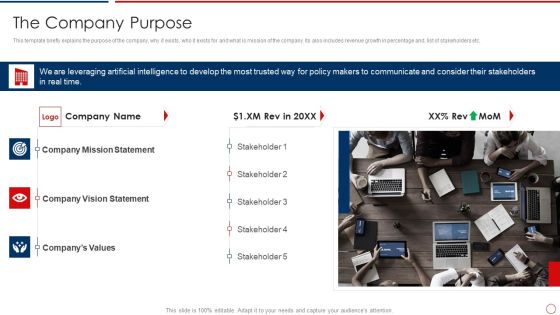
Machine Learning Investor Pitch Deck The Company Purpose Ppt Pictures Example Introduction PDF
This template briefly explains the purpose of the company, why it exists, who it exists for and what is mission of the company. Its also includes revenue growth in percentage and, list of stakeholders etc. This is a machine learning investor pitch deck the company purpose ppt pictures example introduction pdf template with various stages. Focus and dispense information on one stages using this creative set, that comes with editable features. It contains large content boxes to add your information on topics like the company purpose. You can also showcase facts, figures, and other relevant content using this PPT layout. Grab it now.

Contents Machine Learning Solution Pitch Deck The Company Purpose Inspiration PDF
This template briefly explains the purpose of the company, why it exists, who it exists for and what is mission of the company. Its also includes revenue growth in percentage and, list of stakeholders etc. Presenting Contents Machine Learning Solution Pitch Deck The Company Purpose Inspiration PDF to provide visual cues and insights. Share and navigate important information on one stage that need your due attention. This template can be used to pitch topics like Mission Statement, Vision Statement, Consider Stakeholders. In addtion, this PPT design contains high resolution images, graphics, etc, that are easily editable and available for immediate download.

Data Automation Solution Investor Funding Presentation Financial Projection Structure PDF
This slide demonstrates anticipated business revenue growth for next 4 years. It includes revenue in USdoller MM and year of growth along with growth percentage. Present like a pro with Data Automation Solution Investor Funding Presentation Financial Projection Structure PDF Create beautiful presentations together with your team, using our easy to use presentation slides. Share your ideas in real time and make changes on the fly by downloading our templates. So whether you are in the office, on the go, or in a remote location, you can stay in sync with your team and present your ideas with confidence. With Slidegeeks presentation got a whole lot easier. Grab these presentations today.
Bar Graph Business PowerPoint Templates And PowerPoint Themes 1012
Bar Graph Business PowerPoint Templates And PowerPoint Themes 1012-This PowerPoint Template shows the Bar Graph with increasing percentage which signifies the Financial Growth. The Template signifies the concept of business growth. The structure of our templates allows you to effectively highlight the key issues concerning the growth of your business. Our PPT images are so ideally designed that it reveals the very basis of our PPT template are an effective tool to make your clients understand.-Bar Graph Business PowerPoint Templates And PowerPoint Themes 1012-This PowerPoint template can be used for presentations relating to-Financial bar graph chart, technology, money, business, finance, marketing

Clustered Column Line Ppt PowerPoint Presentation Slide
This is a clustered column line ppt powerpoint presentation slide. This is a three stage process. The stages in this process are bar graph, growth, finance, product, sales in percentage.

Data Automation Solution Investor Funding Presentation Financial Performance Introduction PDF
Mentioned slide provides insights into increase business revenue over the years. It includes revenue in USdoller MM and year of growth along with growth percentage. From laying roadmaps to briefing everything in detail, our templates are perfect for you. You can set the stage with your presentation slides. All you have to do is download these easy to edit and customizable templates. Data Automation Solution Investor Funding Presentation Financial Performance Introduction PDF will help you deliver an outstanding performance that everyone would remember and praise you for. Do download this presentation today.
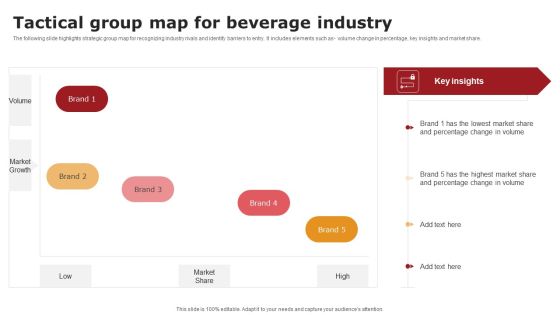
Tactical Group Map For Beverage Industry Slides PDF
The following slide highlights strategic group map for recognizing industry rivals and identify barriers to entry. It includes elements such as- volume change in percentage, key insights and market share. Showcasing this set of slides titled Tactical Group Map For Beverage Industry Slides PDF. The topics addressed in these templates are Market Growth, Market Share, Percentage Change. All the content presented in this PPT design is completely editable. Download it and make adjustments in color, background, font etc. as per your unique business setting.

Altcoins Portfolio Tracking Metrics Dashboard Ppt Inspiration Background Images PDF
This slide covers dashboard for tracking different cryptocurrencies value and growth. It includes metrics such as incomes and expenses, market values, cryptocurrency transactions history, overall growth percentages, exchange rates, etc. Showcasing this set of slides titled Altcoins Portfolio Tracking Metrics Dashboard Ppt Inspiration Background Images PDF. The topics addressed in these templates are Balance, 3 Currencies, Transactions. All the content presented in this PPT design is completely editable. Download it and make adjustments in color, background, font etc. as per your unique business setting.

Chat Messenger Investor Funding Elevator Pitch Deck Financial Projections Formats PDF
The slide outlines the financial projections of the company containing estimated revenue growth, expected percentage of decline in business expenditures, etc. Want to ace your presentation in front of a live audience Our Chat Messenger Investor Funding Elevator Pitch Deck Financial Projections Formats PDF can help you do that by engaging all the users towards you. Slidegeeks experts have put their efforts and expertise into creating these impeccable powerpoint presentations so that you can communicate your ideas clearly. Moreover, all the templates are customizable, and easy to edit and downloadable. Use these for both personal and commercial use.
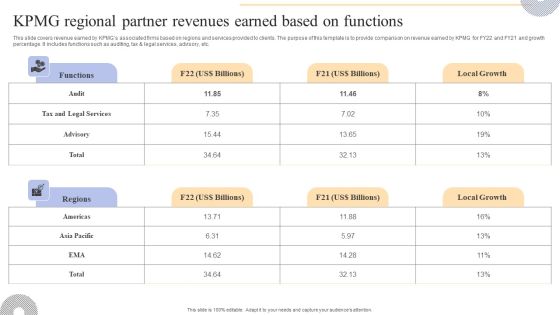
KPMG Regional Partner Revenues Earned Based On Functions Professional PDF
This slide covers revenue earned by KPMGs associated firms based on regions and services provided to clients. The purpose of this template is to provide comparison on revenue earned by KPMG for FY22 and FY21 and growth percentage. It includes functions such as auditing, tax and legal services, advisory, etc. Make sure to capture your audiences attention in your business displays with our gratis customizable KPMG Regional Partner Revenues Earned Based On Functions Professional PDF. These are great for business strategies, office conferences, capital raising or task suggestions. If you desire to acquire more customers for your tech business and ensure they stay satisfied, create your own sales presentation with these plain slides.
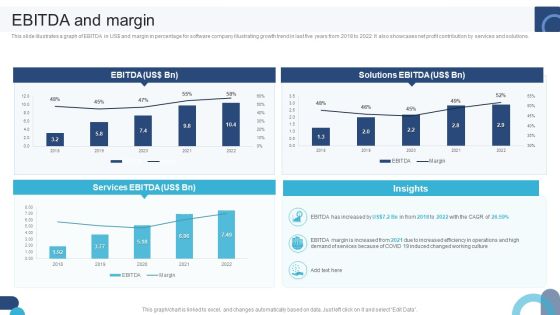
Digital Application Software Development Business Profile EBITDA And Margin Guidelines PDF
This slide illustrates a graph of EBITDA in US dollar and margin in percentage for software company illustrating growth trend in last five years from 2018 to 2022. It also showcases net profit contribution by services and solutions. If your project calls for a presentation, then Slidegeeks is your go-to partner because we have professionally designed, easy-to-edit templates that are perfect for any presentation. After downloading, you can easily edit Digital Application Software Development Business Profile EBITDA And Margin Guidelines PDF and make the changes accordingly. You can rearrange slides or fill them with different images. Check out all the handy templates
Net Profit And Margin IT Software Development Company Profile Icons PDF
This slide illustrates a graph of net profit in US doller and net margin in percentage for IT company illustrating growth trend in last five years from 2018 to 2022. It also showcases net profit contribution by services and solutions. Deliver an awe inspiring pitch with this creative Net Profit And Margin IT Software Development Company Profile Icons PDF bundle. Topics like Net Profit, Net Profit Margin can be discussed with this completely editable template. It is available for immediate download depending on the needs and requirements of the user.
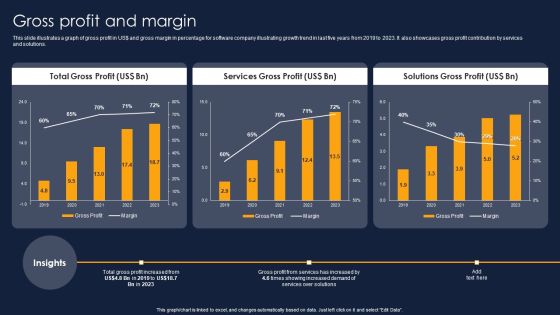
Gross Profit And Margin Financial Performance Report Of Software Firm Background PDF
This slide illustrates a graph of gross profit in US doller and gross margin in percentage for software company illustrating growth trend in last five years from 2019 to 2023. It also showcases gross profit contribution by services and solutions. From laying roadmaps to briefing everything in detail, our templates are perfect for you. You can set the stage with your presentation slides. All you have to do is download these easy-to-edit and customizable templates. Gross Profit And Margin Financial Performance Report Of Software Firm Background PDF will help you deliver an outstanding performance that everyone would remember and praise you for. Do download this presentation today.
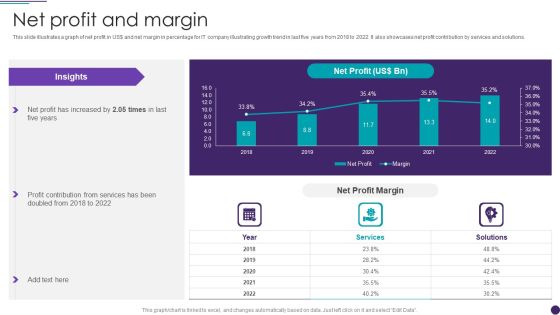
IT Services Business Profile Net Profit And Margin Sample PDF
This slide illustrates a graph of net profit in US doller and net margin in percentage for IT company illustrating growth trend in last five years from 2018 to 2022. It also showcases net profit contribution by services and solutions. Deliver and pitch your topic in the best possible manner with this IT Services Business Profile Net Profit And Margin Sample PDF. Use them to share invaluable insights on Services, Net Profit Margin and impress your audience. This template can be altered and modified as per your expectations. So, grab it now.

IT Services Business Profile Operating Profit And Margin Sample PDF
This slide illustrates a graph of operating profit in US doller and operating margin in percentage for IT company illustrating growth trend in last five years from 2018 to 2022. It also showcases operating profit contribution by services and solutions. Deliver an awe inspiring pitch with this creative IT Services Business Profile Operating Profit And Margin Sample PDF bundle. Topics like Operating Profit, Services can be discussed with this completely editable template. It is available for immediate download depending on the needs and requirements of the user.
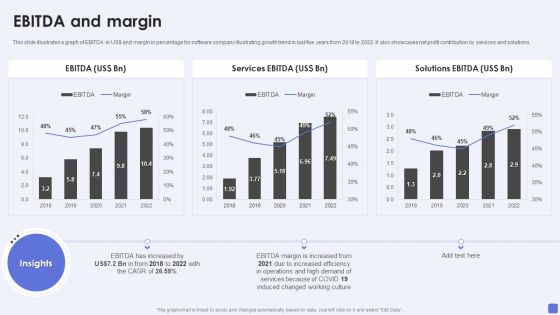
Software Services Business Profile EBITDA And Margin Ppt PowerPoint Presentation Gallery Slide Portrait PDF
This slide illustrates a graph of EBITDA in US dollar and margin in percentage for software company illustrating growth trend in last five years from 2018 to 2022. It also showcases net profit contribution by services and solutions. Deliver an awe inspiring pitch with this creative Software Services Business Profile EBITDA And Margin Ppt PowerPoint Presentation Gallery Slide Portrait PDF bundle. Topics like Services EB, Solutions EBITDA, EBITDA Margin can be discussed with this completely editable template. It is available for immediate download depending on the needs and requirements of the user.

Software Services Business Profile Gross Profit And Margin Ppt PowerPoint Presentation Gallery Templates PDF
This slide illustrates a graph of gross profit in US dollar and gross margin in percentage for software company illustrating growth trend in last five years from 2018 to 2022. It also showcases gross profit contribution by services and solutions. Deliver an awe inspiring pitch with this creative Software Services Business Profile Gross Profit And Margin Ppt PowerPoint Presentation Gallery Templates PDF bundle. Topics like Total Gross Profit, Services Gross Profit, Solutions Gross Profit can be discussed with this completely editable template. It is available for immediate download depending on the needs and requirements of the user.
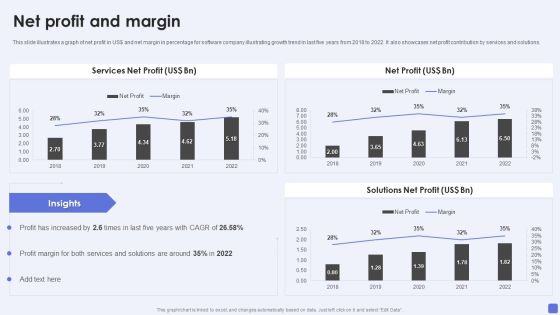
Software Services Business Profile Net Profit And Margin Ppt PowerPoint Presentation File Slides PDF
This slide illustrates a graph of net profit in US dollar and net margin in percentage for software company illustrating growth trend in last five years from 2018 to 2022. It also showcases net profit contribution by services and solutions. Deliver an awe inspiring pitch with this creative Software Services Business Profile Net Profit And Margin Ppt PowerPoint Presentation File Slides PDF bundle. Topics like Services Net Profit, Net Profit, Solutions Net Profit can be discussed with this completely editable template. It is available for immediate download depending on the needs and requirements of the user.

Software Services Business Profile Operating Profit And Margin Ppt PowerPoint Presentation Gallery Inspiration PDF
This slide illustrates a graph of operating profit in US dollar and operating margin in percentage for software company illustrating growth trend in last five years from 2018 to 2022. It also showcases operating profit contribution by services and solutions. Deliver and pitch your topic in the best possible manner with this Software Services Business Profile Operating Profit And Margin Ppt PowerPoint Presentation Gallery Inspiration PDF. Use them to share invaluable insights on Operating Profit, Services Operating Profit, Solutions Operating Profit and impress your audience. This template can be altered and modified as per your expectations. So, grab it now.

Software Products And Solutions Firm Details EBITDA And Margin Structure PDF
This slide illustrates a graph of EBITDA in US dollar and margin in percentage for software company illustrating growth trend in last five years from 2018 to 2022. It also showcases net profit contribution by services and solutions. Deliver an awe inspiring pitch with this creative Software Products And Solutions Firm Details EBITDA And Margin Structure PDF bundle. Topics like EBITDA, Services EBITDA, Solutions EBITDA, 2018 To 2022 can be discussed with this completely editable template. It is available for immediate download depending on the needs and requirements of the user.
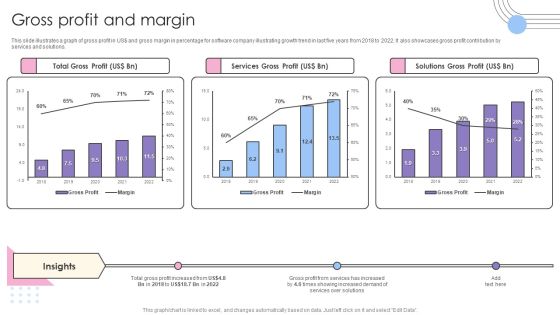
Software Products And Solutions Firm Details Gross Profit And Margin Pictures PDF
This slide illustrates a graph of gross profit in US dollar and gross margin in percentage for software company illustrating growth trend in last five years from 2018 to 2022. It also showcases gross profit contribution by services and solutions. Deliver and pitch your topic in the best possible manner with this Software Products And Solutions Firm Details Gross Profit And Margin Pictures PDF. Use them to share invaluable insights on Total Gross Profit, Services Gross Profit, Solutions Gross Profit and impress your audience. This template can be altered and modified as per your expectations. So, grab it now.

Software Products And Solutions Firm Details Net Profit And Margin Information PDF
This slide illustrates a graph of net profit in US dollar and net margin in percentage for software company illustrating growth trend in last five years from 2018 to 2022. It also showcases net profit contribution by services and solutions. Deliver and pitch your topic in the best possible manner with this Software Products And Solutions Firm Details Net Profit And Margin Information PDF. Use them to share invaluable insights on Net Profit, Services Net Profit, Solutions Net Profit and impress your audience. This template can be altered and modified as per your expectations. So, grab it now.

Software Products And Solutions Firm Details Operating Profit And Margin Mockup PDF
This slide illustrates a graph of operating profit in US dollar and operating margin in percentage for software company illustrating growth trend in last five years from 2018 to 2022. It also showcases operating profit contribution by services and solutions. Deliver an awe inspiring pitch with this creative Software Products And Solutions Firm Details Operating Profit And Margin Mockup PDF bundle. Topics like Operating Profit, Services Operating Profit, Solutions Operating Profit can be discussed with this completely editable template. It is available for immediate download depending on the needs and requirements of the user.

Business Software Development Company Profile EBITDA And Margin Summary PDF
This slide illustrates a graph of EBITDA in US dollar and margin in percentage for software company illustrating growth trend in last five years from 2018 to 2022. It also showcases net profit contribution by services and solutions. Deliver an awe inspiring pitch with this creative Business Software Development Company Profile EBITDA And Margin Summary PDF bundle. Topics like EBITDA, Services EBITDA, Solutions EBITDA can be discussed with this completely editable template. It is available for immediate download depending on the needs and requirements of the user.

Business Software Development Company Profile Gross Profit And Margin Microsoft PDF
This slide illustrates a graph of gross profit in US dollar and gross margin in percentage for software company illustrating growth trend in last five years from 2018 to 2022. It also showcases gross profit contribution by services and solutions. Deliver and pitch your topic in the best possible manner with this Business Software Development Company Profile Gross Profit And Margin Microsoft PDF. Use them to share invaluable insights on Total Gross Profit, Services Gross Profit, Solutions Gross Profit and impress your audience. This template can be altered and modified as per your expectations. So, grab it now.

Business Software Development Company Profile Net Profit And Margin Mockup PDF
This slide illustrates a graph of net profit in US dollar and net margin in percentage for software company illustrating growth trend in last five years from 2018 to 2022. It also showcases net profit contribution by services and solutions. Deliver an awe inspiring pitch with this creative Business Software Development Company Profile Net Profit And Margin Mockup PDF bundle. Topics like Net Profit, Services Net Profit, Solutions Net Profit can be discussed with this completely editable template. It is available for immediate download depending on the needs and requirements of the user.

Business Software Development Company Profile Operating Profit And Margin Summary PDF
This slide illustrates a graph of operating profit in US dollar and operating margin in percentage for software company illustrating growth trend in last five years from 2018 to 2022. It also showcases operating profit contribution by services and solutions. Deliver and pitch your topic in the best possible manner with this Business Software Development Company Profile Operating Profit And Margin Summary PDF. Use them to share invaluable insights on Operating Profit, Services Operating Profit, Solutions Operating Profit and impress your audience. This template can be altered and modified as per your expectations. So, grab it now.
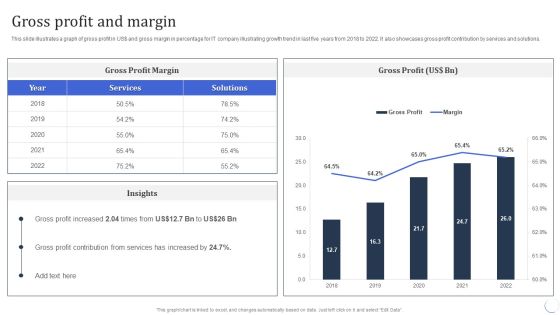
Infotech Solutions Research And Development Company Summary Gross Profit And Margin Ideas PDF
This slide illustrates a graph of gross profit in US dollar and gross margin in percentage for IT company illustrating growth trend in last five years from 2018 to 2022. It also showcases gross profit contribution by services and solutions. Deliver an awe inspiring pitch with this creative Infotech Solutions Research And Development Company Summary Gross Profit And Margin Ideas PDF bundle. Topics like Services, Gross Profit Margin can be discussed with this completely editable template. It is available for immediate download depending on the needs and requirements of the user.

Infotech Solutions Research And Development Company Summary Net Profit And Margin Information PDF
This slide illustrates a graph of net profit in US dollar and net margin in percentage for IT company illustrating growth trend in last five years from 2018 to 2022. It also showcases net profit contribution by services and solutions. Deliver and pitch your topic in the best possible manner with this Infotech Solutions Research And Development Company Summary Net Profit And Margin Information PDF. Use them to share invaluable insights on Profit Contribution, Services, Net Profit and impress your audience. This template can be altered and modified as per your expectations. So, grab it now.
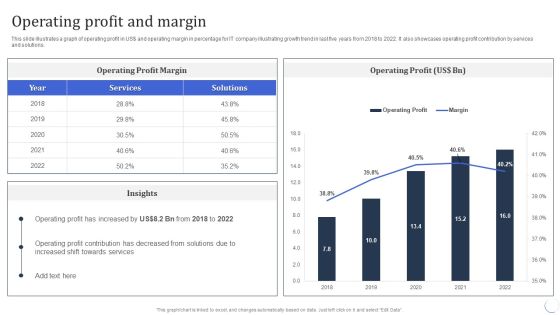
Infotech Solutions Research And Development Company Summary Operating Profit And Margin Download PDF
This slide illustrates a graph of operating profit in US dollar and operating margin in percentage for IT company illustrating growth trend in last five years from 2018 to 2022. It also showcases operating profit contribution by services and solutions. Deliver an awe inspiring pitch with this creative Infotech Solutions Research And Development Company Summary Operating Profit And Margin Download PDF bundle. Topics like Services, Operating Profit can be discussed with this completely editable template. It is available for immediate download depending on the needs and requirements of the user.

Pureprofile Business Overview EBITDA And Margin Ppt Gallery Sample PDF
This slide illustrates a graph of EBITDA in AUD and margin in percentage for Pureprofile company showing growth trend in last six years from 2016 to 2021. It also showcases key insights for EBITDA. Deliver and pitch your topic in the best possible manner with this Pureprofile Business Overview EBITDA And Margin Ppt Gallery Sample PDF. Use them to share invaluable insights on EBITDA Decreased, Business Operations, 2016 To 2021 and impress your audience. This template can be altered and modified as per your expectations. So, grab it now.

IT Application Services Company Outline Gross Profit And Margin Elements PDF
This slide illustrates a graph of gross profit in US dollar and gross margin in percentage for IT company illustrating growth trend in last five years from 2018 to 2022. It also showcases gross profit contribution by services and solutions. Deliver an awe inspiring pitch with this creative IT Application Services Company Outline Gross Profit And Margin Elements PDF bundle. Topics like Gross Profit Margin, Services can be discussed with this completely editable template. It is available for immediate download depending on the needs and requirements of the user.

IT Application Services Company Outline Net Profit And Margin Structure PDF
This slide illustrates a graph of net profit in US dollar and net margin in percentage for IT company illustrating growth trend in last five years from 2018 to 2022. It also showcases net profit contribution by services and solutions. Deliver and pitch your topic in the best possible manner with this IT Application Services Company Outline Net Profit And Margin Structure PDF. Use them to share invaluable insights on Net Profit Margin, Services, Margin and impress your audience. This template can be altered and modified as per your expectations. So, grab it now.
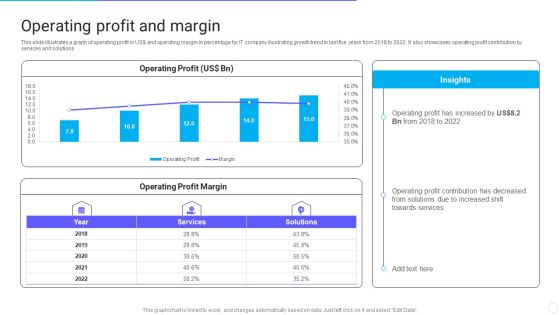
IT Application Services Company Outline Operating Profit And Margin Structure PDF
This slide illustrates a graph of operating profit in US dollar and operating margin in percentage for IT company illustrating growth trend in last five years from 2018 to 2022. It also showcases operating profit contribution by services and solutions. Deliver an awe inspiring pitch with this creative IT Application Services Company Outline Operating Profit And Margin Structure PDF bundle. Topics like Operating Profit And Margin can be discussed with this completely editable template. It is available for immediate download depending on the needs and requirements of the user.
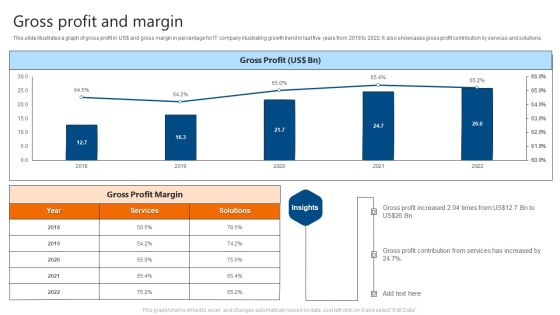
Gross Profit And Margin IT Software Development Company Profile Slides PDF
This slide illustrates a graph of gross profit in US doller and gross margin in percentage for IT company illustrating growth trend in last five years from 2018 to 2022. It also showcases gross profit contribution by services and solutions. Deliver and pitch your topic in the best possible manner with this Gross Profit And Margin IT Software Development Company Profile Slides PDF. Use them to share invaluable insights on Gross Profit, Margin and impress your audience. This template can be altered and modified as per your expectations. So, grab it now.

Operating Profit And Margin IT Software Development Company Profile Guidelines PDF
This slide illustrates a graph of operating profit in US doller and operating margin in percentage for IT company illustrating growth trend in last five years from 2018 to 2022. It also showcases operating profit contribution by services and solutions. Deliver and pitch your topic in the best possible manner with this Operating Profit And Margin IT Software Development Company Profile Guidelines PDF. Use them to share invaluable insights on Operating Profit, Operating Profit Margin and impress your audience. This template can be altered and modified as per your expectations. So, grab it now.
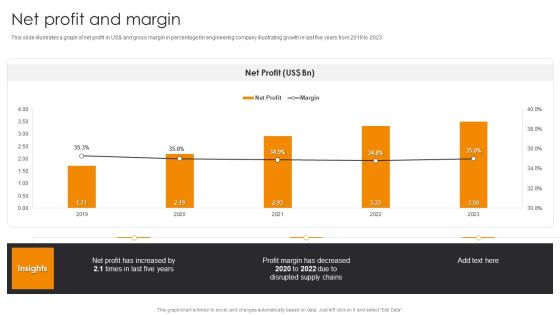
Net Profit And Margin Engineering Company Financial Analysis Report Background PDF
This slide illustrates a graph of net profit in US dollar and gross margin in percentage for engineering company illustrating growth in last five years from 2019 to 2023.Slidegeeks has constructed Net Profit And Margin Engineering Company Financial Analysis Report Background PDF after conducting extensive research and examination. These presentation templates are constantly being generated and modified based on user preferences and critiques from editors. Here, you will find the most attractive templates for a range of purposes while taking into account ratings and remarks from users regarding the content. This is an excellent jumping-off point to explore our content and will give new users an insight into our top-notch PowerPoint Templates.
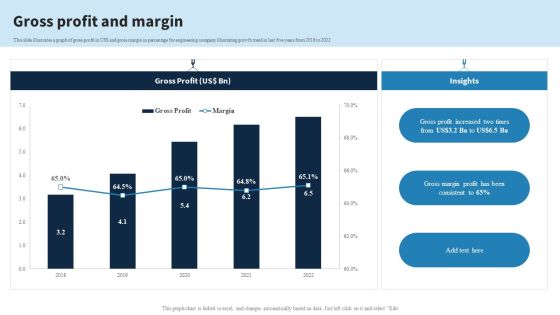
Engineering Services Company Report Gross Profit And Margin Ppt PowerPoint Presentation File Show PDF
This slide illustrates a graph of gross profit in US dollar and gross margin in percentage for engineering company illustrating growth trend in last five years from 2018 to 2022. From laying roadmaps to briefing everything in detail, our templates are perfect for you. You can set the stage with your presentation slides. All you have to do is download these easy-to-edit and customizable templates. Engineering Services Company Report Gross Profit And Margin Ppt PowerPoint Presentation File Show PDF will help you deliver an outstanding performance that everyone would remember and praise you for. Do download this presentation today.
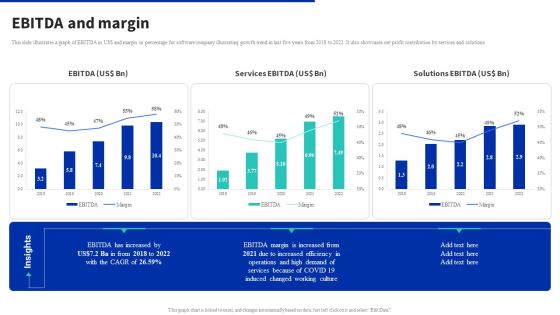
Digital Products Company Outline Ebitda And Margin Inspiration PDF
This slide illustrates a graph of EBITDA in US dollar and margin in percentage for software company illustrating growth trend in last five years from 2018 to 2022. It also showcases net profit contribution by services and solutions. Take your projects to the next level with our ultimate collection of Digital Products Company Outline Ebitda And Margin Inspiration PDF. Slidegeeks has designed a range of layouts that are perfect for representing task or activity duration, keeping track of all your deadlines at a glance. Tailor these designs to your exact needs and give them a truly corporate look with your own brand colors they will make your projects stand out from the rest.
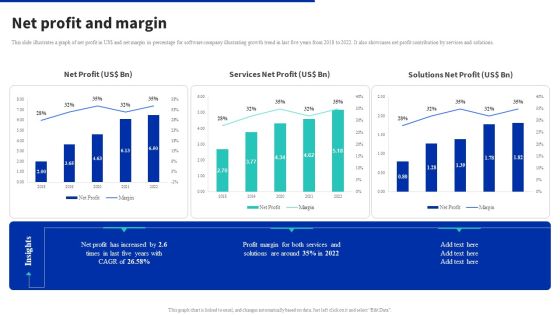
Digital Products Company Outline Net Profit And Margin Summary PDF
This slide illustrates a graph of net profit in US dollar and net margin in percentage for software company illustrating growth trend in last five years from 2018 to 2022. It also showcases net profit contribution by services and solutions. From laying roadmaps to briefing everything in detail, our templates are perfect for you. You can set the stage with your presentation slides. All you have to do is download these easy to edit and customizable templates. Digital Products Company Outline Net Profit And Margin Summary PDF will help you deliver an outstanding performance that everyone would remember and praise you for. Do download this presentation today.

Drone Service Company Investor Funding Elevator Pitch Deck Financial Projections Structure PDF
The slide outlines the financial projections of the company containing estimated revenue growth and expected percentage of decline in business expenditures. This modern and well arranged Drone Service Company Investor Funding Elevator Pitch Deck Financial Projections Structure PDF provides lots of creative possibilities. It is very simple to customize and edit with the Powerpoint Software. Just drag and drop your pictures into the shapes. All facets of this template can be edited with Powerpoint no extra software is necessary. Add your own material, put your images in the places assigned for them, adjust the colors, and then you can show your slides to the world, with an animated slide included.
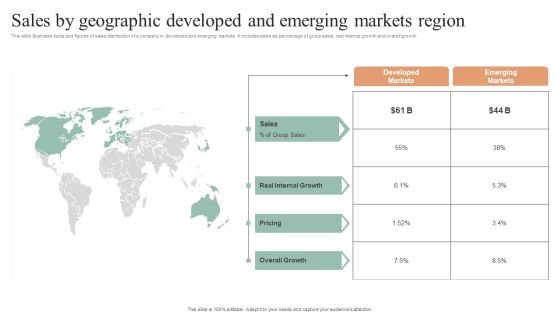
Sales By Geographic Developed And Emerging Markets Region Inspiration PDF
This slide illustrates facts and figures of sales distribution of a company in developed and emerging markets. It includes sales as percentage of group sales, real internal growth and overall growth. Presenting Sales By Geographic Developed And Emerging Markets Region Inspiration PDF to dispense important information. This template comprises one stages. It also presents valuable insights into the topics including Internal Growth, Sales, Pricing. This is a completely customizable PowerPoint theme that can be put to use immediately. So, download it and address the topic impactfully.
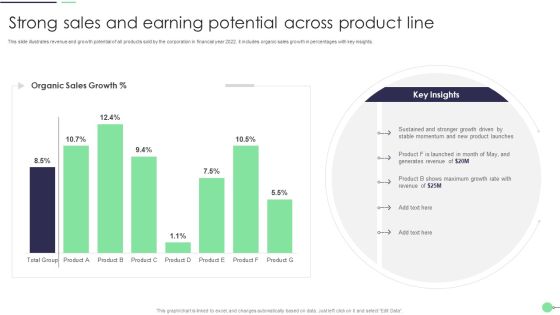
Strong Sales And Earning Potential Across Product Line Professional PDF
This slide illustrates revenue and growth potential of all products sold by the corporation in financial year 2022. it includes organic sales growth in percentages with key insights. Showcasing this set of slides titled Strong Sales And Earning Potential Across Product Line Professional PDF. The topics addressed in these templates are Product Launches, Generates Revenue, Growth Rate. All the content presented in this PPT design is completely editable. Download it and make adjustments in color, background, font etc. as per your unique business setting.
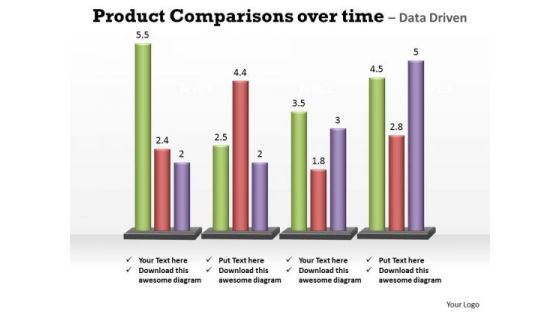
Business Marketing PowerPoint Templates Business Product Comparisons Over Time Ppt Slides
Business Marketing PowerPoint Templates Business product comparisons over time PPT Slides--This chart is useful for showing data changes over a period of time or for illustrating comparisons among items. -Business Marketing PowerPoint Templates Business product comparison over time PPT Slides-This ppt can be used for concepts relating to-chart,, graph, growth, investment, , market, percentage, , presentation report, results, statistics, stock, success and business.

Business Education PowerPoint Templates Business Bar Graph Data Driven Ppt Slides
Business Education PowerPoint Templates Business bar graph data driven PPT Slides-This PowerPoint slide is a data driven Columns Chart. The number of columns depend on the data.-Business Editable PowerPoint Templates Business beveled column chart PPT Slides-This ppt can be used for concepts relating to-chart,, graph, growth, investment, , market, percentage, , presentation report, results, statistics, stock, success and business.
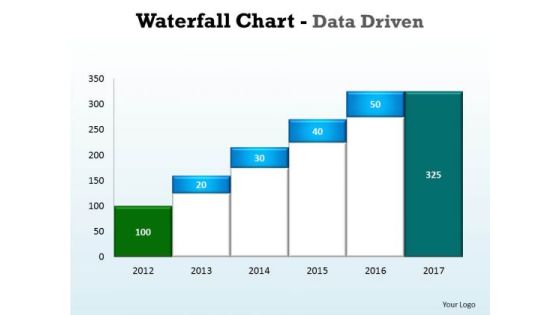
Business Graphic PowerPoint Templates Business Waterfall Chart Data Driven Ppt Slides
Business Graphic PowerPoint Templates Business waterfall chart data driven PPT Slides- This Water Fall chart can display continuous data over time, set against a common scale, and are therefore ideal for showing trends in data at equal intervals-This ppt can be used for concepts relating to-chart,, graph, growth, investment, , market, percentage, , presentation report, results, statistics, stock, success and business.

Business Editable PowerPoint Templates Business Beveled Column Chart Ppt Slides
Business Editable PowerPoint Templates Business beveled column chart PPT Slides-This PowerPoint slide is a data driven Columns Chart. The number of columns depend on the data.-Business Editable PowerPoint Templates Business beveled column chart PPT Slides-This ppt can be used for concepts relating to-chart,, graph, growth, investment, , market, percentage, , presentation report, results, statistics, stock, success and business.

Elements Of Extended Reality Global Market Overview Of Elements Extended Reality XR Download PDF
This slide explains global market overview of extended reality XR for the year 2021. It also gives the compound annual growth rate in terms of percentage form 2021 till 2029. Take your projects to the next level with our ultimate collection of Elements Of Extended Reality Global Market Overview Of Elements Extended Reality XR Download PDF. Slidegeeks has designed a range of layouts that are perfect for representing task or activity duration, keeping track of all your deadlines at a glance. Tailor these designs to your exact needs and give them a truly corporate look with your own brand colors they will make your projects stand out from the rest

Footwear And Accessories Business Pitch Deck Who Are Our Key Partners Guidelines PDF
This slide shows the key partnership which makes the business model work. Our key partners includes manufacturing partners, top athletes, etc. Presenting footwear and accessories business pitch deck who are our key partners guidelines pdf to provide visual cues and insights. Share and navigate important information on three stages that need your due attention. This template can be used to pitch topics like year on year market growth in percentage. In addtion, this PPT design contains high resolution images, graphics, etc, that are easily editable and available for immediate download.

Sales KPI Framework Ppt PowerPoint Presentation Gallery Show PDF
The mentioned slide depicts the sales key performance indicators framework. This includes monthly sales growth, monthly calls and emails, leads to sales percentage and average conversion time. Presenting sales kpi framework ppt powerpoint presentation gallery show pdf to dispense important information. This template comprises four stages. It also presents valuable insights into the topics including growth, sales, emails This is a completely customizable PowerPoint theme that can be put to use immediately. So, download it and address the topic impactfully.

Cashless Payment Strategies To Enhance Business Performance QR Code Payment Key Statistics Graphics PDF
Mentioned slide highlights key statistics associated with Quick Response QR code which can be used by businesses to go contactless. It includes key points such as QR code usage, transaction value, people usage percentage, QR payment growth in the US, etc. Slidegeeks is one of the best resources for PowerPoint templates. You can download easily and regulate Cashless Payment Strategies To Enhance Business Performance QR Code Payment Key Statistics Graphics PDF for your personal presentations from our wonderful collection. A few clicks is all it takes to discover and get the most relevant and appropriate templates. Use our Templates to add a unique zing and appeal to your presentation and meetings. All the slides are easy to edit and you can use them even for advertisement purposes.
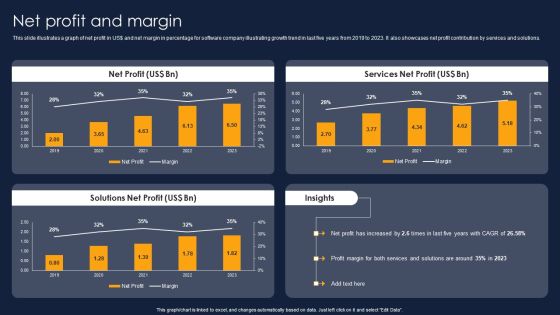
Net Profit And Margin Financial Performance Report Of Software Firm Demonstration PDF
This slide illustrates a graph of net profit in US doller and net margin in percentage for software company illustrating growth trend in last five years from 2019 to 2023. It also showcases net profit contribution by services and solutions. Present like a pro with Net Profit And Margin Financial Performance Report Of Software Firm Demonstration PDF Create beautiful presentations together with your team, using our easy-to-use presentation slides. Share your ideas in real-time and make changes on the fly by downloading our templates. So whether you are in the office, on the go, or in a remote location, you can stay in sync with your team and present your ideas with confidence. With Slidegeeks presentation got a whole lot easier. Grab these presentations today.

Engineering Services Company Report Net Profit And Margin Ppt PowerPoint Presentation File Aids PDF
This slide illustrates a graph of net profit in US dollar and gross margin in percentage for engineering company illustrating growth in last five years from 2018 to 2022. Present like a pro with Engineering Services Company Report Net Profit And Margin Ppt PowerPoint Presentation File Aids PDF Create beautiful presentations together with your team, using our easy-to-use presentation slides. Share your ideas in real-time and make changes on the fly by downloading our templates. So whether youre in the office, on the go, or in a remote location, you can stay in sync with your team and present your ideas with confidence. With Slidegeeks presentation got a whole lot easier. Grab these presentations today.

Digital Products Company Outline Operating Profit And Margin Structure PDF
This slide illustrates a graph of operating profit in US dollar and operating margin in percentage for software company illustrating growth trend in last five years from 2018 to 2022. It also showcases operating profit contribution by services and solutions. Present like a pro with Digital Products Company Outline Operating Profit And Margin Structure PDF Create beautiful presentations together with your team, using our easy to use presentation slides. Share your ideas in real time and make changes on the fly by downloading our templates. So whether you are in the office, on the go, or in a remote location, you can stay in sync with your team and present your ideas with confidence. With Slidegeeks presentation got a whole lot easier. Grab these presentations today.
Marketing Agency Company Outline EBITDA And Margin Icons PDF
This slide illustrates a graph of EBITDA in AUD and margin in percentage for Pureprofile company showing growth trend in last six years from 2016 to 2021. It also showcases key insights for EBITDA. Are you in need of a template that can accommodate all of your creative concepts This one is crafted professionally and can be altered to fit any style. Use it with Google Slides or PowerPoint. Include striking photographs, symbols, depictions, and other visuals. Fill, move around, or remove text boxes as desired. Test out color palettes and font mixtures. Edit and save your work, or work with colleagues. Download Marketing Agency Company Outline EBITDA And Margin Icons PDF and observe how to make your presentation outstanding. Give an impeccable presentation to your group and make your presentation unforgettable.
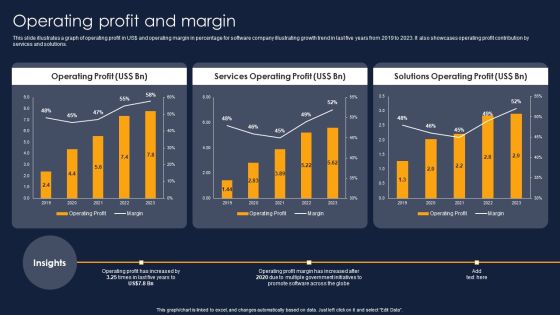
Operating Profit And Margin Financial Performance Report Of Software Firm Themes PDF
This slide illustrates a graph of operating profit in US doller and operating margin in percentage for software company illustrating growth trend in last five years from 2019 to 2023. It also showcases operating profit contribution by services and solutions. Slidegeeks is here to make your presentations a breeze with Operating Profit And Margin Financial Performance Report Of Software Firm Themes PDF With our easy-to-use and customizable templates, you can focus on delivering your ideas rather than worrying about formatting. With a variety of designs to choose from, you are sure to find one that suits your needs. And with animations and unique photos, illustrations, and fonts, you can make your presentation pop. So whether you are giving a sales pitch or presenting to the board, make sure to check out Slidegeeks first.
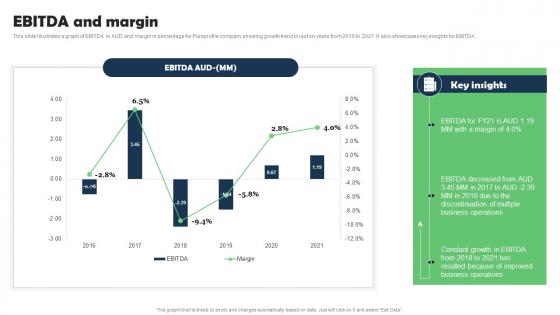
EBITDA And Margin Marketing Research Services Management Business Information Pdf
This slide illustrates a graph of EBITDA in AUD and margin in percentage for Pureprofile company showing growth trend in last six years from 2016 to 2021. It also showcases key insights for EBITDA. Whether you have daily or monthly meetings, a brilliant presentation is necessary. EBITDA And Margin Marketing Research Services Management Business Information Pdf can be your best option for delivering a presentation. Represent everything in detail using EBITDA And Margin Marketing Research Services Management Business Information Pdf and make yourself stand out in meetings. The template is versatile and follows a structure that will cater to your requirements. All the templates prepared by Slidegeeks are easy to download and edit. Our research experts have taken care of the corporate themes as well. So, give it a try and see the results.

Data Driven Marketing Solutions Firm Company Profile EBITDA And Margin Download PDF
This slide illustrates a graph of EBITDA in AUD and margin in percentage for Pureprofile company showing growth trend in last six years from 2018 to 2023. It also showcases key insights for EBITDA. Whether you have daily or monthly meetings, a brilliant presentation is necessary. Data Driven Marketing Solutions Firm Company Profile EBITDA And Margin Download PDF can be your best option for delivering a presentation. Represent everything in detail using Data Driven Marketing Solutions Firm Company Profile EBITDA And Margin Download PDF and make yourself stand out in meetings. The template is versatile and follows a structure that will cater to your requirements. All the templates prepared by Slidegeeks are easy to download and edit. Our research experts have taken care of the corporate themes as well. So, give it a try and see the results.
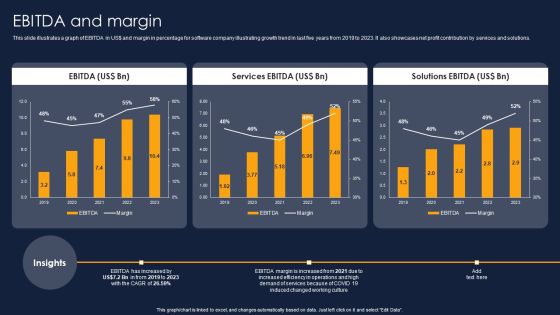
Ebitda And Margin Financial Performance Report Of Software Firm Pictures PDF
This slide illustrates a graph of EBITDA in US doller and margin in percentage for software company illustrating growth trend in last five years from 2019 to 2023. It also showcases net profit contribution by services and solutions. Get a simple yet stunning designed Ebitda And Margin Financial Performance Report Of Software Firm Pictures PDF. It is the best one to establish the tone in your meetings. It is an excellent way to make your presentations highly effective. So, download this PPT today from Slidegeeks and see the positive impacts. Our easy-to-edit Ebitda And Margin Financial Performance Report Of Software Firm Pictures PDF can be your go-to option for all upcoming conferences and meetings. So, what are you waiting for Grab this template today.

Digital Application Software Development Business Profile Gross Profit And Margin Pictures PDF
This slide illustrates a graph of gross profit in US dollar and gross margin in percentage for software company illustrating growth trend in last five years from 2018 to 2022. It also showcases gross profit contribution by services and solutions. Formulating a presentation can take up a lot of effort and time, so the content and message should always be the primary focus. The visuals of the PowerPoint can enhance the presenters message, so our Digital Application Software Development Business Profile Gross Profit And Margin Pictures PDF was created to help save time. Instead of worrying about the design, the presenter can concentrate on the message while our designers work on creating the ideal templates for whatever situation is needed. Slidegeeks has experts for everything from amazing designs to valuable content, we have put everything into Digital Application Software Development Business Profile Gross Profit And Margin Pictures PDF.

Digital Application Software Development Business Profile Net Profit And Margin Information PDF
This slide illustrates a graph of net profit in US dollar and net margin in percentage for software company illustrating growth trend in last five years from 2018 to 2022. It also showcases net profit contribution by services and solutions. Welcome to our selection of the Digital Application Software Development Business Profile Net Profit And Margin Information PDF. These are designed to help you showcase your creativity and bring your sphere to life. Planning and Innovation are essential for any business that is just starting out. This collection contains the designs that you need for your everyday presentations. All of our PowerPoints are 100 percent editable, so you can customize them to suit your needs. This multi-purpose template can be used in various situations. Grab these presentation templates today.
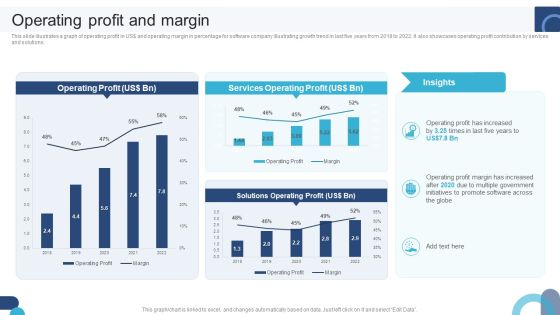
Digital Application Software Development Business Profile Operating Profit And Margin Professional PDF
This slide illustrates a graph of operating profit in US dollar and operating margin in percentage for software company illustrating growth trend in last five years from 2018 to 2022. It also showcases operating profit contribution by services and solutions. Explore a selection of the finest Digital Application Software Development Business Profile Operating Profit And Margin Professional PDF here. With a plethora of professionally designed and pre-made slide templates, you can quickly and easily find the right one for your upcoming presentation. You can use our Digital Application Software Development Business Profile Operating Profit And Margin Professional PDF to effectively convey your message to a wider audience. Slidegeeks has done a lot of research before preparing these presentation templates. The content can be personalized and the slides are highly editable. Grab templates today from Slidegeeks.
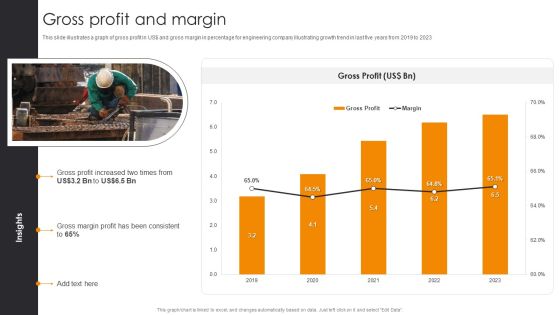
Gross Profit And Margin Engineering Company Financial Analysis Report Rules PDF
This slide illustrates a graph of gross profit in US dollar and gross margin in percentage for engineering company illustrating growth trend in last five years from 2019 to 2023. Retrieve professionally designed Gross Profit And Margin Engineering Company Financial Analysis Report Rules PDF to effectively convey your message and captivate your listeners. Save time by selecting pre-made slideshows that are appropriate for various topics, from business to educational purposes. These themes come in many different styles, from creative to corporate, and all of them are easily adjustable and can be edited quickly. Access them as PowerPoint templates or as Google Slides themes. You do not have to go on a hunt for the perfect presentation because Slidegeeks got you covered from everywhere.

IT Firm Financial Statement Gross Profit And Margin Summary PDF
This slide illustrates a graph of gross profit in US dollar and gross margin in percentage for IT company illustrating growth trend in last five years from 2019 to 2023. It also showcases gross profit contribution by services and solutions. Boost your pitch with our creative IT Firm Financial Statement Gross Profit And Margin Summary PDF. Deliver an awe inspiring pitch that will mesmerize everyone. Using these presentation templates you will surely catch everyones attention. You can browse the ppts collection on our website. We have researchers who are experts at creating the right content for the templates. So you do not have to invest time in any additional work. Just grab the template now and use them.
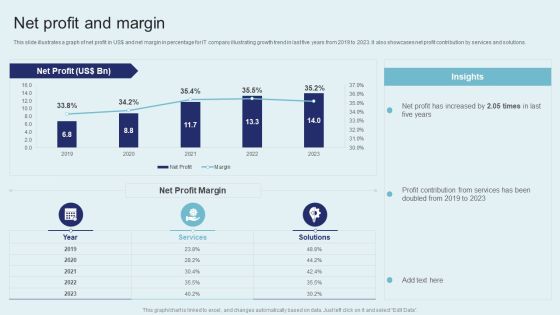
IT Firm Financial Statement Net Profit And Margin Slides PDF
This slide illustrates a graph of net profit in US dollar and net margin in percentage for IT company illustrating growth trend in last five years from 2019 to 2023. It also showcases net profit contribution by services and solutions. Do you have to make sure that everyone on your team knows about any specific topic I yes, then you should give IT Firm Financial Statement Net Profit And Margin Slides PDF a try. Our experts have put a lot of knowledge and effort into creating this impeccable IT Firm Financial Statement Net Profit And Margin Slides PDF. You can use this template for your upcoming presentations, as the slides are perfect to represent even the tiniest detail. You can download these templates from the Slidegeeks website and these are easy to edit. So grab these today.
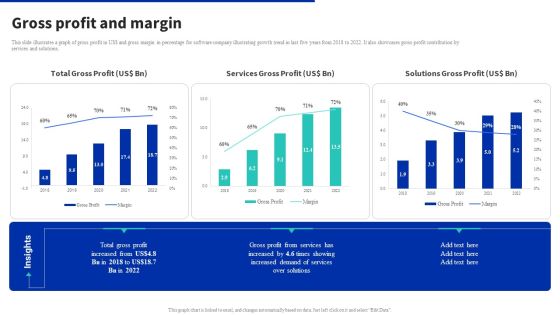
Digital Products Company Outline Gross Profit And Margin Professional PDF
This slide illustrates a graph of gross profit in US dollar and gross margin in percentage for software company illustrating growth trend in last five years from 2018 to 2022. It also showcases gross profit contribution by services and solutions. Get a simple yet stunning designed Digital Products Company Outline Gross Profit And Margin Professional PDF. It is the best one to establish the tone in your meetings. It is an excellent way to make your presentations highly effective. So, download this PPT today from Slidegeeks and see the positive impacts. Our easy to edit Digital Products Company Outline Gross Profit And Margin Professional PDF can be your go to option for all upcoming conferences and meetings. So, what are you waiting for Grab this template today.

6 Months Company Revenue Comparison Dashboard Graphics PDF
This slide showcases the half yearly profit comparison dashboard. It also includes comparison kp is such as monthly profit, profit margin growth, branch profit percentage, top 3 profitable products, etc. Showcasing this set of slides titled 6 Months Company Revenue Comparison Dashboard Graphics PDF. The topics addressed in these templates are Growth Rate, Overall Profit Margin, Branch Profit. All the content presented in this PPT design is completely editable. Download it and make adjustments in color, background, font etc. as per your unique business setting.
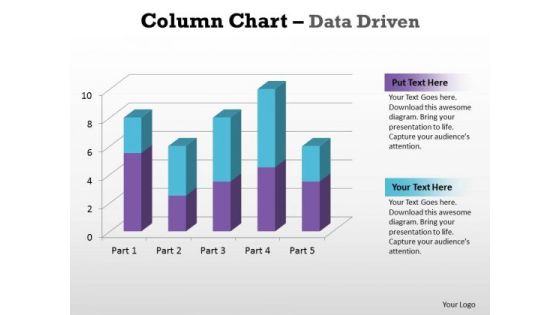
Business Graphic PowerPoint Templates Business Column Chart Data Driven Ppt Slides
Business Graphic PowerPoint Templates Business column chart data driven PPT Slides-With help of visual aids like this template you can capture the attention of the audience and make the presentation very interactive and lively.-Business Graphic PowerPoint Templates Business column chart data driven PPT Slides-This ppt can be used for concepts relating to-chart,, graph, growth, investment, , market, percentage, , presentation report, results, statistics, stock, success and business.

Video Promotion Service Investor Funding Elevator Pitch Deck Financial Performance Professional PDF
The slide mentions the revenue, run rate and margin percentage of the company indicating the growth in organizations financial performance Slidegeeks is here to make your presentations a breeze with Video Promotion Service Investor Funding Elevator Pitch Deck Financial Performance Professional PDF With our easy to use and customizable templates, you can focus on delivering your ideas rather than worrying about formatting. With a variety of designs to choose from, you are sure to find one that suits your needs. And with animations and unique photos, illustrations, and fonts, you can make your presentation pop. So whether you are giving a sales pitch or presenting to the board, make sure to check out Slidegeeks first.

Success Graph Finance PowerPoint Templates And PowerPoint Themes 1012
Success Graph Finance PowerPoint Templates And PowerPoint Themes 1012-The Above PowerPoint Template shows the Bar graph of Several Components showing the Percentage of each component. It signifies the Concept of Growth, Finance, Investment etc. Prove how they mesh to motivate the company team and provide the steam to activate the composite machine. You have noted down some very fruitful ideas that have occurred to you at random moments. Organize them all and prioritize them effectively.-Success Graph Finance PowerPoint Templates And PowerPoint Themes 1012-This PowerPoint template can be used for presentations relating to-Business growth, Business, Finance, Marketing, Success, Symbol

IT Firm Financial Statement Operating Profit And Margin Formats PDF
This slide illustrates a graph of operating profit in US dollar and operating margin in percentage for IT company IT Firm Fina growth trend in last five years from 2019 to 2023. It also showcases operating profit contribution by services and solutions. Get a simple yet stunning designed IT Firm Financial Statement Operating Profit And Margin Formats PDF. It is the best one to establish the tone in your meetings. It is an excellent way to make your presentations highly effective. So, download this PPT today from Slidegeeks and see the positive impacts. Our easy to edit IT Firm Financial Statement Operating Profit And Margin Formats PDF can be your go to option for all upcoming conferences and meetings. So, what are you waiting for Grab this template today.

Recent Technologies In IT Industry Global Market Overview Of Extended Reality XR Pictures PDF
This slide explains global market overview of extended reality XR for the year 2021. It also gives the compound annual growth rate in terms of percentage form 2021 till 2029. Welcome to our selection of the Recent Technologies In IT Industry Global Market Overview Of Extended Reality XR Pictures PDF. These are designed to help you showcase your creativity and bring your sphere to life. Planning and Innovation are essential for any business that is just starting out. This collection contains the designs that you need for your everyday presentations. All of our PowerPoints are 100 percent editable, so you can customize them to suit your needs. This multi purpose template can be used in various situations. Grab these presentation templates today.

Bar Graph To Compare Business Data PowerPoint Slides
This is the slide which can solve many purposes of yours. Be it growth in your company, need to show your company?s status in the market as compared to others, or how your business has improved so far. An ideal PowerPoint template to display all of these. You can easily use this graph to show the growth of your company using the percentage icons. You can use this visual to show the status of your company in the market in comparison with others. You can edit the icons and replace them with the logo of your company and the others. You can also show it to your colleagues how your company has built its image in the market or how it has improved over the time. A perfect bar graph image which needs to be included in your business PPT presentations.
Business Editable PowerPoint Templates Business 3d Jigsaw Circular Pie Chart Ppt Slides
Business Chart PowerPoint Templates Business 3d jigsaw circular pie chart PPT Slides-PowerPoint Template shows Pie Chart with four sectors \\ Part of a series. -Business Chart PowerPoint Templates Business 3d jigsaw circular pie chart PPT Slides-This ppt can be used for concepts relating to-chart, circular, graph, growth, investment, isolated, market, numbers, percentage, pie, piece, plan, presentation, render, report, results, slice, statistics, stock, success and business.
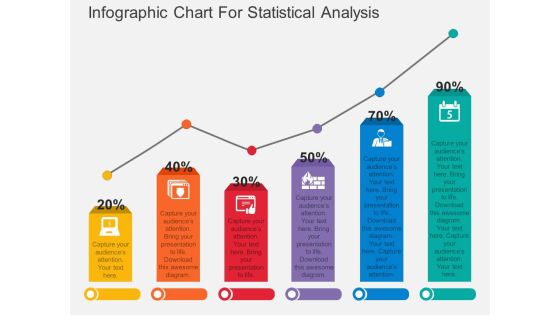
Infographic Chart For Statistical Analysis Powerpoint Template
Download this exclusive business diagram to display statistical analysis. This PowerPoint template contains bar chart with percentage values. This diagram is useful for business presentations.

Employee Turnover Ppt PowerPoint Presentation Designs
This is a employee turnover ppt powerpoint presentation designs. This is a five stage process. The stages in this process are voluntary, percentage of turnover, total.
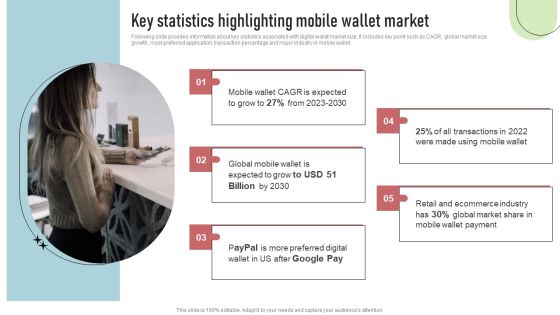
Cashless Payment Strategies To Enhance Business Performance Key Statistics Highlighting Mobile Wallet Market Formats PDF
Following slide provides information about key statistics associated with digital wallet market size. It includes key point such as CAGR, global market size growth, most preferred application, transaction percentage and major industry in mobile wallet. Slidegeeks has constructed Cashless Payment Strategies To Enhance Business Performance Key Statistics Highlighting Mobile Wallet Market Formats PDF after conducting extensive research and examination. These presentation templates are constantly being generated and modified based on user preferences and critiques from editors. Here, you will find the most attractive templates for a range of purposes while taking into account ratings and remarks from users regarding the content. This is an excellent jumping-off point to explore our content and will give new users an insight into our top-notch PowerPoint Templates.

Summary Of Cloud ERP System Framework Key ERP System Framework Facts And Statistics On A Global Scale Sample PDF
This slide shows the some of the general ERP System Framework Facts and Statistics on a Global Scale such as expected revenue growth in the global ERP system market, percentage of companies that consider ERP implementation their priority investment, benefits that businesses said they gained from an efficient ERP system, top problems during ERP implementation etcPresenting Summary Of Cloud ERP System Framework Key ERP System Framework Facts And Statistics On A Global Scale Sample PDF to provide visual cues and insights. Share and navigate important information on six stages that need your due attention. This template can be used to pitch topics like Increased Collaboration, Inadequate Business, System Implementation In addtion, this PPT design contains high resolution images, graphics, etc, that are easily editable and available for immediate download.
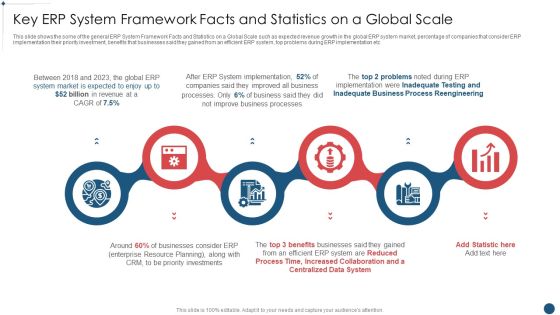
Enterprise Resource Planning System Framework Key Erp System Framework Facts And Statistics On A Global Scale Download PDF
This slide shows the some of the general ERP System Framework Facts and Statistics on a Global Scale such as expected revenue growth in the global ERP system market, percentage of companies that consider ERP implementation their priority investment, benefits that businesses said they gained from an efficient ERP system, top problems during ERP implementation etc Presenting Enterprise Resource Planning System Framework Key Erp System Framework Facts And Statistics On A Global Scale Download PDF to provide visual cues and insights. Share and navigate important information on six stages that need your due attention. This template can be used to pitch topics like System Market Is Expected, Inadequate Business, Process Reengineering In addtion, this PPT design contains high resolution images, graphics, etc, that are easily editable and available for immediate download.

Key ERP System Framework Facts And Statistics On A Global Scale Ppt Slides Clipart Images PDF
This slide shows the some of the general ERP System Framework Facts and Statistics on a Global Scale such as expected revenue growth in the global ERP system market, percentage of companies that consider ERP implementation their priority investment, benefits that businesses said they gained from an efficient ERP system, top problems during ERP implementation etc. Presenting key erp system framework facts and statistics on a global scale ppt slides clipart images pdf to provide visual cues and insights. Share and navigate important information on six stages that need your due attention. This template can be used to pitch topics like enterprise resource, priority investments, system implementation, revenue. In addtion, this PPT design contains high resolution images, graphics, etc, that are easily editable and available for immediate download.
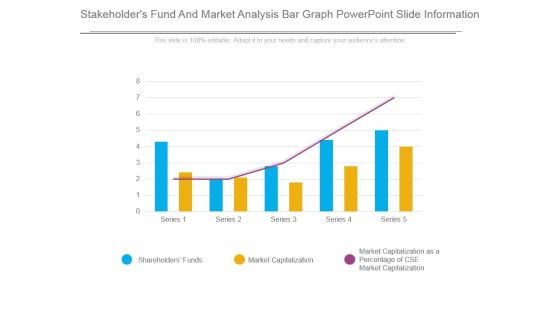
Stakeholders Fund And Market Analysis Bar Graph Powerpoint Slide Information
This is a stakeholders fund and market analysis bar graph powerpoint slide information. This is a five stage process. The stages in this process are shareholders funds, market capitalization, market capitalization as a percentage of cse market capitalization.
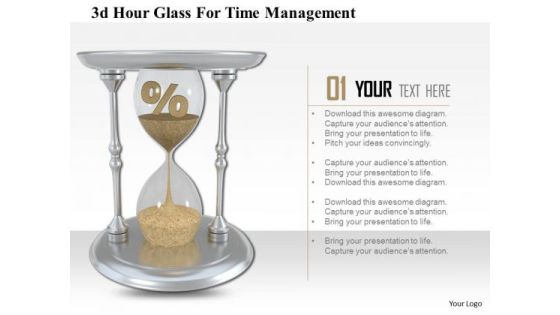
Stock Photo 3d Hour Glass For Time Management Image Graphics For PowerPoint Slide
This image slide displays hourglass with percentage symbol. This image slide may be used to display the time management and profit percentage. Make outstanding presentations using this image.

Banking Concept Financial PowerPoint Templates And PowerPoint Backgrounds 0211
Microsoft PowerPoint Template and Background with money and percentage symbol in hands

Net Promoter Score Passives Ppt Powerpoint Show
This is a net promoter score passives ppt powerpoint show. This is a three stage process. The stages in this process are promoters, passives, detractors, nps, percentage of promoters, likeness to recommend others, percentage of detractors.

Net Promoter Score Value Diagram Example Of Ppt
This is a net promoter score value diagram example of ppt. This is a ten stage process. The stages in this process are nps, percentage of promoters, percentage of detractors, detractors, passive, promoter, not at all likely, natural, extremely likely.

Sample Of Net Promoter Index Diagram Powerpoint Slide Backgrounds
This is a sample of net promoter index diagram powerpoint slide backgrounds. This is a ten stage process. The stages in this process are not at all likely, neutral, extremely likely, detractors, passives, promoters, nps, percentage detractors, percentage of promoters.
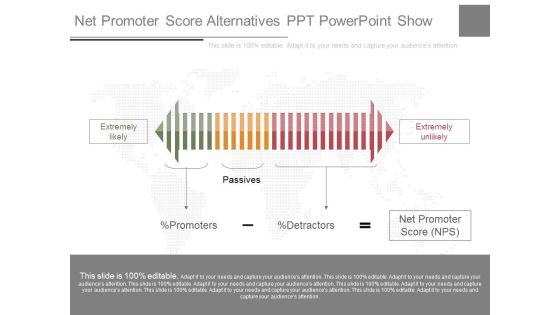
Net Promoter Score Alternatives Ppt Powerpoint Show
This is a net promoter score alternatives ppt powerpoint show. This is a one stage process. The stages in this process are extremely likely, passives, extremely unlikely, percentage of promoters, percentage of detractors, net promoter score nps.
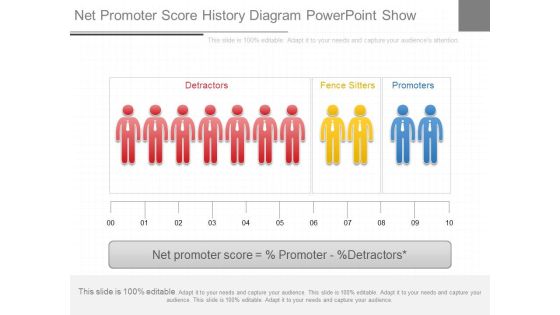
Net Promoter Score History Diagram Powerpoint Show
This is a net promoter score history diagram powerpoint show. This is a ten stage process. The stages in this process are detractors, fence sitters, promoters, net promoter score, percentage promoter, percentage detractors.
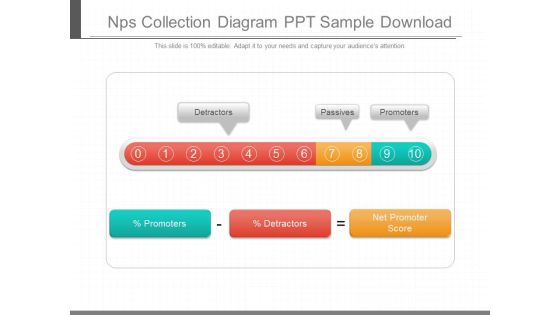
Nps Collection Diagram Ppt Sample Download
This is a nps collection diagram ppt sample download. This is a ten stage process. The stages in this process are detractors, passives, promoters, percentage promoters, percentage detractors, net promoter score.
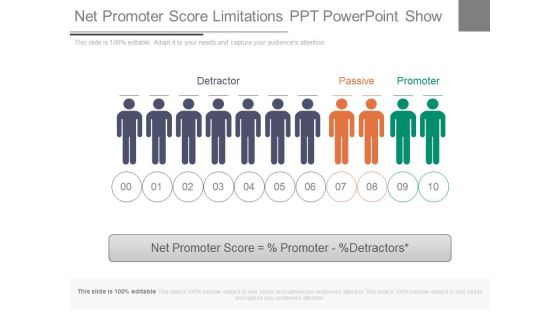
Net Promoter Score Limitations Ppt Powerpoint Show
This is a net promoter score limitations ppt powerpoint show. This is a ten stage process. The stages in this process are detractor, passive, promoter, net promoter score percentage promoter percentage detractors.

Net Promoter Score Report Analysis Ppt Powerpoint Show
This is a net promoter score report analysis ppt powerpoint show. This is a three stage process. The stages in this process are detractors, passives, promoters, your nps, nps, percentage promoters, percentage detractors.
Business Graph With Dollars Success PowerPoint Templates And PowerPoint Backgrounds 0711
Microsoft PowerPoint Template and Background with wooden graphic showing the percentage increase that leads to higher costs

Business Graph With Dollars Success PowerPoint Themes And PowerPoint Slides 0711
Microsoft PowerPoint Theme and Slide with wooden graphic showing the percentage increase that leads to higher costs
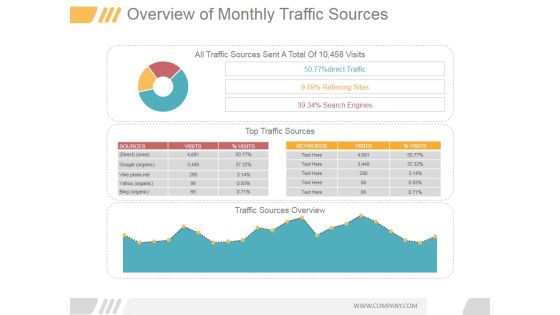
Overview Of Monthly Traffic Sources Ppt PowerPoint Presentation Visuals
This is a overview of monthly traffic sources ppt powerpoint presentation visuals. This is a three stage process. The stages in this process are all traffic sources sent a total of 10 458 visits, 50 77 percentage direct traffic, 9 89 percentage referring sites, 39 34 percentage search engines, sources, visits.
Employee Taking Challenging Tasks Vector Icon Ppt PowerPoint Presentation Model Layout PDF
Presenting employee taking challenging tasks vector icon ppt powerpoint presentation model layout pdf to dispense important information. This template comprises three stages. It also presents valuable insights into the topics including employee taking challenging tasks vector icon. This is a completely customizable PowerPoint theme that can be put to use immediately. So, download it and address the topic impactfully.

Financing For Nonprofit Business With Task Management Ppt Slides Aids PDF
Presenting financing for nonprofit business with task management ppt slides aids pdf. to dispense important information. This template comprises four stages. It also presents valuable insights into the topics including learning and prototypying, information. This is a completely customizable PowerPoint theme that can be put to use immediately. So, download it and address the topic impactfully.
