Percentage Growth
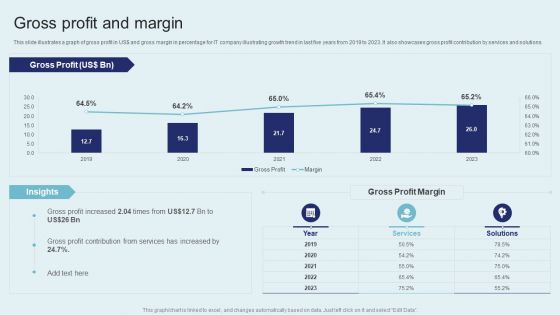
IT Firm Financial Statement Gross Profit And Margin Summary PDF
This slide illustrates a graph of gross profit in US dollar and gross margin in percentage for IT company illustrating growth trend in last five years from 2019 to 2023. It also showcases gross profit contribution by services and solutions. Boost your pitch with our creative IT Firm Financial Statement Gross Profit And Margin Summary PDF. Deliver an awe inspiring pitch that will mesmerize everyone. Using these presentation templates you will surely catch everyones attention. You can browse the ppts collection on our website. We have researchers who are experts at creating the right content for the templates. So you do not have to invest time in any additional work. Just grab the template now and use them.

IT Firm Financial Statement Net Profit And Margin Slides PDF
This slide illustrates a graph of net profit in US dollar and net margin in percentage for IT company illustrating growth trend in last five years from 2019 to 2023. It also showcases net profit contribution by services and solutions. Do you have to make sure that everyone on your team knows about any specific topic I yes, then you should give IT Firm Financial Statement Net Profit And Margin Slides PDF a try. Our experts have put a lot of knowledge and effort into creating this impeccable IT Firm Financial Statement Net Profit And Margin Slides PDF. You can use this template for your upcoming presentations, as the slides are perfect to represent even the tiniest detail. You can download these templates from the Slidegeeks website and these are easy to edit. So grab these today.
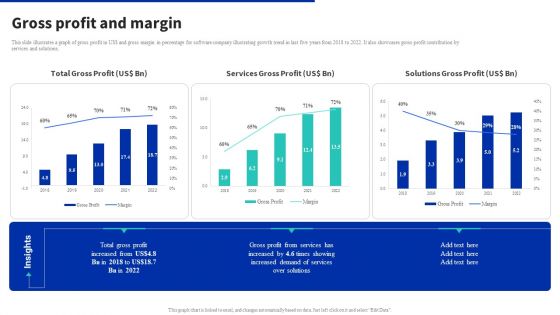
Digital Products Company Outline Gross Profit And Margin Professional PDF
This slide illustrates a graph of gross profit in US dollar and gross margin in percentage for software company illustrating growth trend in last five years from 2018 to 2022. It also showcases gross profit contribution by services and solutions. Get a simple yet stunning designed Digital Products Company Outline Gross Profit And Margin Professional PDF. It is the best one to establish the tone in your meetings. It is an excellent way to make your presentations highly effective. So, download this PPT today from Slidegeeks and see the positive impacts. Our easy to edit Digital Products Company Outline Gross Profit And Margin Professional PDF can be your go to option for all upcoming conferences and meetings. So, what are you waiting for Grab this template today.

6 Months Company Revenue Comparison Dashboard Graphics PDF
This slide showcases the half yearly profit comparison dashboard. It also includes comparison kp is such as monthly profit, profit margin growth, branch profit percentage, top 3 profitable products, etc. Showcasing this set of slides titled 6 Months Company Revenue Comparison Dashboard Graphics PDF. The topics addressed in these templates are Growth Rate, Overall Profit Margin, Branch Profit. All the content presented in this PPT design is completely editable. Download it and make adjustments in color, background, font etc. as per your unique business setting.
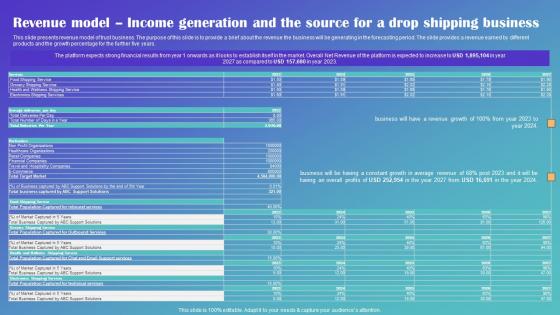
Revenue Model Income Generation And The Source Drop Shipping Business Plan Formats Pdf
This slide presents revenue model of trust business. The purpose of this slide is to provide a brief about the revenue the business will be generating in the forecasting period. The slide provides a revenue earned by different products and the growth percentage for the further five years. If you are looking for a format to display your unique thoughts, then the professionally designed Revenue Model Income Generation And The Source Drop Shipping Business Plan Formats Pdf is the one for you. You can use it as a Google Slides template or a PowerPoint template. Incorporate impressive visuals, symbols, images, and other charts. Modify or reorganize the text boxes as you desire. Experiment with shade schemes and font pairings. Alter, share or cooperate with other people on your work. Download Revenue Model Income Generation And The Source Drop Shipping Business Plan Formats Pdf and find out how to give a successful presentation. Present a perfect display to your team and make your presentation unforgettable.
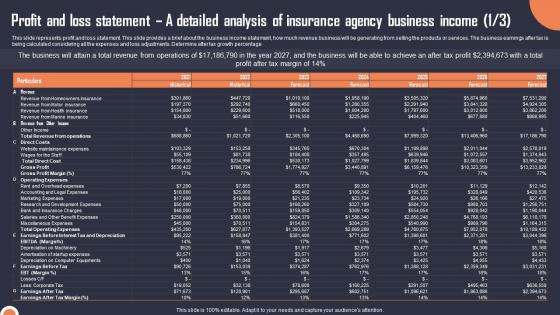
Profit And Loss Statement A Detailed Analysis Of Insurance Building An Insurance Company Sample Pdf
This slide represents profit and loss statement. This slide provides a brief about the business income statement, how much revenue business will be generating from selling the products or services. The business earnings after tax is being calculated considering all the expenses and loss adjustments. Determine after tax growth percentage If you are looking for a format to display your unique thoughts, then the professionally designed Profit And Loss Statement A Detailed Analysis Of Insurance Building An Insurance Company Sample Pdf is the one for you. You can use it as a Google Slides template or a PowerPoint template. Incorporate impressive visuals, symbols, images, and other charts. Modify or reorganize the text boxes as you desire. Experiment with shade schemes and font pairings. Alter, share or cooperate with other people on your work. Download Profit And Loss Statement A Detailed Analysis Of Insurance Building An Insurance Company Sample Pdf and find out how to give a successful presentation. Present a perfect display to your team and make your presentation unforgettable.

Revenue Model Income Generation And The Source Insurance Broker Business Plan Background Pdf
This slide presents revenue model of insurance agency business. The purpose of this slide is to provide a brief about the revenue the business will be generating in the forecasting period. The slide provides a revenue earned by different products and the growth percentage for the further five years.Presenting this PowerPoint presentation, titled Revenue Model Income Generation And The Source Insurance Broker Business Plan Background Pdf with topics curated by our researchers after extensive research. This editable presentation is available for immediate download and provides attractive features when used. Download now and captivate your audience. Presenting this Revenue Model Income Generation And The Source Insurance Broker Business Plan Background Pdf Our researchers have carefully researched and created these slides with all aspects taken into consideration. This is a completely customizable Revenue Model Income Generation And The Source Insurance Broker Business Plan Background Pdf that is available for immediate downloading. Download now and make an impact on your audience. Highlight the attractive features available with our PPTs.

Revenue Model Income Generation And The Source Automobile Insurance Agency Designs Pdf
This slide presents revenue model of insurance agency business. The purpose of this slide is to provide a brief about the revenue the business will be generating in the forecasting period. The slide provides a revenue earned by different products and the growth percentage for the further five years. Presenting this PowerPoint presentation, titled Revenue Model Income Generation And The Source Automobile Insurance Agency Designs Pdf, with topics curated by our researchers after extensive research. This editable presentation is available for immediate download and provides attractive features when used. Download now and captivate your audience. Presenting this Revenue Model Income Generation And The Source Automobile Insurance Agency Designs Pdf. Our researchers have carefully researched and created these slides with all aspects taken into consideration. This is a completely customizable Revenue Model Income Generation And The Source Automobile Insurance Agency Designs Pdf that is available for immediate downloading. Download now and make an impact on your audience. Highlight the attractive features available with our PPTs.
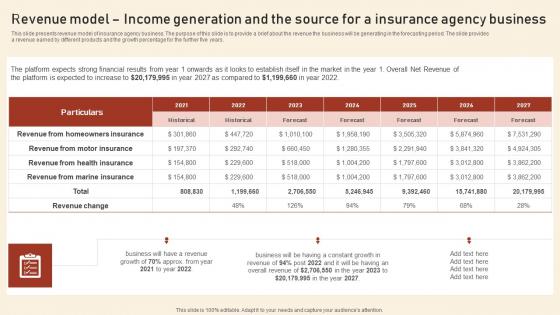
Revenue Model Income Generation And The Source For A Insurance Assurant Insurance Agency Summary Pdf
This slide presents revenue model of insurance agency business. The purpose of this slide is to provide a brief about the revenue the business will be generating in the forecasting period. The slide provides a revenue earned by different products and the growth percentage for the further five years. Presenting this PowerPoint presentation, titled Revenue Model Income Generation And The Source For A Insurance Assurant Insurance Agency Summary Pdf, with topics curated by our researchers after extensive research. This editable presentation is available for immediate download and provides attractive features when used. Download now and captivate your audience. Presenting this Revenue Model Income Generation And The Source For A Insurance Assurant Insurance Agency Summary Pdf. Our researchers have carefully researched and created these slides with all aspects taken into consideration. This is a completely customizable Revenue Model Income Generation And The Source For A Insurance Assurant Insurance Agency Summary Pdf that is available for immediate downloading. Download now and make an impact on your audience. Highlight the attractive features available with our PPTs.
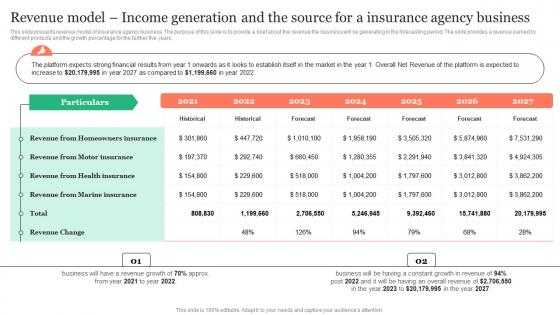
Revenue Model Income Generation And The Source Insurance Business Plan Background Pdf
This slide presents revenue model of insurance agency business. The purpose of this slide is to provide a brief about the revenue the business will be generating in the forecasting period. The slide provides a revenue earned by different products and the growth percentage for the further five years. Presenting this PowerPoint presentation, titled Revenue Model Income Generation And The Source Insurance Business Plan Background Pdf, with topics curated by our researchers after extensive research. This editable presentation is available for immediate download and provides attractive features when used. Download now and captivate your audience. Presenting this Revenue Model Income Generation And The Source Insurance Business Plan Background Pdf. Our researchers have carefully researched and created these slides with all aspects taken into consideration. This is a completely customizable Revenue Model Income Generation And The Source Insurance Business Plan Background Pdf that is available for immediate downloading. Download now and make an impact on your audience. Highlight the attractive features available with our PPTs.
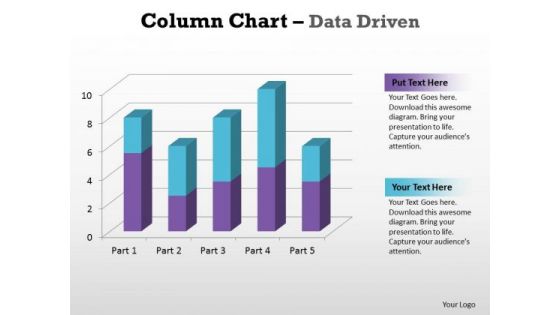
Business Graphic PowerPoint Templates Business Column Chart Data Driven Ppt Slides
Business Graphic PowerPoint Templates Business column chart data driven PPT Slides-With help of visual aids like this template you can capture the attention of the audience and make the presentation very interactive and lively.-Business Graphic PowerPoint Templates Business column chart data driven PPT Slides-This ppt can be used for concepts relating to-chart,, graph, growth, investment, , market, percentage, , presentation report, results, statistics, stock, success and business.

Video Promotion Service Investor Funding Elevator Pitch Deck Financial Performance Professional PDF
The slide mentions the revenue, run rate and margin percentage of the company indicating the growth in organizations financial performance Slidegeeks is here to make your presentations a breeze with Video Promotion Service Investor Funding Elevator Pitch Deck Financial Performance Professional PDF With our easy to use and customizable templates, you can focus on delivering your ideas rather than worrying about formatting. With a variety of designs to choose from, you are sure to find one that suits your needs. And with animations and unique photos, illustrations, and fonts, you can make your presentation pop. So whether you are giving a sales pitch or presenting to the board, make sure to check out Slidegeeks first.

Success Graph Finance PowerPoint Templates And PowerPoint Themes 1012
Success Graph Finance PowerPoint Templates And PowerPoint Themes 1012-The Above PowerPoint Template shows the Bar graph of Several Components showing the Percentage of each component. It signifies the Concept of Growth, Finance, Investment etc. Prove how they mesh to motivate the company team and provide the steam to activate the composite machine. You have noted down some very fruitful ideas that have occurred to you at random moments. Organize them all and prioritize them effectively.-Success Graph Finance PowerPoint Templates And PowerPoint Themes 1012-This PowerPoint template can be used for presentations relating to-Business growth, Business, Finance, Marketing, Success, Symbol
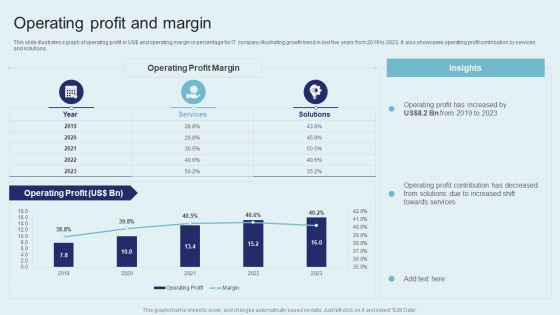
IT Firm Financial Statement Operating Profit And Margin Formats PDF
This slide illustrates a graph of operating profit in US dollar and operating margin in percentage for IT company IT Firm Fina growth trend in last five years from 2019 to 2023. It also showcases operating profit contribution by services and solutions. Get a simple yet stunning designed IT Firm Financial Statement Operating Profit And Margin Formats PDF. It is the best one to establish the tone in your meetings. It is an excellent way to make your presentations highly effective. So, download this PPT today from Slidegeeks and see the positive impacts. Our easy to edit IT Firm Financial Statement Operating Profit And Margin Formats PDF can be your go to option for all upcoming conferences and meetings. So, what are you waiting for Grab this template today.
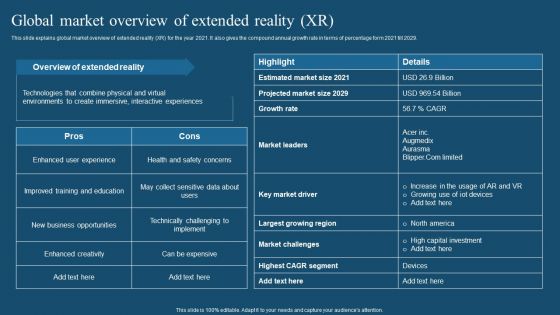
Recent Technologies In IT Industry Global Market Overview Of Extended Reality XR Pictures PDF
This slide explains global market overview of extended reality XR for the year 2021. It also gives the compound annual growth rate in terms of percentage form 2021 till 2029. Welcome to our selection of the Recent Technologies In IT Industry Global Market Overview Of Extended Reality XR Pictures PDF. These are designed to help you showcase your creativity and bring your sphere to life. Planning and Innovation are essential for any business that is just starting out. This collection contains the designs that you need for your everyday presentations. All of our PowerPoints are 100 percent editable, so you can customize them to suit your needs. This multi purpose template can be used in various situations. Grab these presentation templates today.
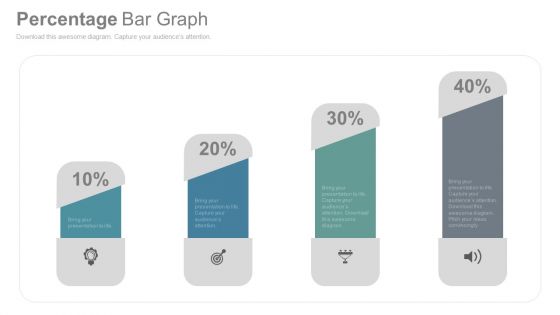
Bar Graph To Compare Business Data PowerPoint Slides
This is the slide which can solve many purposes of yours. Be it growth in your company, need to show your company?s status in the market as compared to others, or how your business has improved so far. An ideal PowerPoint template to display all of these. You can easily use this graph to show the growth of your company using the percentage icons. You can use this visual to show the status of your company in the market in comparison with others. You can edit the icons and replace them with the logo of your company and the others. You can also show it to your colleagues how your company has built its image in the market or how it has improved over the time. A perfect bar graph image which needs to be included in your business PPT presentations.
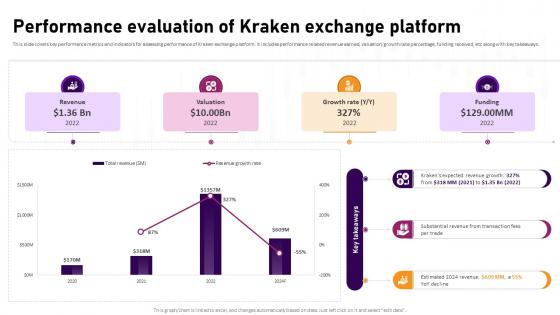
Performance Evaluation Of Kraken Exchange Platform Complete Roadmap To Blockchain BCT SS V
This slide covers key performance metrics and indicators for assessing performance of Kraken exchange platform. It includes performance related revenue earned, valuation, growth rate percentage, funding received, etc along with key takeaways. Find highly impressive Performance Evaluation Of Kraken Exchange Platform Complete Roadmap To Blockchain BCT SS V on Slidegeeks to deliver a meaningful presentation. You can save an ample amount of time using these presentation templates. No need to worry to prepare everything from scratch because Slidegeeks experts have already done a huge research and work for you. You need to download Performance Evaluation Of Kraken Exchange Platform Complete Roadmap To Blockchain BCT SS V for your upcoming presentation. All the presentation templates are 100 percent editable and you can change the color and personalize the content accordingly. Download now
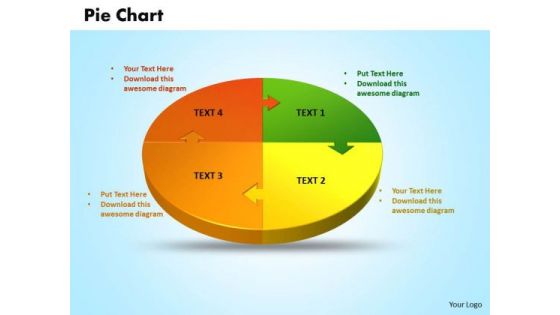
Business Editable PowerPoint Templates Business 3d Jigsaw Circular Pie Chart Ppt Slides
Business Chart PowerPoint Templates Business 3d jigsaw circular pie chart PPT Slides-PowerPoint Template shows Pie Chart with four sectors \\ Part of a series. -Business Chart PowerPoint Templates Business 3d jigsaw circular pie chart PPT Slides-This ppt can be used for concepts relating to-chart, circular, graph, growth, investment, isolated, market, numbers, percentage, pie, piece, plan, presentation, render, report, results, slice, statistics, stock, success and business.
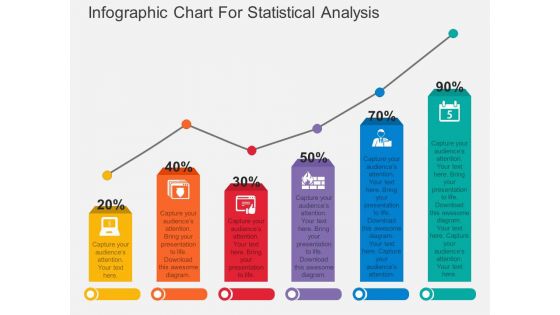
Infographic Chart For Statistical Analysis Powerpoint Template
Download this exclusive business diagram to display statistical analysis. This PowerPoint template contains bar chart with percentage values. This diagram is useful for business presentations.
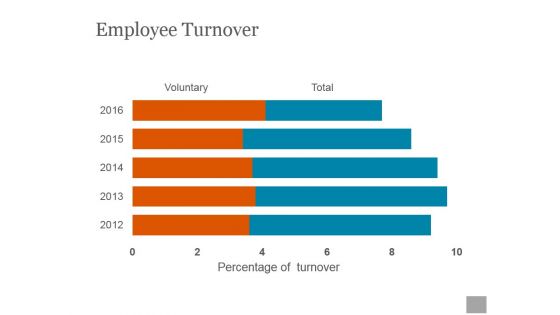
Employee Turnover Ppt PowerPoint Presentation Designs
This is a employee turnover ppt powerpoint presentation designs. This is a five stage process. The stages in this process are voluntary, percentage of turnover, total.
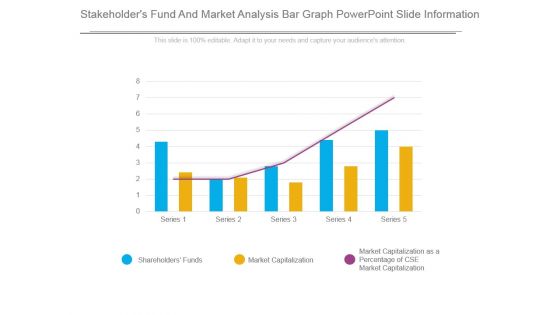
Stakeholders Fund And Market Analysis Bar Graph Powerpoint Slide Information
This is a stakeholders fund and market analysis bar graph powerpoint slide information. This is a five stage process. The stages in this process are shareholders funds, market capitalization, market capitalization as a percentage of cse market capitalization.
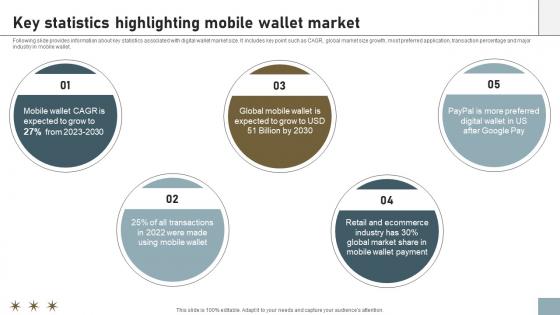
Online Payment Techniques For Key Statistics Highlighting Mobile Wallet Market
Following slide provides information about key statistics associated with digital wallet market size. It includes key point such as CAGR, global market size growth, most preferred application, transaction percentage and major industry in mobile wallet. This Online Payment Techniques For Key Statistics Highlighting Mobile Wallet Market from Slidegeeks makes it easy to present information on your topic with precision. It provides customization options, so you can make changes to the colors, design, graphics, or any other component to create a unique layout. It is also available for immediate download, so you can begin using it right away. Slidegeeks has done good research to ensure that you have everything you need to make your presentation stand out. Make a name out there for a brilliant performance.

Cashless Payment Strategies To Enhance Business Performance Key Statistics Highlighting Mobile Wallet Market Formats PDF
Following slide provides information about key statistics associated with digital wallet market size. It includes key point such as CAGR, global market size growth, most preferred application, transaction percentage and major industry in mobile wallet. Slidegeeks has constructed Cashless Payment Strategies To Enhance Business Performance Key Statistics Highlighting Mobile Wallet Market Formats PDF after conducting extensive research and examination. These presentation templates are constantly being generated and modified based on user preferences and critiques from editors. Here, you will find the most attractive templates for a range of purposes while taking into account ratings and remarks from users regarding the content. This is an excellent jumping-off point to explore our content and will give new users an insight into our top-notch PowerPoint Templates.
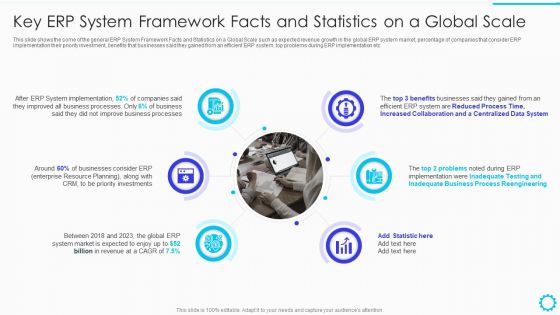
Summary Of Cloud ERP System Framework Key ERP System Framework Facts And Statistics On A Global Scale Sample PDF
This slide shows the some of the general ERP System Framework Facts and Statistics on a Global Scale such as expected revenue growth in the global ERP system market, percentage of companies that consider ERP implementation their priority investment, benefits that businesses said they gained from an efficient ERP system, top problems during ERP implementation etcPresenting Summary Of Cloud ERP System Framework Key ERP System Framework Facts And Statistics On A Global Scale Sample PDF to provide visual cues and insights. Share and navigate important information on six stages that need your due attention. This template can be used to pitch topics like Increased Collaboration, Inadequate Business, System Implementation In addtion, this PPT design contains high resolution images, graphics, etc, that are easily editable and available for immediate download.
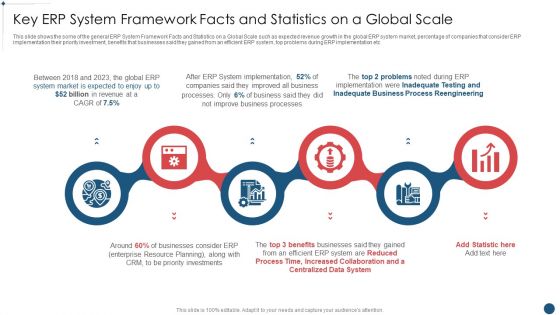
Enterprise Resource Planning System Framework Key Erp System Framework Facts And Statistics On A Global Scale Download PDF
This slide shows the some of the general ERP System Framework Facts and Statistics on a Global Scale such as expected revenue growth in the global ERP system market, percentage of companies that consider ERP implementation their priority investment, benefits that businesses said they gained from an efficient ERP system, top problems during ERP implementation etc Presenting Enterprise Resource Planning System Framework Key Erp System Framework Facts And Statistics On A Global Scale Download PDF to provide visual cues and insights. Share and navigate important information on six stages that need your due attention. This template can be used to pitch topics like System Market Is Expected, Inadequate Business, Process Reengineering In addtion, this PPT design contains high resolution images, graphics, etc, that are easily editable and available for immediate download.

Key ERP System Framework Facts And Statistics On A Global Scale Ppt Slides Clipart Images PDF
This slide shows the some of the general ERP System Framework Facts and Statistics on a Global Scale such as expected revenue growth in the global ERP system market, percentage of companies that consider ERP implementation their priority investment, benefits that businesses said they gained from an efficient ERP system, top problems during ERP implementation etc. Presenting key erp system framework facts and statistics on a global scale ppt slides clipart images pdf to provide visual cues and insights. Share and navigate important information on six stages that need your due attention. This template can be used to pitch topics like enterprise resource, priority investments, system implementation, revenue. In addtion, this PPT design contains high resolution images, graphics, etc, that are easily editable and available for immediate download.

Stock Photo 3d Hour Glass For Time Management Image Graphics For PowerPoint Slide
This image slide displays hourglass with percentage symbol. This image slide may be used to display the time management and profit percentage. Make outstanding presentations using this image.

Banking Concept Financial PowerPoint Templates And PowerPoint Backgrounds 0211
Microsoft PowerPoint Template and Background with money and percentage symbol in hands
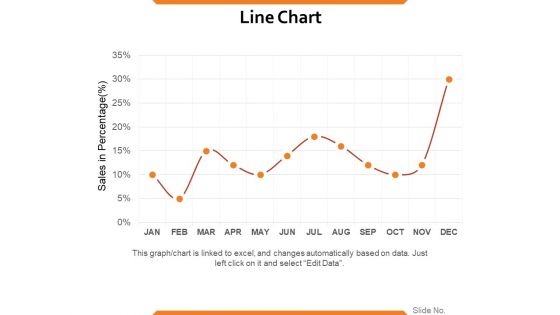
Line Chart Ppt PowerPoint Presentation Summary Samples
This is a line chart ppt powerpoint presentation summary samples. This is a one stage process. The stages in this process are sales in percentage, percentage, business, marketing, strategy.

Stacked Line Ppt PowerPoint Presentation File Show
This is a stacked line ppt powerpoint presentation file show. This is a three stage process. The stages in this process are revenue in percentage, product.

Scatter Chart Ppt PowerPoint Presentation Outline Picture
This is a scatter chart ppt powerpoint presentation outline picture. This is a two stage process. The stages in this process are in percentage, business, marketing, product, graph.
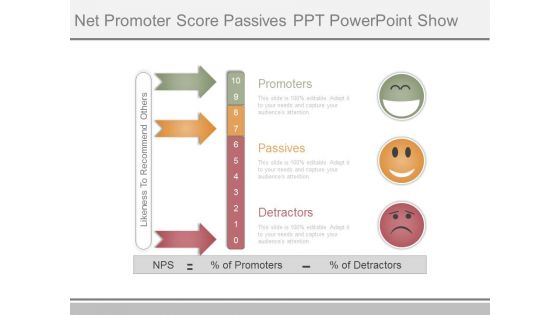
Net Promoter Score Passives Ppt Powerpoint Show
This is a net promoter score passives ppt powerpoint show. This is a three stage process. The stages in this process are promoters, passives, detractors, nps, percentage of promoters, likeness to recommend others, percentage of detractors.

Net Promoter Score Value Diagram Example Of Ppt
This is a net promoter score value diagram example of ppt. This is a ten stage process. The stages in this process are nps, percentage of promoters, percentage of detractors, detractors, passive, promoter, not at all likely, natural, extremely likely.
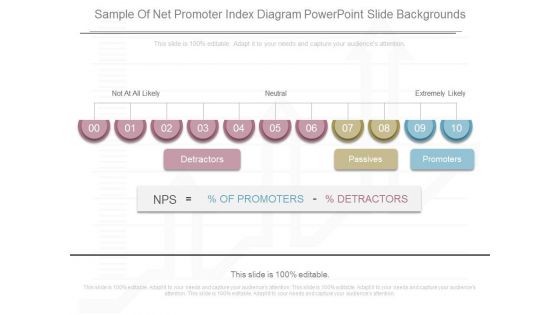
Sample Of Net Promoter Index Diagram Powerpoint Slide Backgrounds
This is a sample of net promoter index diagram powerpoint slide backgrounds. This is a ten stage process. The stages in this process are not at all likely, neutral, extremely likely, detractors, passives, promoters, nps, percentage detractors, percentage of promoters.
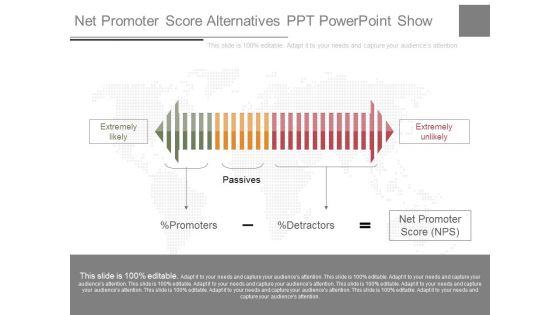
Net Promoter Score Alternatives Ppt Powerpoint Show
This is a net promoter score alternatives ppt powerpoint show. This is a one stage process. The stages in this process are extremely likely, passives, extremely unlikely, percentage of promoters, percentage of detractors, net promoter score nps.
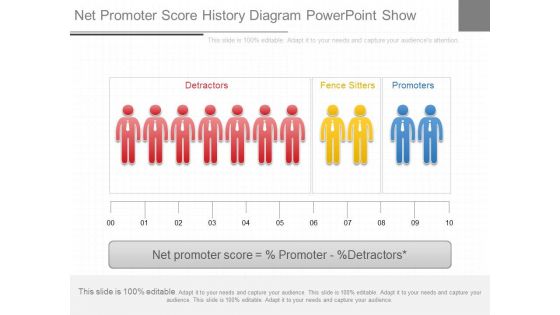
Net Promoter Score History Diagram Powerpoint Show
This is a net promoter score history diagram powerpoint show. This is a ten stage process. The stages in this process are detractors, fence sitters, promoters, net promoter score, percentage promoter, percentage detractors.
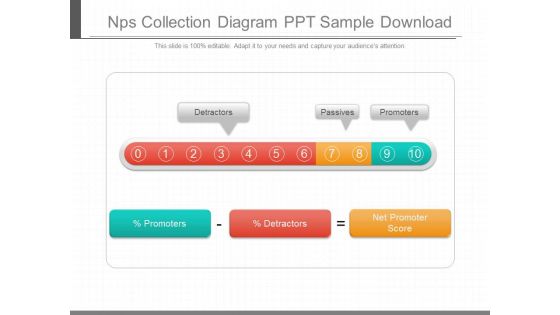
Nps Collection Diagram Ppt Sample Download
This is a nps collection diagram ppt sample download. This is a ten stage process. The stages in this process are detractors, passives, promoters, percentage promoters, percentage detractors, net promoter score.
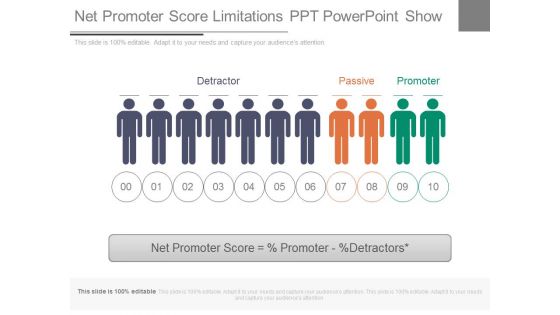
Net Promoter Score Limitations Ppt Powerpoint Show
This is a net promoter score limitations ppt powerpoint show. This is a ten stage process. The stages in this process are detractor, passive, promoter, net promoter score percentage promoter percentage detractors.
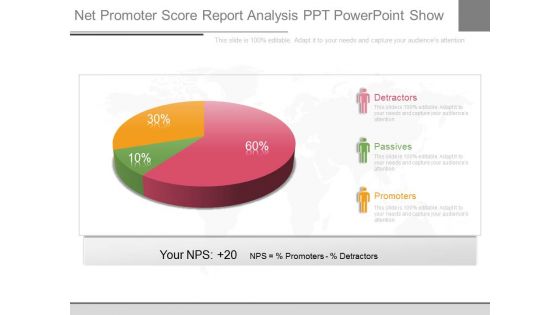
Net Promoter Score Report Analysis Ppt Powerpoint Show
This is a net promoter score report analysis ppt powerpoint show. This is a three stage process. The stages in this process are detractors, passives, promoters, your nps, nps, percentage promoters, percentage detractors.

Business Graph With Dollars Success PowerPoint Templates And PowerPoint Backgrounds 0711
Microsoft PowerPoint Template and Background with wooden graphic showing the percentage increase that leads to higher costs
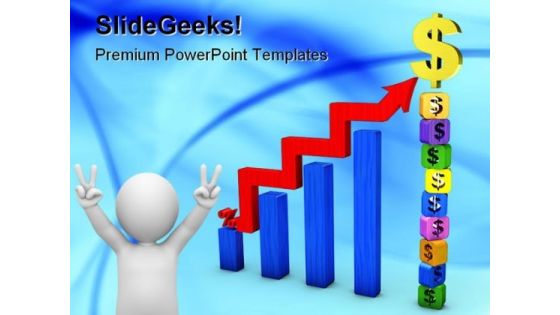
Business Graph With Dollars Success PowerPoint Themes And PowerPoint Slides 0711
Microsoft PowerPoint Theme and Slide with wooden graphic showing the percentage increase that leads to higher costs

Line Chart Ppt PowerPoint Presentation Model Design Templates
This is a line chart ppt powerpoint presentation model design templates. This is a two stage process. The stages in this process are sales in percentage, financial years, product.
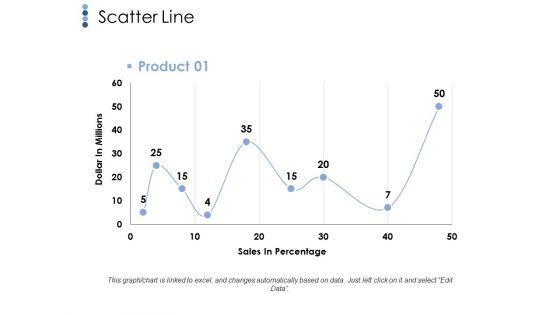
Scatter Line Ppt PowerPoint Presentation File Infographics
This is a scatter line ppt powerpoint presentation file infographics. This is a one stage process. The stages in this process are scatter line, dollar in millions, sales in percentage, business.

Stacked Line Chart Template 2 Ppt PowerPoint Presentation Rules
This is a stacked line chart template 2 ppt powerpoint presentation rules. This is a two stage process. The stages in this process are stacked line chart, in percentage, product.
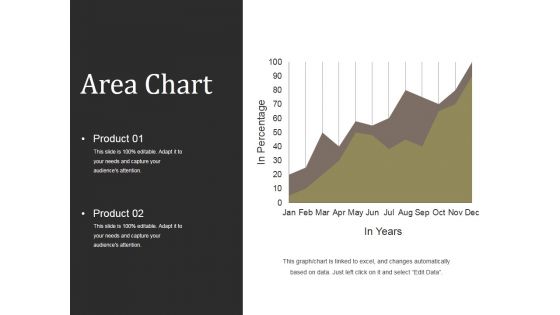
Area Chart Ppt PowerPoint Presentation Professional Designs
This is a area chart ppt powerpoint presentation professional designs. This is a two stage process. The stages in this process are in percentage, product, in years, strategy, business, marketing.
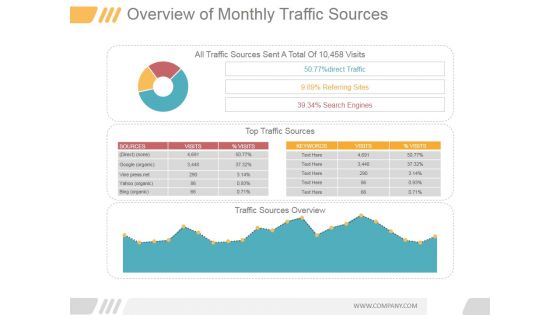
Overview Of Monthly Traffic Sources Ppt PowerPoint Presentation Visuals
This is a overview of monthly traffic sources ppt powerpoint presentation visuals. This is a three stage process. The stages in this process are all traffic sources sent a total of 10 458 visits, 50 77 percentage direct traffic, 9 89 percentage referring sites, 39 34 percentage search engines, sources, visits.
Employee Taking Challenging Tasks Vector Icon Ppt PowerPoint Presentation Model Layout PDF
Presenting employee taking challenging tasks vector icon ppt powerpoint presentation model layout pdf to dispense important information. This template comprises three stages. It also presents valuable insights into the topics including employee taking challenging tasks vector icon. This is a completely customizable PowerPoint theme that can be put to use immediately. So, download it and address the topic impactfully.
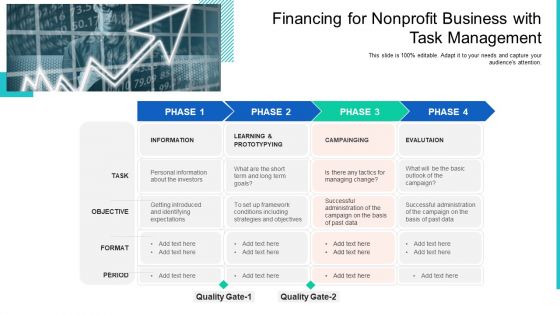
Financing For Nonprofit Business With Task Management Ppt Slides Aids PDF
Presenting financing for nonprofit business with task management ppt slides aids pdf. to dispense important information. This template comprises four stages. It also presents valuable insights into the topics including learning and prototypying, information. This is a completely customizable PowerPoint theme that can be put to use immediately. So, download it and address the topic impactfully.

Consumer Journey Model With Key Marketing Tasks Ppt PowerPoint Presentation File Example Introduction PDF
Presenting consumer journey model with key marketing tasks ppt powerpoint presentation file example introduction pdf to dispense important information. This template comprises four stages. It also presents valuable insights into the topics including reach, convert, engage. This is a completely customizable PowerPoint theme that can be put to use immediately. So, download it and address the topic impactfully.

Our Mission Complete Guide On Marketing Communication Plan Elements PDF
Make sure to capture your audiences attention in your business displays with our gratis customizable Our Mission Complete Guide On Marketing Communication Plan Elements PDF. These are great for business strategies, office conferences, capital raising or task suggestions. If you desire to acquire more customers for your tech business and ensure they stay satisfied, create your own sales presentation with these plain slides.
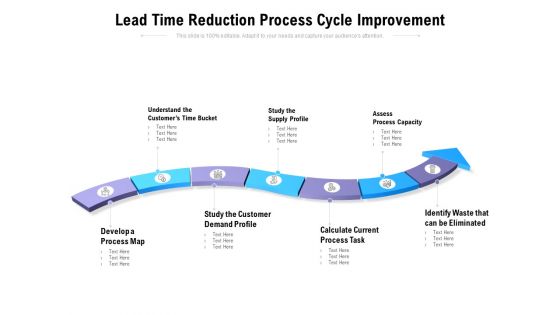
Lead Time Reduction Process Cycle Improvement Ppt PowerPoint Presentation Model Layout Ideas
Presenting this set of slides with name lead time reduction process cycle improvement ppt powerpoint presentation model layout ideas. This is a seven stage process. The stages in this process are understand the customers time bucket, study the supply profile, assess process capacity, develop a process map, study the customer demand profile, calculate current process task, identify waste that can be eliminated. This is a completely editable PowerPoint presentation and is available for immediate download. Download now and impress your audience.

Technology Automation Roadmap With Deep Learning Ppt PowerPoint Presentation Portfolio Infographics PDF
Presenting technology automation roadmap with deep learning ppt powerpoint presentation portfolio infographics pdf to dispense important information. This template comprises one stages. It also presents valuable insights into the topics including roadmap, strategy, task automation, intelligent automation, robotic process automation, optical character recognition, natural language processing, deep learning, technology choice. This is a completely customizable PowerPoint theme that can be put to use immediately. So, download it and address the topic impactfully.

6 Stages Of Leadership Coaching Plan With Key Priorities Ppt PowerPoint Presentation Gallery Infographics PDF
Following slide exhibits 6 stages of leadership and executive coaching plan. It includes multiple tasks such as- employee training and development, setting future objectives and training method for team members and so on. Presenting 6 stages of leadership coaching plan with key priorities ppt powerpoint presentation gallery infographics pdf to dispense important information. This template comprises six stages. It also presents valuable insights into the topics including stakeholder management, leadership, strategic role. This is a completely customizable PowerPoint theme that can be put to use immediately. So, download it and address the topic impactfully.
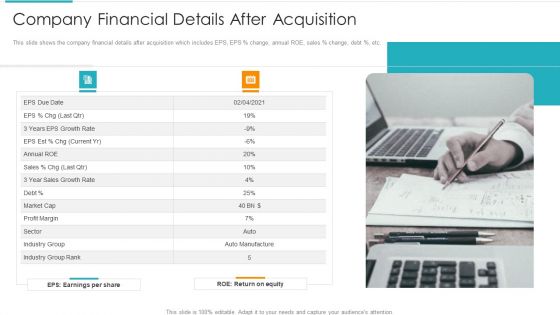
Inorganic Expansion Plan And Progression Company Financial Details After Acquisition Summary PDF
This slide shows the company financial details after acquisition which includes EPS, EPS percentage change, annual ROE, sales percentage change, debt percentage, etc. This is a inorganic expansion plan and progression company financial details after acquisition summary pdf template with various stages. Focus and dispense information on one stages using this creative set, that comes with editable features. It contains large content boxes to add your information on topics like sales, growth rate, profit margin, industry group rank, equity. You can also showcase facts, figures, and other relevant content using this PPT layout. Grab it now.

Annual Chronic Patients Change Linear Chart Demonstration PDF
The following slide highlights the percentage change of chronically ill patients. It shows the annual percentage change for the for a decade Showcasing this set of slides titled Annual Chronic Patients Change Linear Chart Demonstration PDF. The topics addressed in these templates are Key Observations, Annual Percentage, Linear Chart. All the content presented in this PPT design is completely editable. Download it and make adjustments in color, background, font etc. as per your unique business setting.
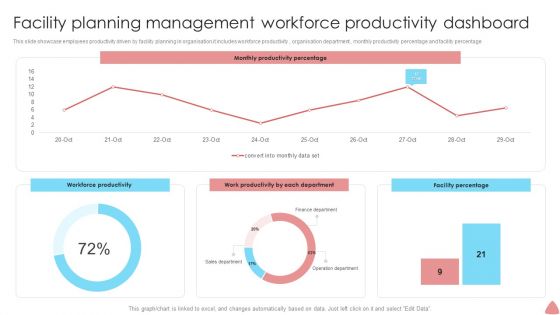
Facility Planning Management Workforce Productivity Dashboard Formats PDF
This slide showcase employees productivity driven by facility planning in organisation.it includes workforce productivity , organisation department , monthly productivity percentage and facility percentage. Showcasing this set of slides titled Facility Planning Management Workforce Productivity Dashboard Formats PDF. The topics addressed in these templates are Workforce Productivity, Work Productivity, Facility Percentage. All the content presented in this PPT design is completely editable. Download it and make adjustments in color, background, font etc. as per your unique business setting.
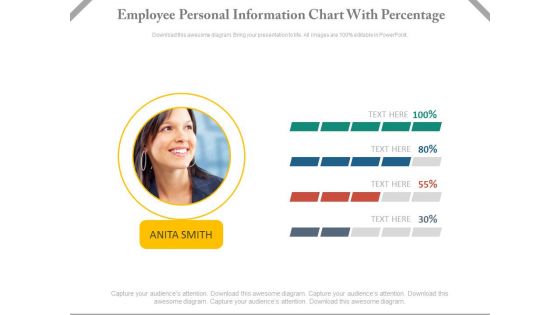
Employee Performance Information Chart Powerpoint Slides
This dashboard template contains employee picture with percentage slides. This dashboard PowerPoint template conveys employees performance in a visual manner. Download this PPT slide for quick decision-making.
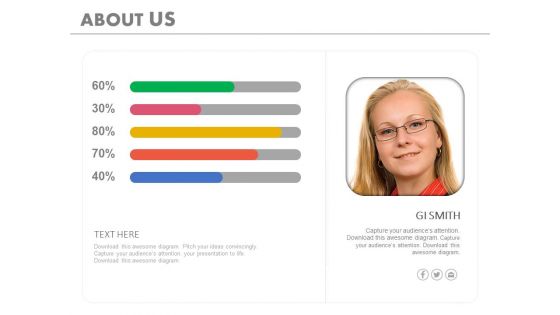
Overview Of Company Economic Analysis Powerpoint Slides
This PowerPoint template has been designed with employee picture and percentage tags. Download this PPT slide to depict company?s economic analysis. Make impressive presentation using this slide design.

Employee Turnover Ppt PowerPoint Presentation Show Layouts
This is a employee turnover ppt powerpoint presentation show layouts. This is a five stage process. The stages in this process are total, voluntary, percentage of turnover, finance.
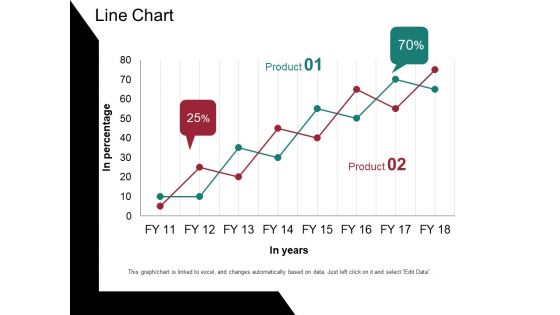
Line Chart Ppt PowerPoint Presentation Portfolio Design Templates
This is a line chart ppt powerpoint presentation portfolio design templates. This is a two stage process. The stages in this process are in percentage, in years, percentage, business, graph.

 Home
Home