Percentage Growth

Line Chart Ppt PowerPoint Presentation Layouts Templates
This is a line chart ppt powerpoint presentation layouts templates. This is a two stage process. The stages in this process are product, in percentage, in years.
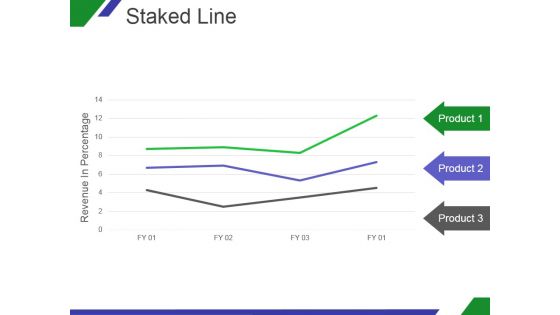
Staked Line Ppt PowerPoint Presentation Slide
This is a staked line ppt powerpoint presentation slide. This is a three stage process. The stages in this process are revenue in percentage, product, business.
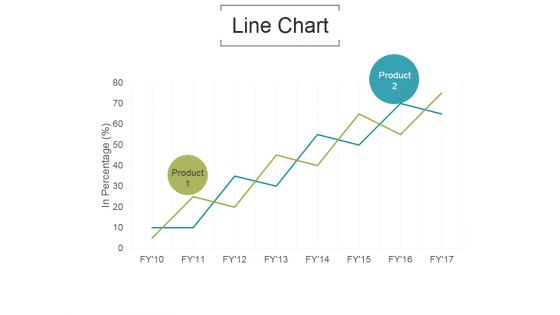
Line Chart Ppt PowerPoint Presentation Model
This is a line chart ppt powerpoint presentation model. This is a two stage process. The stages in this process are in percentage, product, business.

Stacked Line Ppt PowerPoint Presentation Guide
This is a stacked line ppt powerpoint presentation guide. This is a three stage process. The stages in this process are revenue in percentage, product.

Stacked Line Ppt PowerPoint Presentation Gallery Display
This is a stacked line ppt powerpoint presentation gallery display. This is a three stage process. The stages in this process are revenue in percentage, product, graph, finance.
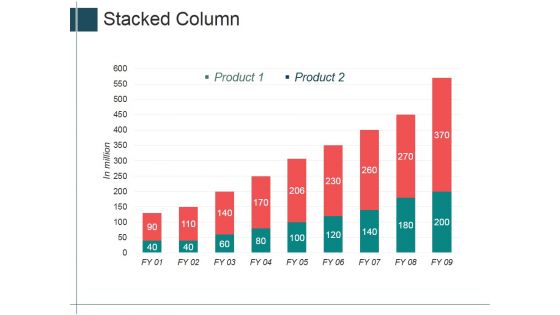
Stacked Column Ppt PowerPoint Presentation Model Good
This is a stacked column ppt powerpoint presentation model good. This is a nine stage process. The stages in this process are finance, percentage, business, product.
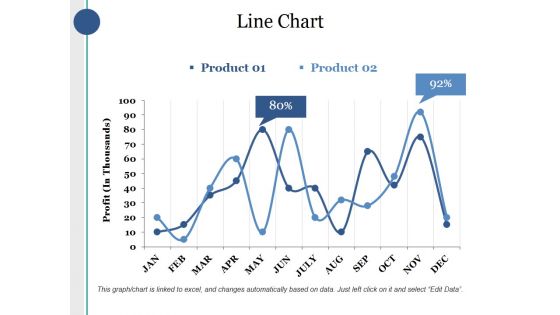
Line Chart Ppt PowerPoint Presentation Layouts Sample
This is a line chart ppt powerpoint presentation layouts sample. This is a two stage process. The stages in this process are product, profit, percentage, finance, business.

Project Implementation Planning Procedure Timeline With Task Priority And Budget Guidelines PDF
The following slide highlights the project execution plan timeline with task priority and budget illustrating project name, date, project status, percentage complete, task timeline, task status percentage, task priority percentage, budget and pending items. Showcasing this set of slides titled Project Implementation Planning Procedure Timeline With Task Priority And Budget Guidelines PDF. The topics addressed in these templates are Project Implementation Planning Procedure Timeline With Task Priority And Budget. All the content presented in this PPT design is completely editable. Download it and make adjustments in color, background, font etc. as per your unique business setting.
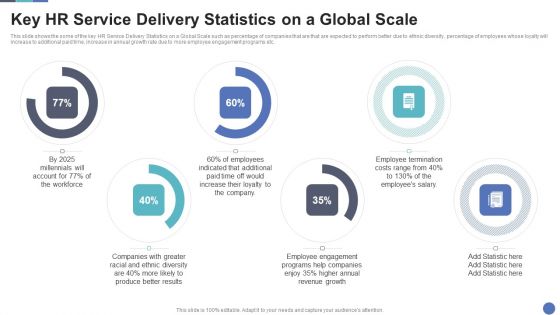
Key HR Service Delivery Statistics On A Global Scal Portrait PDF
This slide shows the some of the key HR Service Delivery Statistics on a Global Scale such as percentage of companies that are that are expected to perform better due to ethnic diversity, percentage of employees whose loyalty will increase to additional paid time, increase in annual growth rate due to more employee engagement programs etc. Deliver and pitch your topic in the best possible manner with this Key HR Service Delivery Statistics On A Global Scal Portrait PDF. Use them to share invaluable insights on Produce Better, Employee Engagement, Employee Termination and impress your audience. This template can be altered and modified as per your expectations. So, grab it now.

Enhancing Stp Strategies For A Successful Market Promotion Global Technology Market Template PDF
Following slide displays the growth projections of global technology market. It shows that the tech market is estimated to from 4 percentage to 5.5 percentage in the year 2021. Presenting enhancing stp strategies for a successful market promotion global technology market template pdf to provide visual cues and insights. Share and navigate important information on one stages that need your due attention. This template can be used to pitch topics like global, technology, market. In addtion, this PPT design contains high resolution images, graphics, etc, that are easily editable and available for immediate download.

Yearly Sales Lead Conversation Kpis Ppt Inspiration Brochure PDF
This slide covers stages through which potential leads turning into consumers on yearly basis and also that help in analyzing lead conversation rate in financial year. It includes lead conversation ratio, total no of leads, new leads opportunity percentage ratio and lead conversation percentage. Pitch your topic with ease and precision using this Yearly Sales Lead Conversation Kpis Ppt Inspiration Brochure PDF. This layout presents information on Sales Manager, Conversation Rate, Opportunity Ratio Percentage. It is also available for immediate download and adjustment. So, changes can be made in the color, design, graphics or any other component to create a unique layout.

Clustered Column Line Ppt PowerPoint Presentation Backgrounds
This is a clustered column line ppt powerpoint presentation backgrounds. This is a four stage process. The stages in this process are fire, earthquake, axis title, in percentage.
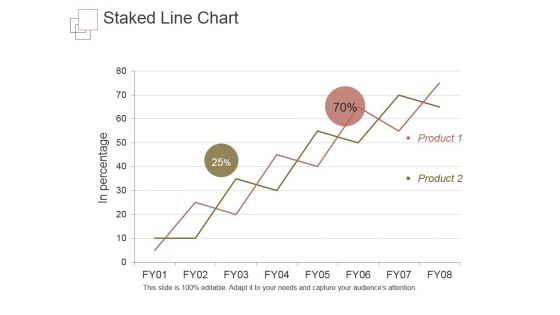
Staked Line Chart Ppt PowerPoint Presentation Topics
This is a staked line chart ppt powerpoint presentation topics. This is a two stage process. The stages in this process are in percentage, product.
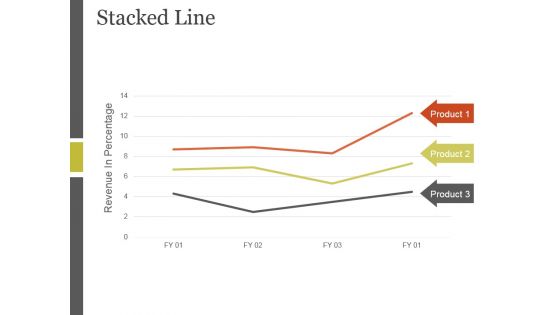
Stacked Line Ppt PowerPoint Presentation Inspiration
This is a stacked line ppt powerpoint presentation inspiration. This is a three stage process. The stages in this process are revenue in percentage, stacked line, product.
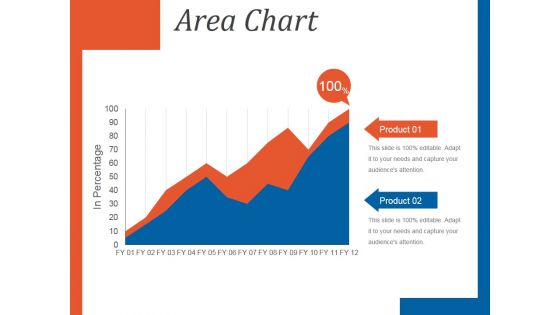
Area Chart Ppt PowerPoint Presentation Diagrams
This is a area chart ppt powerpoint presentation diagrams.This is a two stage process. The stages in this process are in percentage, area chart, product.
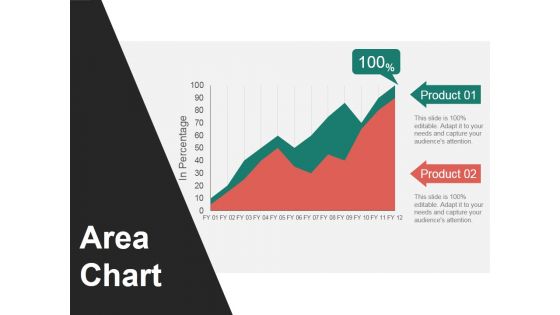
Area Chart Ppt PowerPoint Presentation Slides Graphics Design
This is a area chart ppt powerpoint presentation slides graphics design. This is a two stage process. The stages in this process are area chart, in percentage, product.

Line Chart Ppt PowerPoint Presentation Ideas Portfolio
This is a line chart ppt powerpoint presentation ideas portfolio. This is a two stage process. The stages in this process are line chart, in years, in percentage.
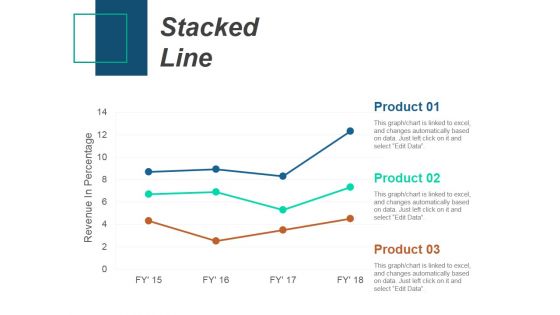
Stacked Line Ppt PowerPoint Presentation Infographics Slideshow
This is a stacked line ppt powerpoint presentation infographics slideshow. This is a three stage process. The stages in this process are stacked line, revenue in percentage, product.
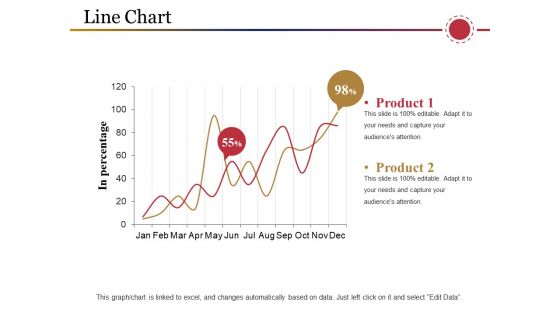
Line Chart Ppt PowerPoint Presentation Inspiration Samples
This is a line chart ppt powerpoint presentation inspiration samples. This is a two stage process. The stages in this process are product, in percentage, business, marketing, graph.
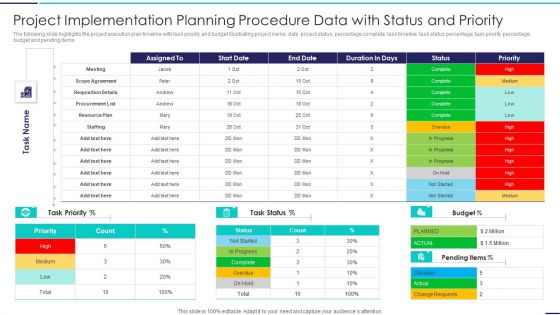
Project Implementation Planning Procedure Data With Status And Priority Demonstration PDF
The following slide highlights the project execution plan timeline with task priority and budget illustrating project name, date, project status, percentage complete, task timeline, task status percentage, task priority percentage, budget and pending items. Showcasing this set of slides titled Project Implementation Planning Procedure Data With Status And Priority Demonstration PDF. The topics addressed in these templates are Project Implementation Planning Procedure Data With Status And Priority. All the content presented in this PPT design is completely editable. Download it and make adjustments in color, background, font etc. as per your unique business setting.
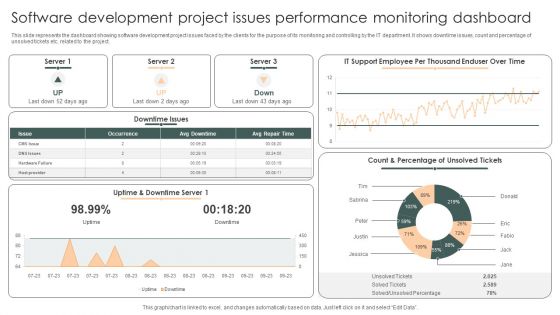
Software Development Project Issues Performance Monitoring Dashboard Structure PDF
This slide represents the dashboard showing software development project issues faced by the clients for the purpose of its monitoring and controlling by the IT department. It shows downtime issues, count and percentage of unsolved tickets etc. related to the project.Showcasing this set of slides titled Software Development Project Issues Performance Monitoring Dashboard Structure PDF. The topics addressed in these templates are Downtime Issues, Count Percentage, Unsolved Percentage. All the content presented in this PPT design is completely editable. Download it and make adjustments in color, background, font etc. as per your unique business setting.
Coronavirus Cases And Deaths Update By Age Group Icons PDF
Following slide provides information regarding distribution of confirmed coronavirus cases and deaths which government uses to take necessary measure in containing virus outspread. Percentage of confirmed cases and deaths are demonstrated in this slide. Showcasing this set of slides titled Coronavirus Cases And Deaths Update By Age Group Icons PDF. The topics addressed in these templates are Highest Percentage, Age Group, Least Percentage. All the content presented in this PPT design is completely editable. Download it and make adjustments in color, background, font etc. as per your unique business setting.
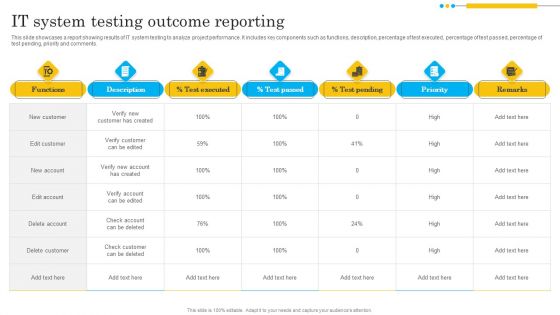
IT System Testing Outcome Reporting Formats PDF
This slide showcases a report showing results of IT system testing to analyze project performance. It includes key components such as functions, description, percentage of test executed, percentage of test passed, percentage of test pending, priority and comments. Showcasing this set of slides titled IT System Testing Outcome Reporting Formats PDF. The topics addressed in these templates are Verify Customer Created, Check Account, Check Customer. All the content presented in this PPT design is completely editable. Download it and make adjustments in color, background, font etc. as per your unique business setting.

Circular Stack 5 Stages Business Process Ppt What Is Planning PowerPoint Slides
We present our circular stack 5 stages business process ppt what is planning PowerPoint Slides.Use our Process and Flows PowerPoint Templates because Our PowerPoint Templates and Slides are effectively colour coded to prioritise your plans They automatically highlight the sequence of events you desire. Present our Flow Charts PowerPoint Templates because Our PowerPoint Templates and Slides will provide the perfect balance. Your weighty ideas will get the ideal impetus. Download our Circle Charts PowerPoint Templates because Our PowerPoint Templates and Slides will weave a web of your great ideas. They are gauranteed to attract even the most critical of your colleagues. Download and present our Shapes PowerPoint Templates because you can Add colour to your speech with our PowerPoint Templates and Slides. Your presentation will leave your audience speechless. Download our Business PowerPoint Templates because Our PowerPoint Templates and Slides are Clear and concise. Use them and dispel any doubts your team may have.Use these PowerPoint slides for presentations relating to Graph, pyramid, circle, diagram, segment,business, graphic, web, percent, economics, slice, isometric, concept, success, internet, commercial, circle, percentage, finance, report, modern, illustration, strategy, collection, design, growth, profit, commerce, banking, financial, communication. The prominent colors used in the PowerPoint template are Blue, Gray, White.
Scatter Line Chart Ppt PowerPoint Presentation Icon Files
This is a scatter line chart ppt powerpoint presentation icon files. This is a one stage process. The stages in this process are dollar in millions, product, sales in percentage.
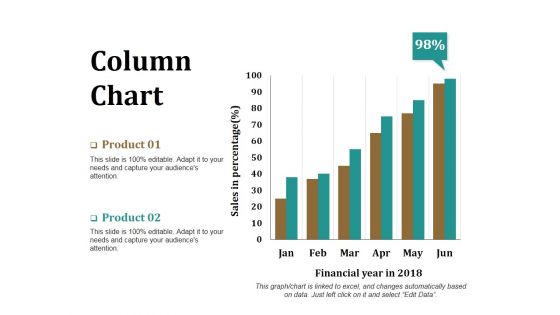
Column Chart Ppt PowerPoint Presentation Model Graphics Download
This is a column chart ppt powerpoint presentation model graphics download. This is a two stage process. The stages in this process are product, financial year, sales in percentage, bar graph, success.

Line Chart Ppt PowerPoint Presentation Infographics Infographics
This is a line chart ppt powerpoint presentation infographics infographics. This is a two stage process. The stages in this process are product, sales in percentage, financial year, line chart, finance.
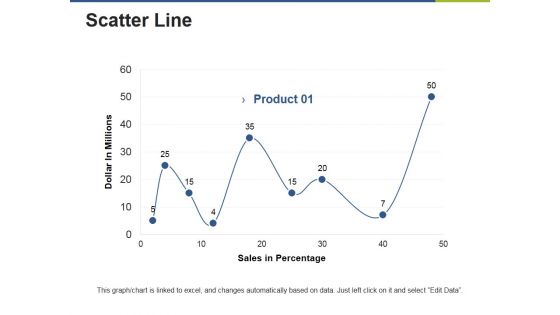
Scatter Line Ppt PowerPoint Presentation Gallery Clipart Images
This is a scatter line ppt powerpoint presentation gallery clipart images. This is a one stage process. The stages in this process are product, dollar in millions, sales in percentage.

Line Chart Ppt PowerPoint Presentation Gallery Templates
This is a line chart ppt powerpoint presentation gallery templates. This is a two stage process. The stages in this process are product, financial years, sales in percentage, line chart.

Scatter Line Ppt PowerPoint Presentation Professional Design Inspiration
This is a scatter line ppt powerpoint presentation professional design inspiration. This is a one stage process. The stages in this process are product, sales in percentage, dollar in millions.

Line With Markers Ppt PowerPoint Presentation Styles Slide Portrait
This is a line with markers ppt powerpoint presentation styles slide portrait. This is a two stage process. The stages in this process are sales in percentage, financial years, product.
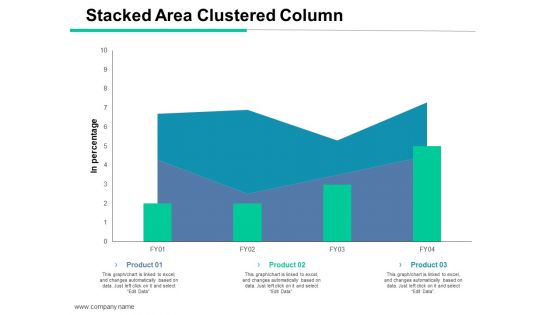
Stacked Area Clustered Column Ppt PowerPoint Presentation File Templates
This is a stacked area clustered column ppt powerpoint presentation file templates. This is a three stage process. The stages in this process are stacked area clustered column, product, financial, sales in percentage, management.
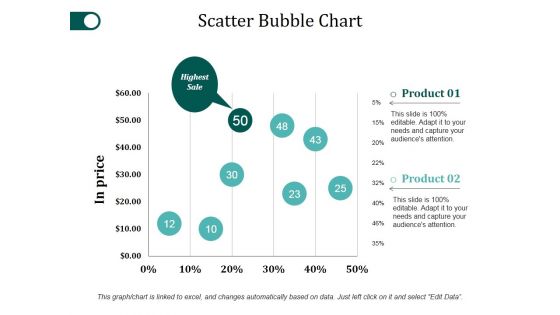
Scatter Bubble Chart Ppt PowerPoint Presentation Styles Objects
This is a scatter bubble chart ppt powerpoint presentation styles objects. This is a two stage process. The stages in this process are product, in price, highest sale, percentage, finance.

Bar Chart Ppt PowerPoint Presentation Infographics Format Ideas
This is a bar chart ppt powerpoint presentation infographics format ideas. This is a two stage process. The stages in this process are bar graph, product, financial year, sales in percentage.
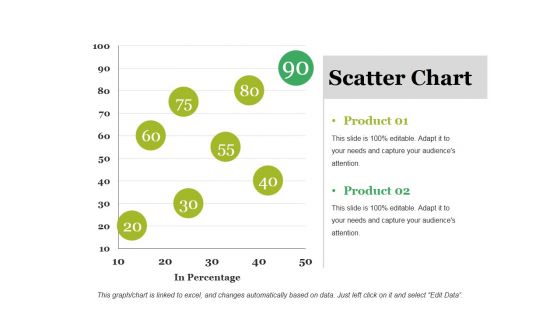
Scatter Chart Ppt PowerPoint Presentation Outline Ideas
This is a scatter chart ppt powerpoint presentation outline ideas. This is a two stage process. The stages in this process are product, scatter chart, business, in percentage, marketing.

Stacked Line Ppt PowerPoint Presentation Show Templates
This is a stacked line ppt powerpoint presentation show templates. This is a three stage process. The stages in this process are stacked line, in percentage, finance, marketing, business.
Area Chart Ppt PowerPoint Presentation Icon Show
This is a area chart ppt powerpoint presentation icon show. This is a two stage process. The stages in this process are product, financial year, in percentage, area chart.

Clustered Chart Ppt PowerPoint Presentation Outline Templates
This is a clustered chart ppt powerpoint presentation outline templates. This is a three stage process. The stages in this process are product, in percentage, in years, clustered chart.
Area Chart Ppt PowerPoint Presentation Icon Layout Ideas
This is a area chart ppt powerpoint presentation icon layout ideas. This is a two stage process. The stages in this process are area chart, sales in percentage, years, planning, business.
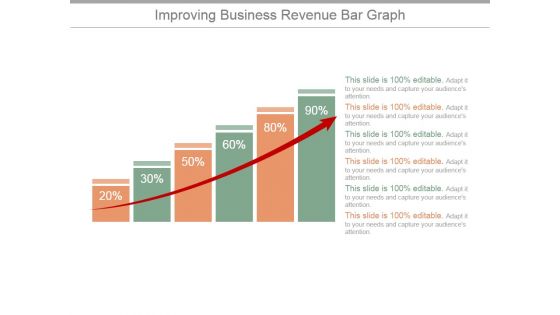
Improving Business Revenue Bar Graph Ppt PowerPoint Presentation Infographic Template
This is a improving business revenue bar graph ppt powerpoint presentation infographic template. This is a six stage process. The stages in this process are graph, arrow, finance, percentage, success.

Combo Chart Ppt PowerPoint Presentation Shapes
This is a combo chart ppt powerpoint presentation shapes. This is a eight stage process. The stages in this process are combo chart, business, marketing, sales in percentage, bar graph.
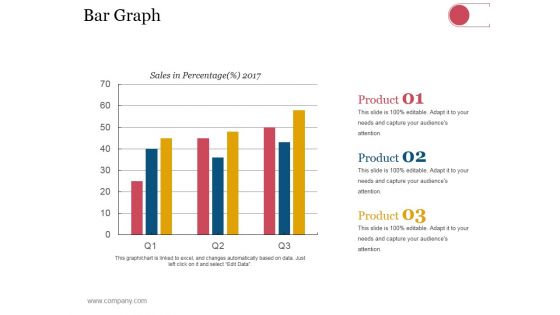
Bar Graph Ppt PowerPoint Presentation Visual Aids Model
This is a bar graph ppt powerpoint presentation visual aids model. This is a three stage process. The stages in this process are business, strategy, analysis, planning, sales in percentage.

Column Chart Ppt PowerPoint Presentation Gallery Design Inspiration
This is a column chart ppt powerpoint presentation gallery design inspiration. This is a two stage process. The stages in this process are column chart, product, sales in percentage, financial years.
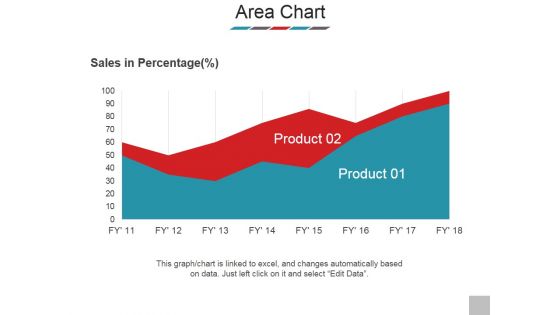
Area Chart Ppt PowerPoint Presentation Styles Images
This is a area chart ppt powerpoint presentation styles images. This is a two stage process. The stages in this process are sales in percentage, product, graph, business, marketing.

Scatter Chart Ppt PowerPoint Presentation Model Show
This is a scatter chart ppt powerpoint presentation model show. This is a one stage process. The stages in this process are sales in percentage, scatter chart, business, bar graph, marketing.
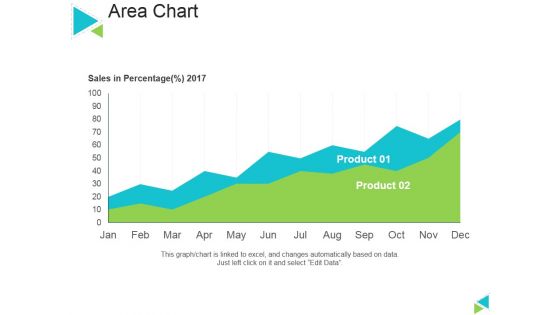
Area Chart Ppt PowerPoint Presentation Inspiration Themes
This is a area chart ppt powerpoint presentation inspiration themes. This is a two stage process. The stages in this process are sales in percentage, product, area chart, business, marketing.
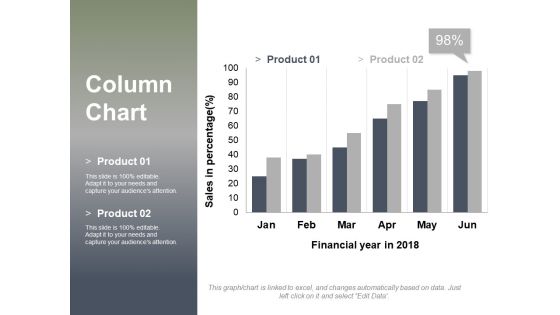
Column Chart Ppt PowerPoint Presentation Layouts Design Inspiration
This is a column chart ppt powerpoint presentation layouts design inspiration. This is a two stage process. The stages in this process are sales in percentage, financial year in, graph, business, finance, marketing.

Area Chart Financial Ppt PowerPoint Presentation Outline Professional
This is a area chart financial ppt powerpoint presentation outline professional. This is a four stage process. The stages in this process are product, sales in percentage, financial year.

Bar Graph For Increasing Sales Trend PowerPoint Template
Deliver amazing presentations with our above template showing bar graph with percentage values. You may download this slide to depict increase in sales trends. Capture the attention of your audience using this diagram.

Stacked Line Ppt PowerPoint Presentation File Display
This is a stacked line ppt powerpoint presentation file display. This is a three stage process. The stages in this process are business, strategy, marketing, analysis, revenue in percentage, stacked line.
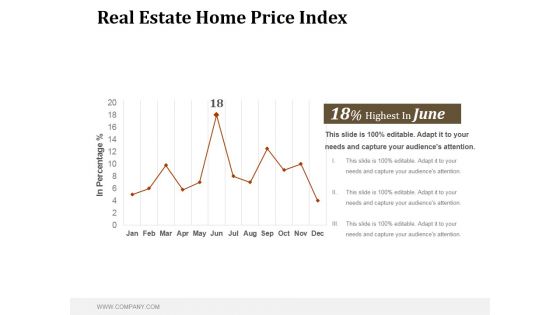
Real Estate Home Price Index Ppt PowerPoint Presentation Samples
This is a real estate home price index ppt powerpoint presentation samples. This is a one stage process. The stages in this process are in percentage, business, bar graph, marketing, success, management.
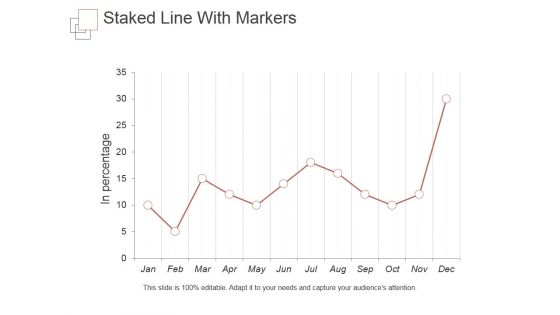
Staked Line With Markers Ppt PowerPoint Presentation Introduction
This is a staked line with markers ppt powerpoint presentation introduction. This is a one stage process. The stages in this process are in percentage, business, marketing, success, management.

Stacked Area Clustered Column Ppt PowerPoint Presentation Clipart
This is a stacked area clustered column ppt powerpoint presentation clipart. This is a four stage process. The stages in this process are in percentage, stacked area clustered column, product.
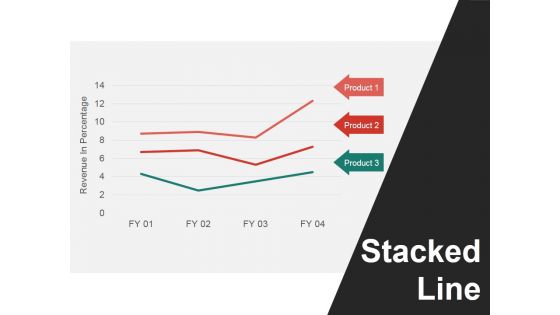
Stacked Line Ppt PowerPoint Presentation Summary Master Slide
This is a stacked line ppt powerpoint presentation summary master slide. This is a three stage process. The stages in this process are revenue in percentage, stacked line, product.

Scatter Chart Ppt PowerPoint Presentation Show Graphic Images
This is a scatter chart ppt powerpoint presentation show graphic images. This is a one stage process. The stages in this process are in percentage, in billions, scatter chart.
Business Diagram Boxes With Icons For Progress Presentation Template
Concept of currency output has been displayed with suitable icons given in this diagram. This diagram contains the graphic of four text boxes and percentage symbol. Use this template to highlight the key issues of your presentation.
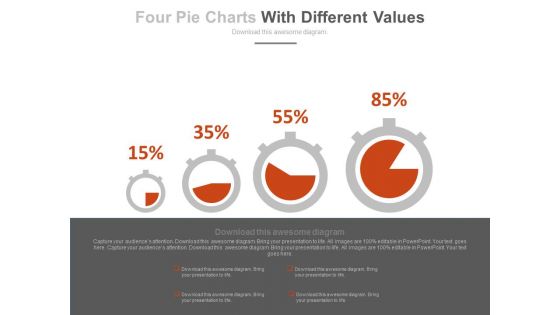
Dashboard With Increasing Values Powerpoint Slides
This innovative, stunningly beautiful dashboard has been designed for data visualization. It contains pie charts with increasing percentage values. This PowerPoint template helps to display your information in a useful, simple and uncluttered way.

Business Daigram Eight Staged Cylinder Design Chart Presentation Templets
This business diagram contains eight staged cylinder design chart with percentage ratio. Download this diagram to display financial analysis. Use this diagram to make business and marketing related presentations.
Quality Cost Report Ppt PowerPoint Presentation Icon Information
This is a quality cost report ppt powerpoint presentation icon information. This is a three stage process. The stages in this process are types of cost, quality cost, percentage of sales, prevention cost business.
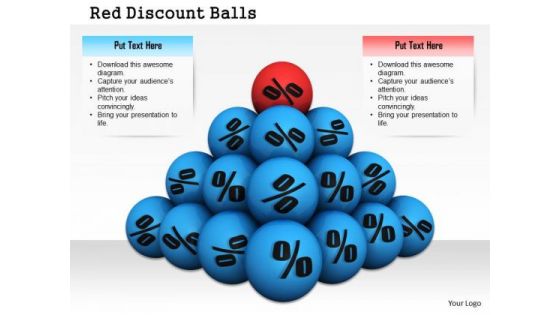
Stock Photo Pyramid Of Balls With Percent Symbols Pwerpoint Slide
This image has been crafted for displaying the concept of discount and leadership. This image contains the graphic of metal balls with percentage symbol on each ball. Use this image and build a unique presentation for business and marketing topics.

 Home
Home