AI PPT Maker
Templates
PPT Bundles
Design Services
Business PPTs
Business Plan
Management
Strategy
Introduction PPT
Roadmap
Self Introduction
Timelines
Process
Marketing
Agenda
Technology
Medical
Startup Business Plan
Cyber Security
Dashboards
SWOT
Proposals
Education
Pitch Deck
Digital Marketing
KPIs
Project Management
Product Management
Artificial Intelligence
Target Market
Communication
Supply Chain
Google Slides
Research Services
 One Pagers
All Categories
-
Home
- Customer Favorites
- Percentage Growth
Percentage Growth

IT Value Story Significant To Corporate Leadership Delivery Metrics Service Delivery Graphics PDF
This template covers service delivery metrics aligned to a business value, such as percentage of projects on time, on budget, on spec, and percentage of business facing services meeting service level agreements slas. Deliver and pitch your topic in the best possible manner with this it value story significant to corporate leadership delivery metrics service delivery graphics pdf. Use them to share invaluable insights on measure, metrics, resourcing, service and impress your audience. This template can be altered and modified as per your expectations. So, grab it now.

IT Value Story Significant To Corporate Leadership Innovation And Agility Metrics Service Topics PDF
This template covers IT service innovation and agility metrics aligned to a business value such as percentage of IT investment on run, grow, transform the business and percentage of project spend on customer facing initiatives. Deliver an awe inspiring pitch with this creative it value story significant to corporate leadership innovation and agility metrics service topics pdf bundle. Topics like investments, innovation, expenses, measures, technological can be discussed with this completely editable template. It is available for immediate download depending on the needs and requirements of the user.

Customer Mesh Computing IT Problems Faced By The Company Demonstration PDF
This slide describes the problems faced by the company that include the percentage of total spreadsheets, percentage of excel sheets that contains errors and number of managers who dont know about high risk spreadsheets. This is a customer mesh computing it problems faced by the company demonstration pdf template with various stages. Focus and dispense information on three stages using this creative set, that comes with editable features. It contains large content boxes to add your information on topics like problems faced by the company. You can also showcase facts, figures, and other relevant content using this PPT layout. Grab it now.
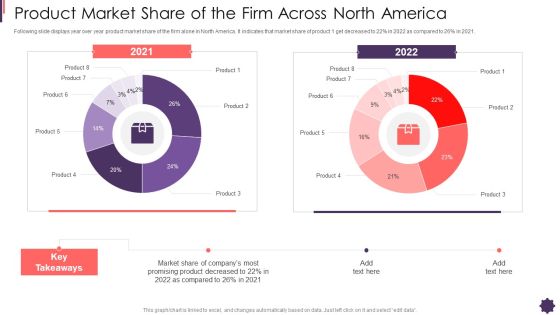
Product Market Share Of The Firm Across North America Brand Techniques Structure Microsoft PDF
Following slide displays year over year product market share of the firm alone in North America. It indicates that market share of product 1 get decreased to 22 percentage in 2022 as compared to 26 percentage in 2021. Deliver an awe inspiring pitch with this creative product market share of the firm across north america brand techniques structure microsoft pdf bundle. Topics like product market share of the firm across north america can be discussed with this completely editable template. It is available for immediate download depending on the needs and requirements of the user.
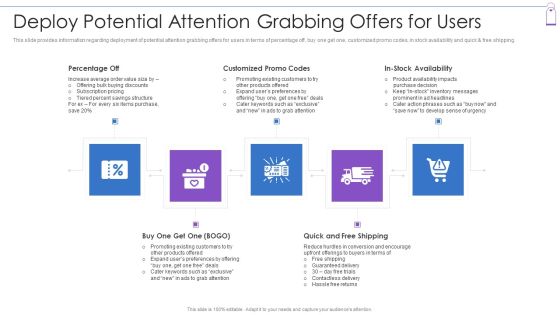
Retail Trading Platform Deploy Potential Attention Grabbing Offers For Users Ideas PDF
This slide provides information regarding deployment of potential attention grabbing offers for users in terms of percentage off, buy one get one, customized promo codes, in stock availability and quick and free shipping. Presenting retail trading platform deploy potential attention grabbing offers for users ideas pdf to provide visual cues and insights. Share and navigate important information on five stages that need your due attention. This template can be used to pitch topics like percentage off, customized promo codes, stock availability, quick and free shipping. In addtion, this PPT design contains high resolution images, graphics, etc, that are easily editable and available for immediate download.

Consumer Retention Techniques Future Estimated Patient Satisfaction Status At The Medical Introduction PDF
This slide shows the future Patient Satisfaction Status at the medical facility. This slide shows the percentage of patients that are satisfied and percentage that are dissatisfied at a medical facility after implementing patient satisfaction strategies. Deliver and pitch your topic in the best possible manner with this consumer retention techniques future estimated patient satisfaction status at the medical introduction pdf. Use them to share invaluable insights on patient satisfaction rate, patient satisfaction strategies, patient experience and impress your audience. This template can be altered and modified as per your expectations. So, grab it now.

Consumer Retention Techniques Key Patient Satisfaction Statistics On A Global Scale Information PDF
This slide shows the some of the general Patient Satisfaction Statistics on a Global Scale such as percentage of patients that value customer service, patients not willing to hold call, percentage of patients who want appointment reminder etc. Deliver an awe inspiring pitch with this creative consumer retention techniques key patient satisfaction statistics on a global scale information pdf bundle. Topics like healthcare institution, customer service, hospital itself can be discussed with this completely editable template. It is available for immediate download depending on the needs and requirements of the user.
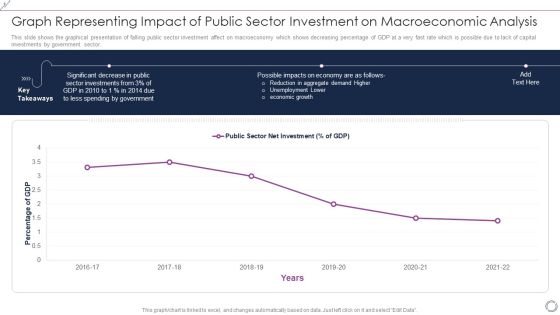
Graph Representing Impact Of Public Sector Investment On Macroeconomic Analysis Themes PDF
This slide shows the graphical presentation of falling public sector investment affect on macroeconomy which shows decreasing percentage of GDP at a very fast rate which is possible due to lack of capital investments by government sector. Showcasing this set of slides titled Graph Representing Impact Of Public Sector Investment On Macroeconomic Analysis Themes PDF. The topics addressed in these templates are Percentage GDP, 2016 to 2022, Public Sector Net Investment. All the content presented in this PPT design is completely editable. Download it and make adjustments in color, background, font etc. as per your unique business setting.
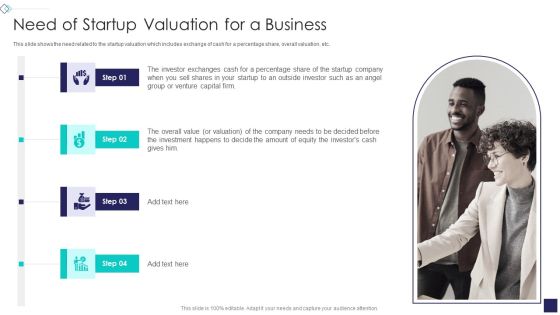
Startup Company Valuation Methodologies Need Of Startup Valuation For A Business Pictures PDF
This slide shows the need related to the startup valuation which includes exchange of cash for a percentage share, overall valuation, etc.Presenting Startup Company Valuation Methodologies Need Of Startup Valuation For A Business Pictures PDF to provide visual cues and insights. Share and navigate important information on four stages that need your due attention. This template can be used to pitch topics like Exchanges Cash For A Percentage, Startup To An Outside Investor, Investment Happens To Decide In addtion, this PPT design contains high resolution images, graphics, etc, that are easily editable and available for immediate download.

Key Employee Engagement Statistics On A Global Scale Ideas PDF
This slide shows the some of the general Employee Engagement Statistics on a Global Scale such as percentage of employees likely to stay within a company for three years, costs incurred by the companies due to low engagement levels, profitability due to high engagement, percentage that are dissatisfied with work life balance etc. Deliver an awe inspiring pitch with this creative Key Employee Engagement Statistics On A Global Scale Ideas PDF bundle. Topics like Work Life Balance, Effective Engagement, Employee Engagement can be discussed with this completely editable template. It is available for immediate download depending on the needs and requirements of the user.

Complete Guide For Total Employee Involvement Strategic Approach Key Employee Engagement Topics PDF
This slide shows the some of the general Employee Engagement Statistics on a Global Scale such as percentage of employees likely to stay within a company for three years, costs incurred by the companies due to low engagement levels, profitability due to high engagement, percentage that are dissatisfied with work life balance etc. Deliver an awe inspiring pitch with this creative Complete Guide For Total Employee Involvement Strategic Approach Key Employee Engagement Topics PDF bundle. Topics like Engagement Drops, Employee Engagement, Employees Consider can be discussed with this completely editable template. It is available for immediate download depending on the needs and requirements of the user.

Automating Supply Chain Dashboard For Tracking Impact Of Procurement Process Automation Themes PDF
This slide covers the dashboard for analysing procurement performance after automation. It include KPIs such as on-time delivery, percentage of returns, compliance index percentage, procurement ROI, cost-saving, budget spent on training, etc. Deliver an awe inspiring pitch with this creative Automating Supply Chain Dashboard For Tracking Impact Of Procurement Process Automation Themes PDF bundle. Topics like Procurement ROI, Cost Saving, Perform Procurement can be discussed with this completely editable template. It is available for immediate download depending on the needs and requirements of the user.

Inbound And Outbound Services Business Profile Integrated Performance Of The Company Brochure PDF
This slide highlights the integrated performance of call center which covers different elements such as jobs created, percentage of women, renewable energy consumption, employees trained on data security and code of conduct.Deliver an awe inspiring pitch with this creative Inbound And Outbound Services Business Profile Integrated Performance Of The Company Brochure PDF bundle. Topics like Percentage Of Women, Agents Trained, Technology And Analytics can be discussed with this completely editable template. It is available for immediate download depending on the needs and requirements of the user.

VID Problems Faced By The Company Professional PDF
This slide describes the problems faced by the company that include the percentage of total spreadsheets, percentage of excel sheets that contains errors and number of managers who dont know about high risk spreadsheets.Presenting VID Problems Faced By The Company Professional PDF to provide visual cues and insights. Share and navigate important information on one stage that need your due attention. This template can be used to pitch topics like Problems Faced, Spreadsheets Make, Jeopardy. In addtion, this PPT design contains high resolution images, graphics, etc, that are easily editable and available for immediate download.

Knowledge Process Outsourcing Company Profile Integrated Performance Of The Company Clipart PDF
This slide highlights the integrated performance of call center which covers different elements such as jobs created, percentage of women, renewable energy consumption, employees trained on data security and code of conduct.Deliver an awe inspiring pitch with this creative Knowledge Process Outsourcing Company Profile Integrated Performance Of The Company Clipart PDF bundle. Topics like Percentage Of Women, Agents Trained, Technology And Analytics can be discussed with this completely editable template. It is available for immediate download depending on the needs and requirements of the user.

Cost Allotment Technique Cost Allocation Method Used Infographics PDF
This slide covers the final allocation base percentage of the allocation base with its numerator, denominator and percentage of the total multiplied by indirect cost.Presenting Cost Allotment Technique Cost Allocation Method Used Infographics PDF to provide visual cues and insights. Share and navigate important information on one stage that need your due attention. This template can be used to pitch topics like Allocation Base, Allocated Cost, Allocation Base. In addtion, this PPT design contains high resolution images, graphics, etc, that are easily editable and available for immediate download.

End User Computing Problems Faced By The Company Template PDF
This slide describes the problems faced by the company that include the percentage of total spreadsheets, percentage of excel sheets that contains errors and number of managers who dont know about high risk spreadsheets.Presenting End User Computing Problems Faced By The Company Template PDF to provide visual cues and insights. Share and navigate important information on one stage that need your due attention. This template can be used to pitch topics like Official Laptops, Spreadsheets Posses, Problems Faced. In addtion, this PPT design contains high resolution images, graphics, etc, that are easily editable and available for immediate download.

Real Estate Developers Funding Alternatives What Will Be Our Project Financing Structure Rules PDF
Following slide illustrates information about the companys real estate project financing structure. It shows that finance structure of the project will be 30 percentage of equity and 70 percentage of debt. Deliver and pitch your topic in the best possible manner with this Real Estate Developers Funding Alternatives What Will Be Our Project Financing Structure Rules PDF. Use them to share invaluable insights on Investors, Debt Service, Resource Loan and impress your audience. This template can be altered and modified as per your expectations. So, grab it now.

Financial Structure Approach Table With Debt Equity Ratio Professional PDF
This slide contains a table showing the calculation of owners capital and debt and the percentage of the both. It also includes the calculation of debt equity ratio to know the percentage of company financing that comes from creditors and investors. Showcasing this set of slides titled Financial Structure Approach Table With Debt Equity Ratio Professional PDF. The topics addressed in these templates are Preferred Stock, Debt, Debt Equity. All the content presented in this PPT design is completely editable. Download it and make adjustments in color, background, font etc. as per your unique business setting.

Activities Promotional Pricing Tips And Tricks To Boost Sales Ppt Gallery Example File PDF
This slide illustrate different promotional pricing tips on the based on how customer think about the offer. It includes elements such as mention both old and new price, use percentage sign in deals, use same price for luxury products and decrease discounts strategically. Presenting Activities Promotional Pricing Tips And Tricks To Boost Sales Ppt Gallery Example File PDF to dispense important information. This template comprises four stages. It also presents valuable insights into the topics including Mention Both Old, New Price, Use Percentage, Sign Deals. This is a completely customizable PowerPoint theme that can be put to use immediately. So, download it and address the topic impactfully.

Client Consultancy Services Business Performance Dashboard Ppt File Layout PDF
This slide shows dashboard to determine overall performance and customer satisfaction of consultancy business. It includes various elements such as total revenue, percentage of support cost, cost per support, average time to solve problem etc. Showcasing this set of slides titled Client Consultancy Services Business Performance Dashboard Ppt File Layout PDF. The topics addressed in these templates are Revenue And Percentage, Support Cost, Cost Per Support. All the content presented in this PPT design is completely editable. Download it and make adjustments in color, background, font etc. as per your unique business setting.

Car Company Market Share Circle Chart Slides PDF
This slide depicts the market share percentage chart of car companies in the USA to determine the market leader. It shows percentage share of General motors, Toyota, Stellanis, and Hyundai. Showcasing this set of slides titled Car Company Market Share Circle Chart Slides PDF. The topics addressed in these templates are Car Company Market, Share Circle Chart. All the content presented in this PPT design is completely editable. Download it and make adjustments in color, background, font etc. as per your unique business setting.

Sales Sales By Geographic Region Report With Doughnut Chart Themes PDF
This slide illustrates graphical representation of sales contribution of countries. It includes revenue of FY19 in percentage and numbers and revenue of FY20 in percentage and numbers. Showcasing this set of slides titled Sales Sales By Geographic Region Report With Doughnut Chart Themes PDF. The topics addressed in these templates are Revenue, Doughnut Chart, Geographic Region Report. All the content presented in this PPT design is completely editable. Download it and make adjustments in color, background, font etc. as per your unique business setting.
Scatter Chart Ppt PowerPoint Presentation Icon Elements
This is a scatter chart ppt powerpoint presentation icon elements. This is a nine stage process. The stages in this process are dollar in billions, sales in percentage, business, success.
Scatter Line Chart Ppt PowerPoint Presentation Icon Files
This is a scatter line chart ppt powerpoint presentation icon files. This is a one stage process. The stages in this process are dollar in millions, product, sales in percentage.

Scatter With Smooth Line Ppt PowerPoint Presentation Professional Display
This is a scatter with smooth line ppt powerpoint presentation professional display. This is a nine stage process. The stages in this process are sale price, business, marketing, percentage, finance.

Clustered Column Ppt PowerPoint Presentation Infographic Template Background Designs
This is a clustered column ppt powerpoint presentation infographic template background designs. This is a two stage process. The stages in this process are sales in percentage, bar, business, marketing, planning.
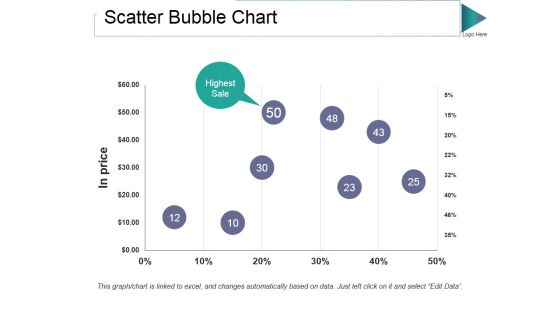
Scatter Bubble Chart Ppt PowerPoint Presentation Gallery Guidelines
This is a scatter bubble chart ppt powerpoint presentation gallery guidelines. This is a one stage process. The stages in this process are in price, highest sale, percentage, finance, business.

Column Chart Ppt PowerPoint Presentation Model Graphics Download
This is a column chart ppt powerpoint presentation model graphics download. This is a two stage process. The stages in this process are product, financial year, sales in percentage, bar graph, success.

Bar Graph Ppt PowerPoint Presentation Slides Deck
This is a bar graph ppt powerpoint presentation slides deck. This is a three stage process. The stages in this process are financial in years, product, sales in percentage.

Line Chart Ppt PowerPoint Presentation Infographics Infographics
This is a line chart ppt powerpoint presentation infographics infographics. This is a two stage process. The stages in this process are product, sales in percentage, financial year, line chart, finance.
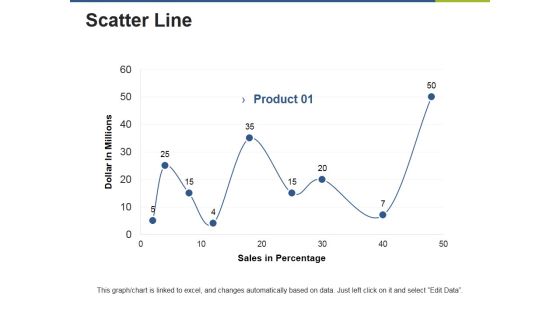
Scatter Line Ppt PowerPoint Presentation Gallery Clipart Images
This is a scatter line ppt powerpoint presentation gallery clipart images. This is a one stage process. The stages in this process are product, dollar in millions, sales in percentage.

Clustered Column Ppt PowerPoint Presentation Gallery Structure
This is a clustered column ppt powerpoint presentation gallery structure. This is a two stage process. The stages in this process are product, sales in percentage, financial year, bar graph, finance.

Line Chart Ppt PowerPoint Presentation Gallery Templates
This is a line chart ppt powerpoint presentation gallery templates. This is a two stage process. The stages in this process are product, financial years, sales in percentage, line chart.

Scatter Line Ppt PowerPoint Presentation Professional Design Inspiration
This is a scatter line ppt powerpoint presentation professional design inspiration. This is a one stage process. The stages in this process are product, sales in percentage, dollar in millions.

Scatter Line Ppt PowerPoint Presentation Styles Graphics Pictures
This is a scatter line ppt powerpoint presentation styles graphics pictures. This is a one stage process. The stages in this process are product, dollar in millions, sales in percentage.
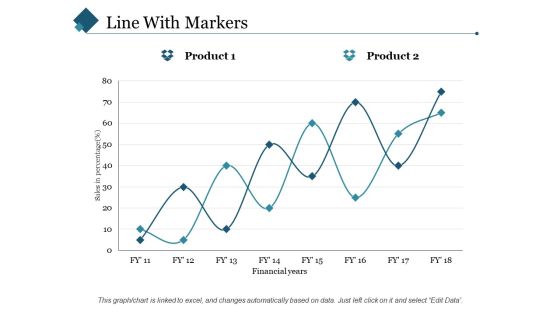
Line With Markers Ppt PowerPoint Presentation Styles Slide Portrait
This is a line with markers ppt powerpoint presentation styles slide portrait. This is a two stage process. The stages in this process are sales in percentage, financial years, product.
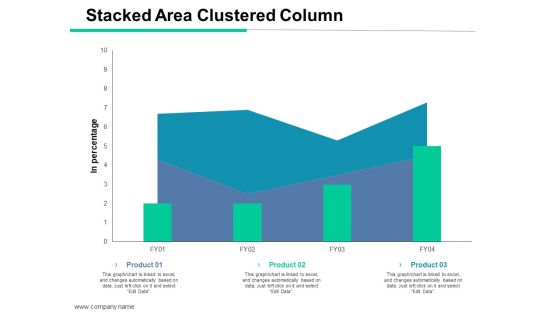
Stacked Area Clustered Column Ppt PowerPoint Presentation File Templates
This is a stacked area clustered column ppt powerpoint presentation file templates. This is a three stage process. The stages in this process are stacked area clustered column, product, financial, sales in percentage, management.

Column Chart Ppt PowerPoint Presentation Portfolio Example Topics
This is a column chart ppt powerpoint presentation portfolio example topics. This is a two stage process. The stages in this process are product, financial year, sales in percentage, column chart.

Bar Graph Ppt PowerPoint Presentation Introduction
This is a bar graph ppt powerpoint presentation introduction. This is a eleven stage process. The stages in this process are management, marketing, business, fy, graph, sales in percentage.

Clustered Column Ppt PowerPoint Presentation File Slide
This is a clustered column ppt powerpoint presentation file slide. This is a two stage process. The stages in this process are product, financial year, sales in percentage, bar graph.

Clustered Column Ppt PowerPoint Presentation Slides Smartart
This is a clustered column ppt powerpoint presentation slides smartart. This is a two stage process. The stages in this process are product, sales in percentage, financial year, bar graph.

Column Chart Ppt PowerPoint Presentation Gallery Background
This is a column chart ppt powerpoint presentation gallery background. This is a two stage process. The stages in this process are product, sales in percentage, financial year, graph, success.

Scatter Bubble Chart Ppt PowerPoint Presentation Styles Objects
This is a scatter bubble chart ppt powerpoint presentation styles objects. This is a two stage process. The stages in this process are product, in price, highest sale, percentage, finance.
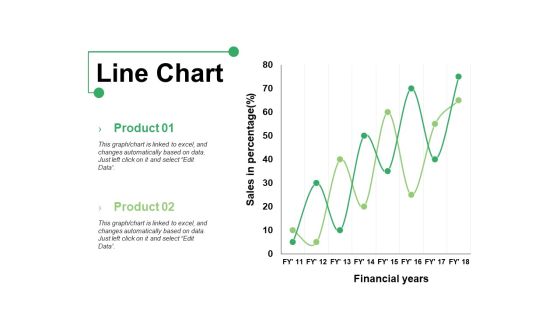
Line Chart Ppt PowerPoint Presentation Show Graphics Example
This is a line chart ppt powerpoint presentation show graphics example. This is a two stage process. The stages in this process are product, line chart, financial years, sales in percentage.

Bar Chart Ppt PowerPoint Presentation Infographics Format Ideas
This is a bar chart ppt powerpoint presentation infographics format ideas. This is a two stage process. The stages in this process are bar graph, product, financial year, sales in percentage.

Line Chart Ppt PowerPoint Presentation Professional Grid
This is a line chart ppt powerpoint presentation professional grid. This is a two stage process. The stages in this process are sales in percentage, financial years, product, line chart.
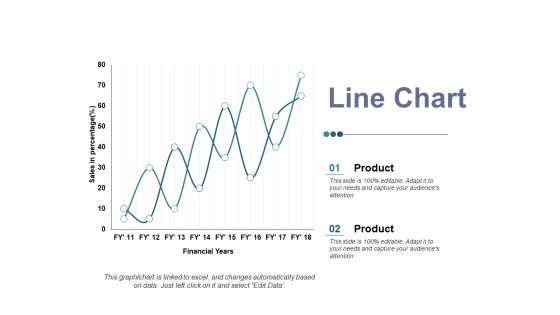
Line Chart Ppt PowerPoint Presentation Ideas Elements
This is a line chart ppt powerpoint presentation ideas elements. This is a two stage process. The stages in this process are product, sales in percentage, financial year, business, line chart.

Line Chart Ppt PowerPoint Presentation Infographic Template Master Slide
This is a line chart ppt powerpoint presentation infographic template master slide. This is a two stage process. The stages in this process are product, financial years, sales in percentage.

Clustered Column Ppt PowerPoint Presentation Infographic Template Backgrounds
This is a clustered column ppt powerpoint presentation infographic template backgrounds. This is a two stage process. The stages in this process are sales in percentage, financial year, product.

Scatter Line Ppt PowerPoint Presentation Infographics Background Images
This is a scatter line ppt powerpoint presentation infographics background images. This is a one stage process. The stages in this process are dollar in millions, product, sales in percentage.
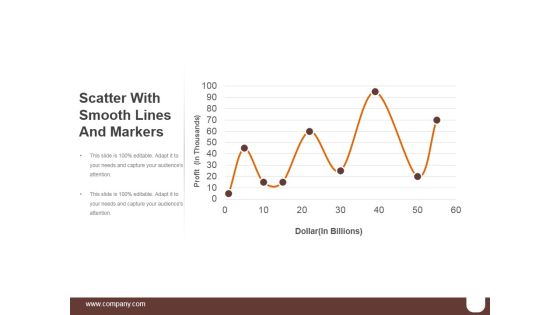
Scatter With Smooth Lines And Markers Ppt PowerPoint Presentation Ideas
This is a scatter with smooth lines and markers ppt powerpoint presentation ideas. This is a seven stage process. The stages in this process are business, marketing, percentage, success, finance.

Scatter Chart Ppt PowerPoint Presentation Outline Ideas
This is a scatter chart ppt powerpoint presentation outline ideas. This is a two stage process. The stages in this process are product, scatter chart, business, in percentage, marketing.

Stacked Area Clustered Column Ppt PowerPoint Presentation Layouts Templates
This is a stacked area clustered column ppt powerpoint presentation layouts templates. This is a three stage process. The stages in this process are product, in percentage, area chart.

Area Chart Ppt PowerPoint Presentation Icon Summary
This is a area chart ppt powerpoint presentation icon summary. This is a two stage process. The stages in this process are financial year, area chart, in percentage, product.

Stacked Area Clustered Column Ppt PowerPoint Presentation Professional Influencers
This is a stacked area clustered column ppt powerpoint presentation professional influencers. This is a three stage process. The stages in this process are stacked area clustered column, percentage, product, year.

Line Chart Ppt PowerPoint Presentation Infographic Template Design Ideas
This is a line chart ppt powerpoint presentation infographic template design ideas. This is a two stage process. The stages in this process are product, in millions, percentage, line chart, success.
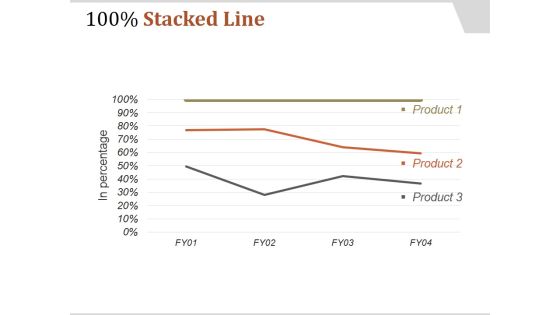
Stacked Line Template 1 Ppt PowerPoint Presentation Background Images
This is a stacked line template 1 ppt powerpoint presentation background images. This is a three stage process. The stages in this process are in percentage, product, business, management.

Funding Updates Equity Ppt PowerPoint Presentation Ideas Diagrams
This is a funding updates equity ppt powerpoint presentation ideas diagrams. This is a three stage process. The stages in this process are shareholder name, shareholding pattern, total shares, percentage.

Clustered Column Line Ppt Powerpoint Presentation Ideas Inspiration
This is a clustered column line ppt powerpoint presentation ideas inspiration. This is a four stage process. The stages in this process are product, in percentage, graph, management, business.

Market Insights Template 2 Ppt Powerpoint Presentation Pictures Gallery
This is a market insights template 2 ppt powerpoint presentation pictures gallery. This is a three stage process. The stages in this process are in percentage, insight, icons, strategy, business.
Financial Highlights Ppt PowerPoint Presentation Icon Slide Download
This is a financial highlights ppt powerpoint presentation icon slide download. This is a three stage process. The stages in this process are percentage, business, strategy, management, finance, analysis.

business model template 2 ppt powerpoint presentation styles
This is a business model template 2 ppt powerpoint presentation styles styles. This is a three stage process. The stages in this process are business, marketing, strategy, management, model, percentage.
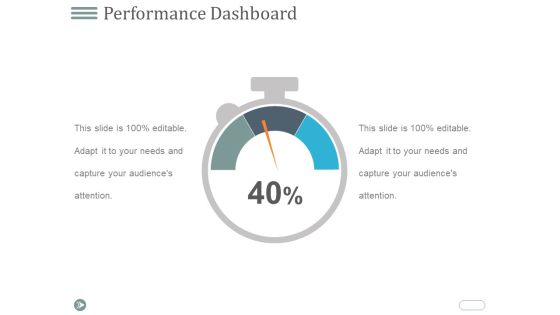
Performance Dashboard Ppt PowerPoint Presentation Visual Aids Example 2015
This is a performance dashboard ppt powerpoint presentation visual aids example 2015. This is a one stage process. The stages in this process are dashboard, percentage, business, marketing, strategy.

Use Of Funds Ppt PowerPoint Presentation Ideas Designs Download
This is a use of funds ppt powerpoint presentation ideas designs download. This is a four stage process. The stages in this process are product development, percentage, marketing, operational cost, new hires.
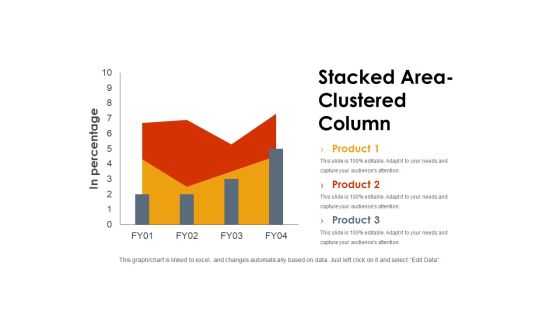
Stacked Area Clustered Column Ppt PowerPoint Presentation Styles Background Image
This is a stacked area clustered column ppt powerpoint presentation styles background image. This is a three stage process. The stages in this process are in percentage, graph, business, marketing, finance.
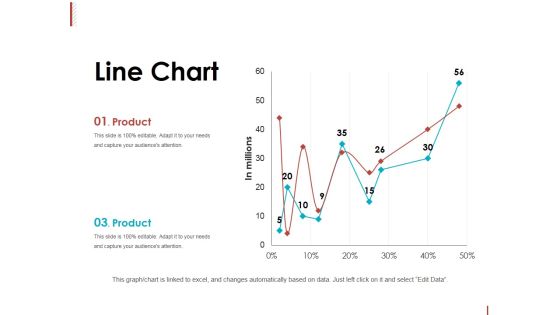
Line Chart Ppt PowerPoint Presentation Slides Graphics Tutorials
This is a line chart ppt powerpoint presentation slides graphics tutorials. This is a two stage process. The stages in this process are product, in millions, line chart, percentage, finance.
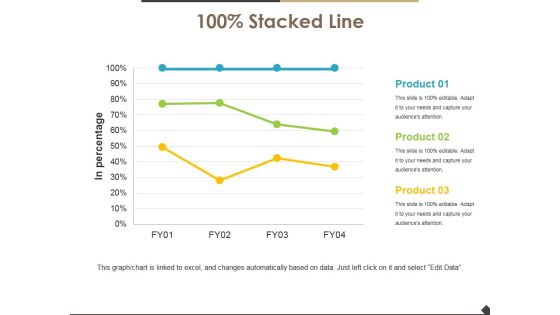
Stacked Line Ppt PowerPoint Presentation Show Templates
This is a stacked line ppt powerpoint presentation show templates. This is a three stage process. The stages in this process are stacked line, in percentage, finance, marketing, business.

Column Chart Ppt PowerPoint Presentation Layouts Vector
This is a column chart ppt powerpoint presentation layouts vector. This is a two stage process. The stages in this process are product, column chart, bar graph, percentage, finance.

Stacked Area Clustered Column Ppt PowerPoint Presentation Gallery Gridlines
This is a stacked area clustered column ppt powerpoint presentation gallery gridlines. This is a three stage process. The stages in this process are bar graph, product, in percentage.

Stacked Area Clustered Column Ppt PowerPoint Presentation Outline Diagrams
This is a stacked area clustered column ppt powerpoint presentation outline diagrams. This is a three stage process. The stages in this process are product, in percentage, area chart.
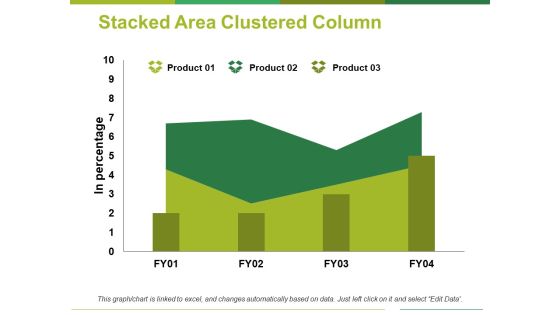
Stacked Area Clustered Column Ppt PowerPoint Presentation Professional Clipart
This is a stacked area clustered column ppt powerpoint presentation professional clipart. This is a three stage process. The stages in this process are product, in percentage, area chart.

Area Chart Ppt PowerPoint Presentation Icon Show
This is a area chart ppt powerpoint presentation icon show. This is a two stage process. The stages in this process are product, financial year, in percentage, area chart.

Clustered Chart Ppt PowerPoint Presentation Outline Templates
This is a clustered chart ppt powerpoint presentation outline templates. This is a three stage process. The stages in this process are product, in percentage, in years, clustered chart.

Stacked Area Clustered Column Ppt PowerPoint Presentation Summary Slides
This is a stacked area clustered column ppt powerpoint presentation summary slides. This is a three stage process. The stages in this process are product, in percentage, financial year, bar graph.

Hiring Plan Positions By Quarter Ppt PowerPoint Presentation Slides Deck
This is a hiring plan positions by quarter ppt powerpoint presentation slides deck. This is a five stage process. The stages in this process are percentage, product, business, management.

Bar Graph Product Ppt PowerPoint Presentation Model Graphic Tips
This is a bar graph product ppt powerpoint presentation model graphic tips. This is a three stage process. The stages in this process are product, percentage, business, management, marketing.
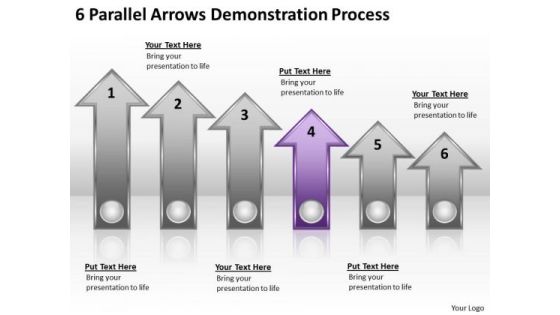
Advantage Of Parallel Processing 6 Arrows Demonstration PowerPoint Slides
We present our advantage of parallel processing 6 arrows demonstration PowerPoint Slides.Present our Arrows PowerPoint Templates because Your ideas provide food for thought. Our PowerPoint Templates and Slides will help you create a dish to tickle the most discerning palate. Use our Business PowerPoint Templates because Our PowerPoint Templates and Slides will let you Leave a lasting impression to your audiences. They possess an inherent longstanding recall factor. Present our Success PowerPoint Templates because It is Aesthetically crafted by artistic young minds. Our PowerPoint Templates and Slides are designed to display your dexterity. Present our Shapes PowerPoint Templates because You should Kick up a storm with our PowerPoint Templates and Slides. The heads of your listeners will swirl with your ideas. Use our Symbol PowerPoint Templates because Our PowerPoint Templates and Slides are topically designed to provide an attractive backdrop to any subject.Use these PowerPoint slides for presentations relating to accounting, arrow, ascending, background, bank, blue, business, charts, compare, comparison, computer, corporate, count, descending, fame, famous, finance, generated, gradient, grow, growth, illustration, income, international, linear, money, papers, parallel, percentage, point, record, scale, shares, signs, stock, success, symbols, tax, tip, vary, white, world. The prominent colors used in the PowerPoint template are Purple, Gray, White. You can be sure our advantage of parallel processing 6 arrows demonstration PowerPoint Slides help you meet deadlines which are an element of today's workplace. Just browse and pick the slides that appeal to your intuitive senses. People tell us our compare PowerPoint templates and PPT Slides will make you look like a winner. You can be sure our advantage of parallel processing 6 arrows demonstration PowerPoint Slides are second to none. Use our blue PowerPoint templates and PPT Slides are topically designed to provide an attractive backdrop to any subject. Presenters tell us our advantage of parallel processing 6 arrows demonstration PowerPoint Slides will save the presenter time. We assure you our bank PowerPoint templates and PPT Slides will help them to explain complicated concepts.
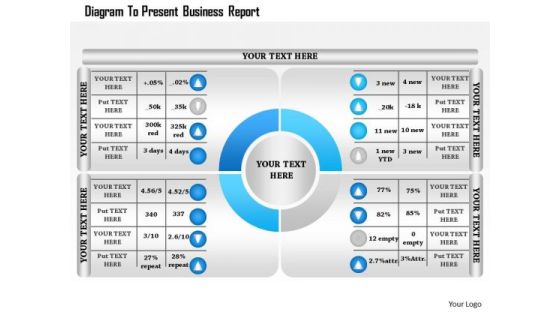
Business Diagram To Present Business Report Presentation Template
Four staged percentage personalized chart has been used to craft this power point template. This PPT contains the concept of data analysis and financial result analysis. This PPT can be used for your data and finance related topics in any business and marketing presentation.
Poor Customer Service Icon Leading To Decline Of Sales Clipart PDF
Presenting Percentage Of Decline Of Sales Analysis For Logistics Company Topics PDF to dispense important information. This template comprises three stages. It also presents valuable insights into the topics including Poor Customer Service, Leading To Decline Of Sales. This is a completely customizable PowerPoint theme that can be put to use immediately. So, download it and address the topic impactfully.
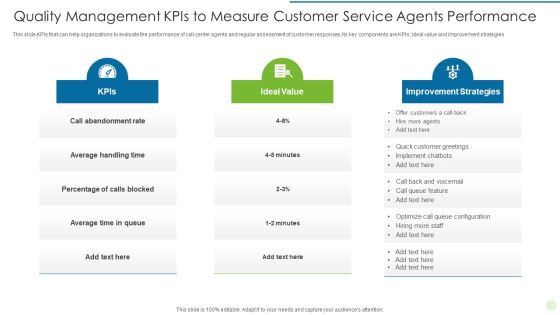
Quality Management Kpis To Measure Customer Service Agents Performance Sample PDF
Presenting Quality Management Kpis To Measure Customer Service Agents Performance Sample PDF to dispense important information. This template comprises three stages. It also presents valuable insights into the topics including Improvement Strategies, Customer Greetings, Percentage Of Calls Blocked This is a completely customizable PowerPoint theme that can be put to use immediately. So, download it and address the topic impactfully.
Key Performance Indicator In Recruitment Ppt PowerPoint Presentation Show Graphic Tips
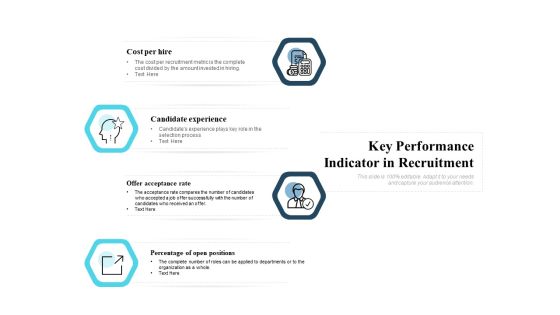
Presenting this set of slides with name key performance indicator in recruitment ppt powerpoint presentation show graphic tips. This is a four stage process. The stages in this process are cost per hire, candidate experience, offer acceptance rate, percentage of open positions. This is a completely editable PowerPoint presentation and is available for immediate download. Download now and impress your audience.
Survey Response Results KPI Dashboard With Companys Net Promoter Score Graphics PDF
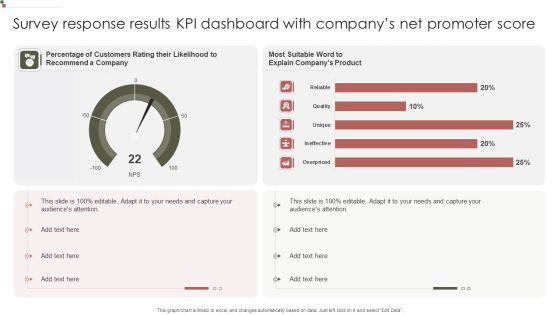
Pitch your topic with ease and precision using this Survey Response Results KPI Dashboard With Companys Net Promoter Score Graphics PDF. This layout presents information on Recommend Company, Percentage Customers, Explain Companys. It is also available for immediate download and adjustment. So, changes can be made in the color, design, graphics or any other component to create a unique layout.
Stock Photo Piggy Bank With Currency Symbols And Umbrella PowerPoint Slide
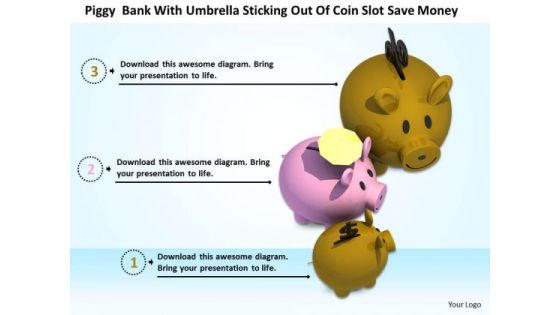
This image slide displays piggy banks for saving concept. This image slide has been crafted with graphic of colorful piggy banks with umbrella, percentage symbol and dollar symbol. Use this imager slide, in your presentations to express views on monetary savings, finance and protection. This image slide will enhance the quality of your presentations.

Business Framework Technology Adoption Curve PowerPoint Presentation
This business diagram displays framework of technology adoption curve. It contains curved graph of adoption gap depicting percentage ratio of innovators, early adopter, early majority, late majority and laggards. This diagram enables the users to create their own display of the required processes in an easy way.

Business Diagram 3d Pie Chart One Blue Piece Presentation Template
This business plan power point diagram template has been designed with graphic of 3d pyramid and five stages. Explain the concept of percentage and finance related topics in your financial presentations. Use this diagram template and display linear sequential flow of any financial process.

Ratio Of Social Media Users Powerpoint Slides
This PowerPoint template contains diagram of social media icons with percentage ratios. You may download this PPT slide design to display ratio of social media users. You can easily customize this template to make it more unique as per your need.
World Map For Global Business Report Powerpoint Slides
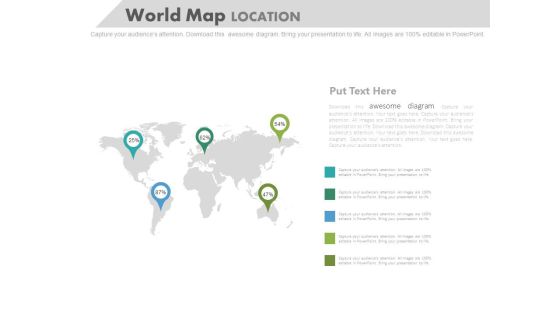
This PowerPoint template has been designed with World Map with pointers and percentage values. You may use this slide for global economy related topics. This diagram provides an effective way of displaying information you can edit text, color, shade and style as per you need.

Impact Scoring Matrix Powerpoint Presentation Examples
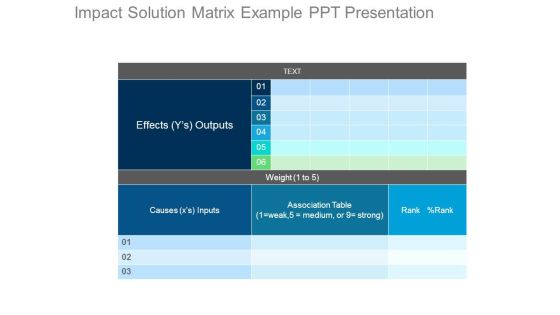
This is a impact scoring matrix powerpoint presentation examples. This is a one stage process. The stages in this process are effects, outputs, weight 1 to 5, causes x s inputs, association table, 1 weak 5, medium or 9 strong, rank percentage rank.
Impact Solution Matrix Example Ppt Presentation
This is a impact solution matrix example ppt presentation. This is a one stage process. The stages in this process are association table 1, weak 5 medium, or 9 strong, effects ys outputs, weight 1 to 5, causes xs inputs, rank percentage rank.
Product Strategy And Product Management Implementation Market Adoption Curve Ppt Layouts Gridlines PDF
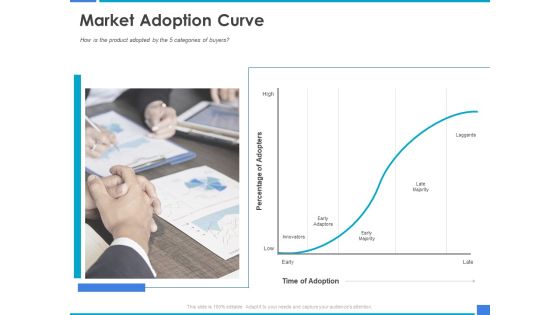
Presenting this set of slides with name product strategy and product management implementation market adoption curve ppt layouts gridlines pdf. This is a one stage process. The stages in this process are percentage adopters, time adoption, innovators, early adaptors, early majority, late majority, laggards. This is a completely editable PowerPoint presentation and is available for immediate download. Download now and impress your audience.
Project Cost And Expenses Gap Analysis Chart Ppt PowerPoint Presentation Infographics Graphics PDF
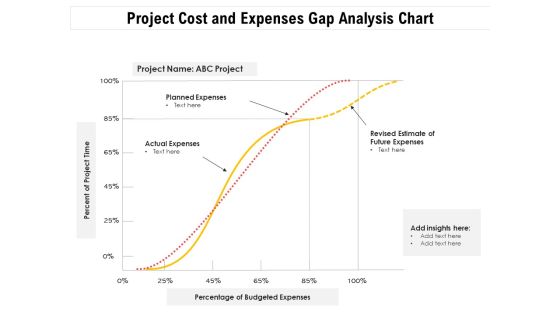
Presenting this set of slides with name project cost and expenses gap analysis chart ppt powerpoint presentation infographics graphics pdf. The topics discussed in these slides are planned expenses, actual expenses, revised estimate of future expenses, percent of project time, percentage of budgeted expenses. This is a completely editable PowerPoint presentation and is available for immediate download. Download now and impress your audience.
Integrated Water Resource Management Water Management KPI Metrics Showing Domestic Water Consumption Professional PDF
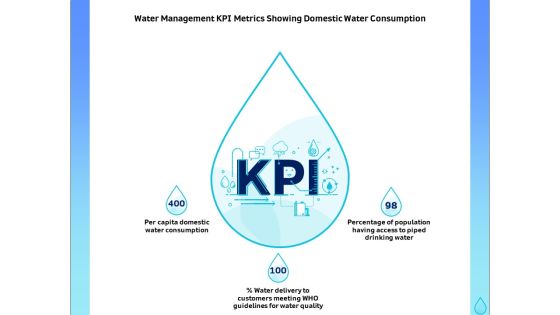
Presenting this set of slides with name integrated water resource management water management kpi metrics showing domestic water consumption professional pdf. The topics discussed in these slides are per capita domestic, water consumption, percentage population, piped drinking water, who guidelines water quality, customers meeting. This is a completely editable PowerPoint presentation and is available for immediate download. Download now and impress your audience.

Managing Agriculture Land And Water Water Management KPI Metrics Showing Domestic Water Consumption Clipart PDF
Presenting this set of slides with name managing agriculture land and water water management kpi metrics showing domestic water consumption clipart pdf. The topics discussed in these slides are per capita domestic, water consumption, percentage population, piped drinking water, who guidelines water quality, customers meeting. This is a completely editable PowerPoint presentation and is available for immediate download. Download now and impress your audience.
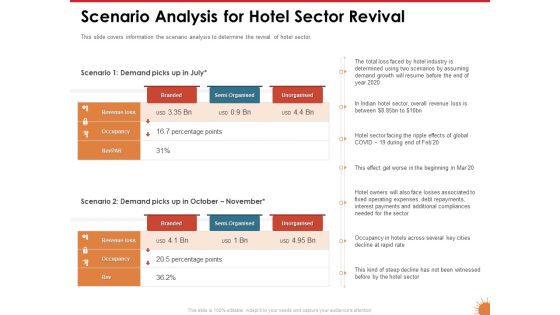
Impact Of COVID 19 On The Hospitality Industry Scenario Analysis For Hotel Sector Revival Template PDF
Presenting this set of slides with name impact of covid 19 on the hospitality industry scenario analysis for hotel sector revival template pdf. The topics discussed in these slides are occupancy, raw, revenue loss, percentage points. This is a completely editable PowerPoint presentation and is available for immediate download. Download now and impress your audience.

Water NRM Water Management KPI Metrics Showing Domestic Water Consumption Pictures PDF
Presenting this set of slides with name water nrm water management kpi metrics showing domestic water consumption pictures pdf. The topics discussed in these slides are percentage of population having access to piped drinking water, per capita domestic water consumption. This is a completely editable PowerPoint presentation and is available for immediate download. Download now and impress your audience.

Alliance Evaluation Yoy Analysis Of Synergy Capture Ppt Outline Deck PDF
Presenting this set of slides with name alliance evaluation yoy analysis of synergy capture ppt outline deck pdf. The topics discussed in these slides are percentage of total synergy target captured. This is a completely editable PowerPoint presentation and is available for immediate download. Download now and impress your audience.

Power Management System And Technology Establish Baselines Cost Ppt PowerPoint Presentation Outline Information PDF
Presenting this set of slides with name power management system and technology establish baselines cost ppt powerpoint presentation outline information pdf. The topics discussed in these slides are total annual consumption, productivity, total annual cost, value, percentage of total plant energy cost, production units. This is a completely editable PowerPoint presentation and is available for immediate download. Download now and impress your audience.
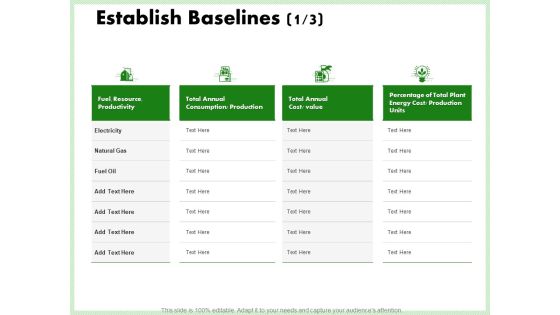
Eco Friendly And Feasibility Management Establish Baselines Productivity Graphics PDF
Deliver an awe-inspiring pitch with this creative eco friendly and feasibility management establish baselines productivity graphics pdf. bundle. Topics like resource, productivity consumption, production, percentage total plant can be discussed with this completely editable template. It is available for immediate download depending on the needs and requirements of the user.
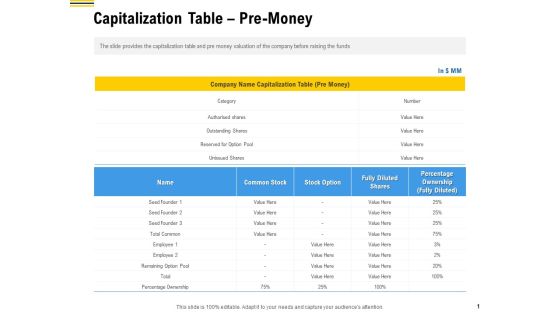
Raise Funding From Pre Seed Money Capitalization Table Pre Money Ideas PDF
Showcasing this set of slides titled raise funding from pre seed money capitalization table pre money ideas pdf. The topics addressed in these templates are name capitalization table company, capitalization, common stock, fully diluted shares, percentage ownership. All the content presented in this PPT design is completely editable. Download it and make adjustments in color, background, font etc. as per your unique business setting.

Assessing Synergies Yoy Analysis Of Synergy Capture Ppt PowerPoint Presentation Pictures Visuals PDF
Deliver an awe-inspiring pitch with this creative assessing synergies yoy analysis of synergy capture ppt powerpoint presentation pictures visuals pdf bundle. Topics like percentage total synergy target captured, verage revenue synergies, cost synergies illustrative can be discussed with this completely editable template. It is available for immediate download depending on the needs and requirements of the user.
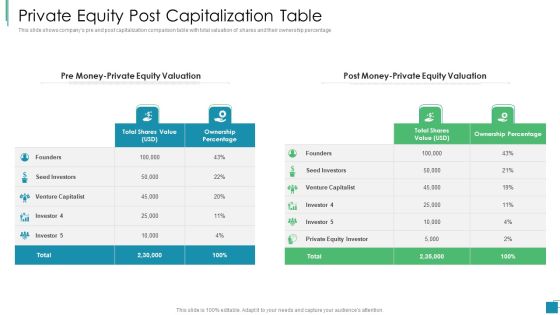
Venture Capital Pitch Decks For Private Companies Private Equity Post Capitalization Table Slides PDF
Deliver an awe inspiring pitch with this creative venture capital pitch decks for private companies private equity post capitalization table slides pdf bundle. Topics like seed investors, founders, venture capitalist, ownership percentage can be discussed with this completely editable template. It is available for immediate download depending on the needs and requirements of the user.

Business Ownership Structure Including Shareholders Template PDF
This slide Provides the structure of company ownership including shareholders with their amount and percentage of shares. Deliver an awe inspiring pitch with this creative business ownership structure including shareholders template pdf bundle. Topics like business ownership structure including shareholders can be discussed with this completely editable template. It is available for immediate download depending on the needs and requirements of the user.

Business Cash Flow Statement With Investing Activities Ppt PowerPoint Presentation File Smartart PDF
Showcasing this set of slides titled business cash flow statement with investing activities ppt powerpoint presentation file smartart pdf. The topics addressed in these templates are percentage of sale, net income, sale of fixed assets. All the content presented in this PPT design is completely editable. Download it and make adjustments in color, background, font etc. as per your unique business setting.

Business Synergies Yoy Analysis Of Synergy Capture Ppt File Slides PDF
Deliver and pitch your topic in the best possible manner with this business synergies yoy analysis of synergy capture ppt file slides pdf. Use them to share invaluable insights on average revenue synergies, cost synergies, percentage and impress your audience. This template can be altered and modified as per your expectations. So, grab it now.

Security Management Dashboard With Downtime Issues And Unsolved Tickets Professional PDF
Deliver and pitch your topic in the best possible manner with this security management dashboard with downtime issues and unsolved tickets professional pdf. Use them to share invaluable insights on occurrence, malware and phishing, count and percentage and impress your audience. This template can be altered and modified as per your expectations. So, grab it now.
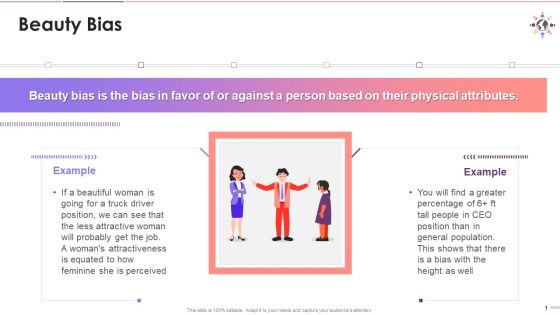
Introduction To The Concept Of Beauty Bias Training Ppt
This slide mentions the meaning of beauty bias found in the workplace along with suitable examples. Beauty bias means workplace bias that comes to the fore, based on physical attributes. This explains why we have the less attractive women bagging a truck drivers job, and disproportionate number of taller CEOs in companies, than their percentage in the population.
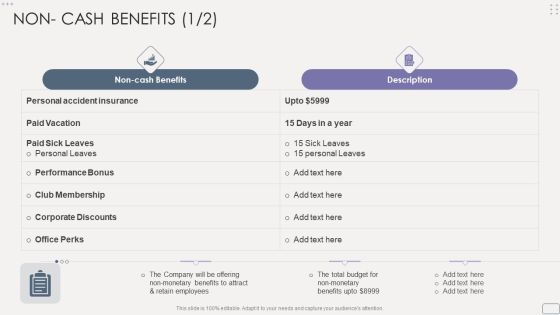
Income Assessment Report NON CASH BENEFITS Pictures PDF
Deliver an awe inspiring pitch with this creative Income Assessment Report NON CASH BENEFITS Pictures PDF bundle. Topics like Salary Comparison, Comparison By Education, Percentage Of Workers can be discussed with this completely editable template. It is available for immediate download depending on the needs and requirements of the user.

Customer Service Metrics Dashboard With Net Retention Rate Sample PDF
This slide showcases KPI dashboard for customer service that can help to compare the customer churn rate, revenue churn rate, net retention rate and MRR growth rate as compared to previous month. Its key elements are net promoter score, loyal customer rate, percentage of premium users and customer lifetime value. Pitch your topic with ease and precision using this Customer Service Metrics Dashboard With Net Retention Rate Sample PDF. This layout presents information on Loyal Customer Rate, Premium Users, Customer Lifetime Value. It is also available for immediate download and adjustment. So, changes can be made in the color, design, graphics or any other component to create a unique layout.

Current Situation And Companies Target Ppt PowerPoint Presentation File Picture PDF
This slide covers the current situation of the company along with future objectives such as eliminating collection of waste from revenues. It also covers revenue percentage for FY 18 19. Deliver an awe inspiring pitch with this creative current situation and companies target ppt powerpoint presentation file picture pdf bundle. Topics like innovative, service, traditional transfer, target, revenue percentages can be discussed with this completely editable template. It is available for immediate download depending on the needs and requirements of the user.

Current Situation And Companies Target Resources Recycling And Waste Management Rules PDF
This slide covers the current situation of the company along with future objectives such as eliminating collection of waste from revenues. It also covers revenue percentage for FY 18 19. Deliver an awe inspiring pitch with this creative current situation and companies target resources recycling and waste management rules pdf bundle. Topics like innovative, service, traditional transfer, target, revenue percentages can be discussed with this completely editable template. It is available for immediate download depending on the needs and requirements of the user.

Complete Guide For Total Employee Involvement Strategic Approach Current Status In The Company Demonstration PDF
This slide shows the current Employee Engagement Status in the company. This slide shows the percentage of Employee that are Engaged, Actively Disengaged and Not Engaged. Deliver an awe inspiring pitch with this creative Complete Guide For Total Employee Involvement Strategic Approach Current Status In The Company Demonstration PDF bundle. Topics like Employee Engagement, Percentages Employees, Actively Disengaged can be discussed with this completely editable template. It is available for immediate download depending on the needs and requirements of the user.
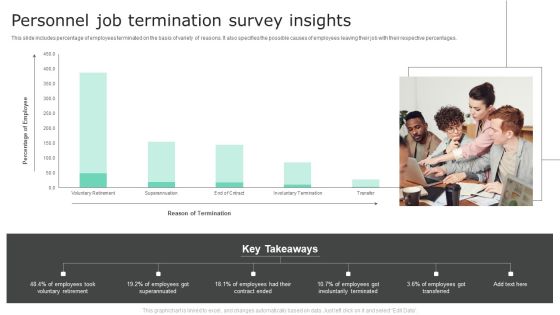
Personnel Job Termination Survey Insights Introduction PDF
This slide includes percentage of employees terminated on the basis of variety of reasons. It also specifies the possible causes of employees leaving their job with their respective percentages. Showcasing this set of slides titled Personnel Job Termination Survey Insights Introduction PDF. The topics addressed in these templates are Employees Got Superannuated, Contract Ended. All the content presented in this PPT design is completely editable. Download it and make adjustments in color, background, font etc. as per your unique business setting.
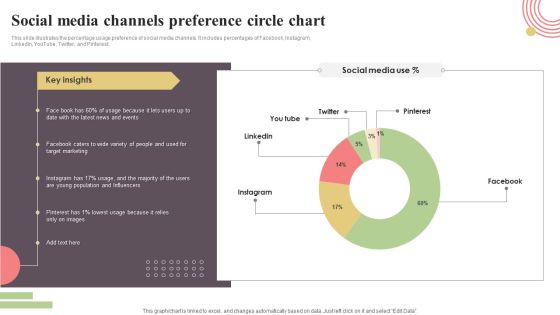
Social Media Channels Preference Circle Chart Clipart PDF
This slide illustrates the percentage usage preference of social media channels. It includes percentages of Facebook, Instagram, LinkedIn, YouTube, Twitter, and Pinterest. Showcasing this set of slides titled Social Media Channels Preference Circle Chart Clipart PDF. The topics addressed in these templates are Facebook, Instagram, Pinterest, Twitter, You Tube. All the content presented in this PPT design is completely editable. Download it and make adjustments in color, background, font etc. as per your unique business setting.

Retail Store Employee Turnover Rate And Engagement Score Analysis Retail Outlet Operations Elements PDF
This slide visually presents the information regarding the employee turnover rate and engagement score at retail store. It also list main causes behind poor scores such as dissatisfaction with pay and benefits, lack of growth opportunities etc.Deliver an awe inspiring pitch with this creative Retail Store Employee Turnover Rate And Engagement Score Analysis Retail Outlet Operations Elements PDF bundle. Topics like Employee Engagement, Identified Causes, Percentage Employees can be discussed with this completely editable template. It is available for immediate download depending on the needs and requirements of the user.
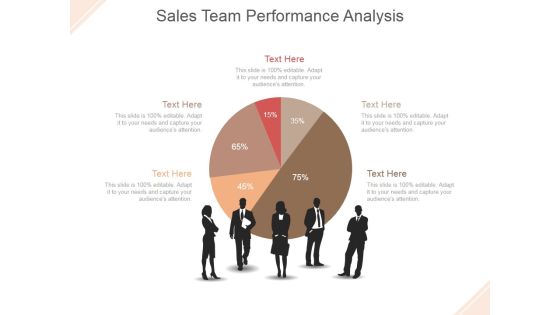
Sales Team Performance Analysis Ppt PowerPoint Presentation Inspiration
This is a sales team performance analysis ppt powerpoint presentation inspiration. This is a five stage process. The stage in this process are pie, finance, people, communication, percentage.

Bar Chart Ppt PowerPoint Presentation Microsoft
This is a bar chart ppt powerpoint presentation microsoft. This is a eleven stage process. The stages in this process are sales in percentage, fy, graph, success, business.

Area Chart Ppt PowerPoint Presentation Picture
This is a area chart ppt powerpoint presentation picture. This is a two stage process. The stages in this process are product, in percentage, graph, management, business.
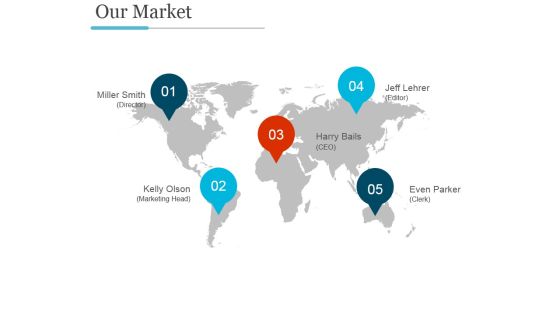
Our Market Template Ppt PowerPoint Presentation Design Templates
This is a our market template ppt powerpoint presentation design templates. This is a four stage process. The stages in this process are pie, percentage, finance, division, analysis.

Clustered Column Ppt PowerPoint Presentation Ideas Show
This is a clustered column ppt powerpoint presentation ideas show. This is a two stage process. The stages in this process are product, percentage, finance, business, bar graph.
