AI PPT Maker
Templates
PPT Bundles
Design Services
Business PPTs
Business Plan
Management
Strategy
Introduction PPT
Roadmap
Self Introduction
Timelines
Process
Marketing
Agenda
Technology
Medical
Startup Business Plan
Cyber Security
Dashboards
SWOT
Proposals
Education
Pitch Deck
Digital Marketing
KPIs
Project Management
Product Management
Artificial Intelligence
Target Market
Communication
Supply Chain
Google Slides
Research Services
 One Pagers
All Categories
-
Home
- Customer Favorites
- Percentage Growth
Percentage Growth
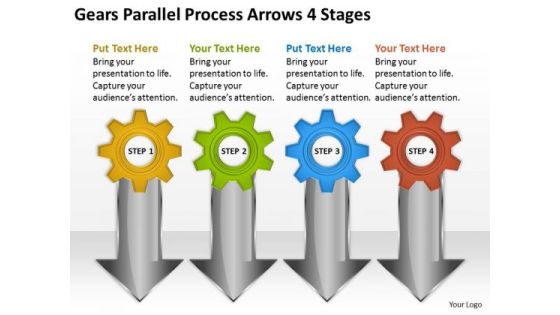
Parallel Process Arrows 4 Stages Business Plans For Small PowerPoint Slides
We present our parallel process arrows 4 stages business plans for small PowerPoint Slides.Present our Arrows PowerPoint Templates because It will Strengthen your hand with your thoughts. They have all the aces you need to win the day. Use our Shapes PowerPoint Templates because Our PowerPoint Templates and Slides will embellish your thoughts. See them provide the desired motivation to your team. Download our Gear Wheels PowerPoint Templates because Our PowerPoint Templates and Slides will Activate the energies of your audience. Get their creative juices flowing with your words. Use our Business PowerPoint Templates because Our PowerPoint Templates and Slides will generate and maintain the level of interest you desire. They will create the impression you want to imprint on your audience. Download our Success PowerPoint Templates because Our PowerPoint Templates and Slides will Embellish your thoughts. They will help you illustrate the brilliance of your ideas.Use these PowerPoint slides for presentations relating to accounting, arrow, ascending, background, bank, blue, business, charts, compare, comparison, computer, corporate, count, descending, fame, famous, finance, generated, gradient, grow, growth, illustration, income, international, linear, money, papers, parallel, percentage, point, record, scale, shares, signs, stock, success, symbols, tax, tip, vary, white, world. The prominent colors used in the PowerPoint template are Yellow, Green, Gray.

3 Stages Parallel Organizational Charts Business Plan Downloads PowerPoint Slides
We present our 3 stages parallel organizational charts business plan downloads PowerPoint Slides.Use our Arrows PowerPoint Templates because Our PowerPoint Templates and Slides will provide you a launch platform. Give a lift off to your ideas and send them into orbit. Download our Shapes PowerPoint Templates because Our PowerPoint Templates and Slides will Embellish your thoughts. They will help you illustrate the brilliance of your ideas. Download our Gear Wheels PowerPoint Templates because Our PowerPoint Templates and Slides will provide weight to your words. They will bring out the depth of your thought process. Present our Business PowerPoint Templates because you can Set pulses racing with our PowerPoint Templates and Slides. They will raise the expectations of your team. Download our Success PowerPoint Templates because They will Put the wind in your sails. Skim smoothly over the choppy waters of the market.Use these PowerPoint slides for presentations relating to accounting, arrow, ascending, background, bank, blue, business, charts, compare, comparison, computer, corporate, count, descending, fame, famous, finance, generated, gradient, grow, growth, illustration, income, international, linear, money, papers, parallel, percentage, point, record, scale, shares, signs, stock, success, symbols, tax, tip, vary, white, world. The prominent colors used in the PowerPoint template are Yellow, Blue, Green.
Scatter Chart Ppt PowerPoint Presentation Icon Mockup
This is a scatter chart ppt powerpoint presentation icon mockup. This is a nine stage process. The stages in this process are product, in percentage, dollars, percentage, finance.

Scatter Chart Ppt PowerPoint Presentation Gallery Vector
This is a scatter chart ppt powerpoint presentation gallery vector. This is a nine stage process. The stages in this process are in percentage, dollars, product, percentage, finance.
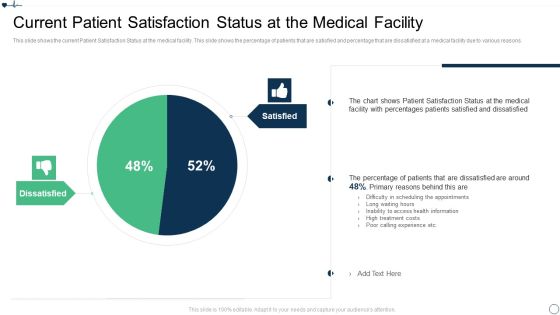
Patient Retention Approaches For Improving Brand Loyalty Current Patient Satisfaction Status Graphics PDF
This slide shows the current Patient Satisfaction Status at the medical facility. This slide shows the percentage of patients that are satisfied and percentage that are dissatisfied at a medical facility due to various reasons.Deliver and pitch your topic in the best possible manner with this patient retention approaches for improving brand loyalty current patient satisfaction status graphics pdf Use them to share invaluable insights on percentages patients, patient satisfaction status, dissatisfied are around and impress your audience. This template can be altered and modified as per your expectations. So, grab it now.

Consumer Retention Techniques Current Patient Satisfaction Status At The Medical Facility Introduction PDF
This slide shows the current Patient Satisfaction Status at the medical facility. This slide shows the percentage of patients that are satisfied and percentage that are dissatisfied at a medical facility due to various reasons. Deliver an awe inspiring pitch with this creative consumer retention techniques current patient satisfaction status at the medical facility introduction pdf bundle. Topics like percentages patients satisfied, medical facility, high treatment costs, poor calling experience can be discussed with this completely editable template. It is available for immediate download depending on the needs and requirements of the user.
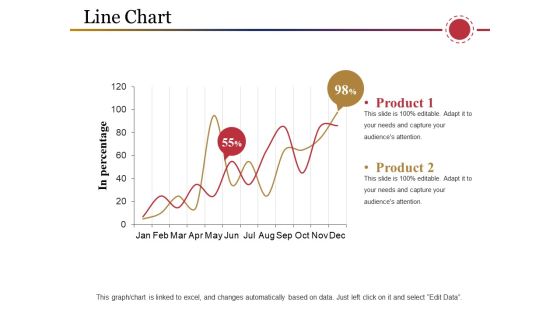
Line Chart Ppt PowerPoint Presentation Inspiration Samples
This is a line chart ppt powerpoint presentation inspiration samples. This is a two stage process. The stages in this process are product, in percentage, business, marketing, graph.

Impact Effort Task Prioritization Matrix Ppt PowerPoint Presentation Infographics Show
This is a impact effort task prioritization matrix ppt powerpoint presentation infographics show. The topics discussed in this diagram are priority matrix, responsibility matrix, action matrix. This is a completely editable PowerPoint presentation, and is available for immediate download.

Project Planning Task Assignment Matrix Ppt PowerPoint Presentation Ideas Brochure
This is a project planning task assignment matrix ppt powerpoint presentation ideas brochure. The topics discussed in this diagram are priority matrix, responsibility matrix, action matrix. This is a completely editable PowerPoint presentation, and is available for immediate download.
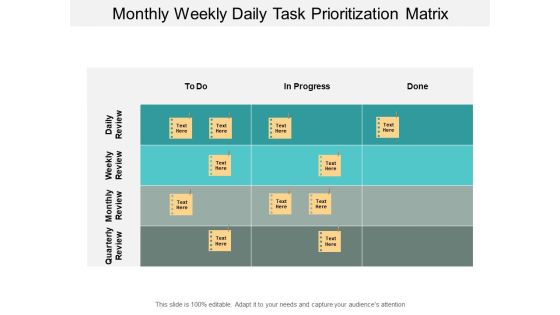
Monthly Weekly Daily Task Prioritization Matrix Ppt PowerPoint Presentation Model Guide
This is a monthly weekly daily task prioritization matrix ppt powerpoint presentation model guide. The topics discussed in this diagram are priority matrix, responsibility matrix, action matrix. This is a completely editable PowerPoint presentation, and is available for immediate download.

Action Plan Template With Task Priority And Status Ppt PowerPoint Presentation Slides Samples
This is a action plan template with task priority and status ppt powerpoint presentation slides samples. The topics discussed in this diagram are priority matrix, responsibility matrix, action matrix. This is a completely editable PowerPoint presentation, and is available for immediate download.

Area Chart Ppt PowerPoint Presentation Summary Example Introduction
This is a area chart ppt powerpoint presentation summary example introduction. This is a two stage process. The stages in this process are product, sales in percentage, percentage, area chart, business.

5 Stages Life Cycle Assesment Business Plan PowerPoint Slides
We present our 5 stages life cycle assesment business plan PowerPoint Slides.Download and present our Circle Charts PowerPoint Templates because Our PowerPoint Templates and Slides are designed to help you succeed. They have all the ingredients you need. Present our Business PowerPoint Templates because Our PowerPoint Templates and Slides will definately Enhance the stature of your presentation. Adorn the beauty of your thoughts with their colourful backgrounds. Download and present our Marketing PowerPoint Templates because You can Bask in the warmth of our PowerPoint Templates and Slides. Enjoy the heartfelt glowing response of your listeners. Download our Shapes PowerPoint Templates because Our PowerPoint Templates and Slides will give good value for money. They also have respect for the value of your time. Use our Process and Flows PowerPoint Templates because Our PowerPoint Templates and Slides has conjured up a web of all you need with the help of our great team. Use them to string together your glistening ideas.Use these PowerPoint slides for presentations relating to Graphic, business, data, profit, market, statistics, sales, slice, economy, display, corporate, concept, render, success,presentation, percentage, finance, bank, report, marketing, accounting, management, illustration, piece, strategy, money, growth, company, competition, progress,account, part, information, investment, improvement, banking,financial, reflect, results, performance, exchange. The prominent colors used in the PowerPoint template are Purple, Gray, Black.

5 Stages Life Cycle Assesment Business Plans Template PowerPoint Templates
We present our 5 stages life cycle assesment business plans template PowerPoint templates.Download and present our Process and Flows PowerPoint Templates because Our PowerPoint Templates and Slides will bullet point your ideas. See them fall into place one by one. Download our Marketing PowerPoint Templates because you can Break through with our PowerPoint Templates and Slides. Bring down the mental barriers of your audience. Present our Circle Charts PowerPoint Templates because It is Aesthetically crafted by artistic young minds. Our PowerPoint Templates and Slides are designed to display your dexterity. Present our Business PowerPoint Templates because Our PowerPoint Templates and Slides have the Brilliant backdrops. Guaranteed to illuminate the minds of your audience. Download our Marketing PowerPoint Templates because Our PowerPoint Templates and Slides will let your words and thoughts hit bullseye everytime.Use these PowerPoint slides for presentations relating to Graphic, business, data, profit, market, statistics, sales, slice, economy, display, corporate, concept, render, success,presentation, percentage, finance, bank, report, marketing, accounting, management, illustration, piece, strategy, money, growth, company, competition, progress,account, part, information, investment, improvement, banking,financial, reflect, results, performance, exchange. The prominent colors used in the PowerPoint template are Red, White, Gray.

9 Stages Hub And Spoke Comparison Diagram How Business Plan PowerPoint Templates
We present our 9 stages hub and spoke comparison diagram how business plan PowerPoint templates.Use our Process and Flows PowerPoint Templates because Our PowerPoint Templates and Slides will let Your superior ideas hit the target always and everytime. Download our Arrows PowerPoint Templates because Our PowerPoint Templates and Slides are a sure bet. Gauranteed to win against all odds. Download our Business PowerPoint Templates because Our PowerPoint Templates and Slides have the Brilliant backdrops. Guaranteed to illuminate the minds of your audience. Use our Circle Charts PowerPoint Templates because Our PowerPoint Templates and Slides will let you meet your Deadlines. Download our Flow Charts PowerPoint Templates because Our PowerPoint Templates and Slides will effectively help you save your valuable time. They are readymade to fit into any presentation structure. Use these PowerPoint slides for presentations relating to Pie, chart, graph, market, isolated, statistics, sales, economy, display, white, corporate, business, income, concept, arrow, success, presentation, nine,diagram, percentage, graphic, finance, data, report, marketing, accounting, management, result, piece, strategy, growth, company, competition, progress, account,profit, part, information, investment, improvement, index, financial, reflect, performance. The prominent colors used in the PowerPoint template are Black, Green, Blue.

5 Stages Life Cycle Assesment Small Business Plan Samples PowerPoint Slides
We present our 5 stages life cycle assesment small business plan samples PowerPoint Slides.Download our Circle Charts PowerPoint Templates because Our PowerPoint Templates and Slides are conceived by a dedicated team. Use them and give form to your wondrous ideas. Use our Process and Flows PowerPoint Templates because Our PowerPoint Templates and Slides will let your words and thoughts hit bullseye everytime. Present our Business PowerPoint Templates because You can Connect the dots. Fan expectations as the whole picture emerges. Download our Marketing PowerPoint Templates because Our PowerPoint Templates and Slides offer you the widest possible range of options. Download our Shapes PowerPoint Templates because Our PowerPoint Templates and Slides will let your words and thoughts hit bullseye everytime.Use these PowerPoint slides for presentations relating to Graphic, business, data, profit, market, statistics, sales, slice, economy, display, corporate, concept, render, success,presentation, percentage, finance, bank, report, marketing, accounting, management, illustration, piece, strategy, money, growth, company, competition, progress,account, part, information, investment, improvement, banking,financial, reflect, results, performance, exchange. The prominent colors used in the PowerPoint template are Green, White, Gray.

Column Chart Ppt PowerPoint Presentation Layouts Design Inspiration
This is a column chart ppt powerpoint presentation layouts design inspiration. This is a two stage process. The stages in this process are sales in percentage, financial year in, graph, business, finance, marketing.

Providing Electronic Financial Services To Existing Consumers Mobile Subscribers Projection Demonstration PDF
Mentioned slide shows informational stats about mobile subscribers and tele density growth for five years. The graph depicts that Total mobile subscription for MFS will get increased by 84 percentage in 2026. Deliver an awe inspiring pitch with this creative Providing Electronic Financial Services To Existing Consumers Mobile Subscribers Projection Demonstration PDF bundle. Topics like Mobile Subscribers Projection And Tele Density Growth can be discussed with this completely editable template. It is available for immediate download depending on the needs and requirements of the user.
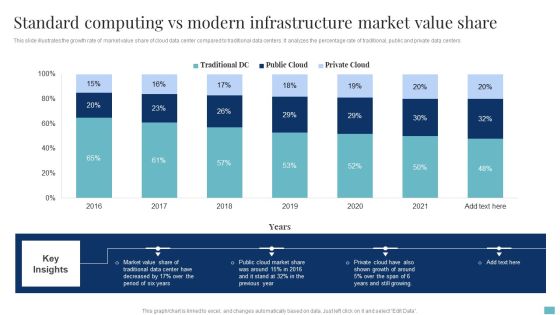
Standard Computing Vs Modern Infrastructure Market Value Share Brochure PDF
This slide illustrates the growth rate of market value share of cloud data center compared to traditional data centers. It analyzes the percentage rate of traditional, public and private data centers. Pitch your topic with ease and precision using this Standard Computing Vs Modern Infrastructure Market Value Share Brochure PDF. This layout presents information on Cloud Market Share, Market Value Share, Growth. It is also available for immediate download and adjustment. So, changes can be made in the color, design, graphics or any other component to create a unique layout.
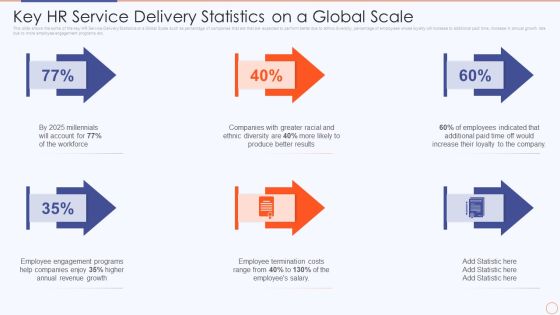
Streamlining HR Service Delivery To Ensure Organizational Transformation Key Hr Service Delivery Statistics Professional PDF
This slide shows the some of the key HR Service Delivery Statistics on a Global Scale such as percentage of companies that are that are expected to perform better due to ethnic diversity, percentage of employees whose loyalty will increase to additional paid time, increase in annual growth rate due to more employee engagement programs etc. This is a streamlining hr service delivery to ensure organizational transformation key hr service delivery statistics professional pdf template with various stages. Focus and dispense information on six stages using this creative set, that comes with editable features. It contains large content boxes to add your information on topics like key hr service delivery statistics on a global scale. You can also showcase facts, figures, and other relevant content using this PPT layout. Grab it now.

Key HR Service Delivery Statistics On A Global Scale Ppt Summary File Formats PDF
This slide shows the some of the key HR Service Delivery Statistics on a Global Scale such as percentage of companies that are that are expected to perform better due to ethnic diversity, percentage of employees whose loyalty will increase to additional paid time, increase in annual growth rate due to more employee engagement programs etc. Presenting key hr service delivery statistics on a global scale ppt summary file formats pdf to provide visual cues and insights. Share and navigate important information on one stages that need your due attention. This template can be used to pitch topics like key hr service delivery statistics on a global scale. In addtion, this PPT design contains high resolution images, graphics, etc, that are easily editable and available for immediate download.

Key HR Service Delivery Statistics On A Global Scale Ppt PowerPoint Presentation File Professional PDF
This slide shows the some of the key HR service delivery statistics on a global scale such as percentage of companies that are that are expected to perform better due to ethnic diversity, percentage of employees whose loyalty will increase to additional paid time, increase in annual growth rate due to more employee engagement programs etc. Welcome to our selection of the Key HR Service Delivery Statistics On A Global Scale Ppt PowerPoint Presentation File Professional PDF. These are designed to help you showcase your creativity and bring your sphere to life. Planning and Innovation are essential for any business that is just starting out. This collection contains the designs that you need for your everyday presentations. All of our PowerPoints are 100 percent editable, so you can customize them to suit your needs. This multi purpose template can be used in various situations. Grab these presentation templates today.

Change Management Experience Ppt PowerPoint Presentation Styles Professional
This is a change management experience ppt powerpoint presentation styles professional. This is a four stage process. The stages in this process are business, marketing, management, percentage.
Line Chart Ppt PowerPoint Presentation Icon Inspiration
This is a line chart ppt powerpoint presentation icon inspiration. This is a two stage process. The stages in this process are product, financial years, sales in percentage.

Area Chart Ppt PowerPoint Presentation Icon Gallery
This is a area chart ppt powerpoint presentation icon gallery. This is a two stage process. The stages in this process are sales in percentage, product, bar graph.

Bubble Chart Ppt PowerPoint Presentation Layouts Demonstration
This is a bubble chart ppt powerpoint presentation icon structure. This is a three stage process. The stages in this process are product, sales in percentage, bubble chart.

Area Chart Ppt PowerPoint Presentation Summary Deck
This is a area chart ppt powerpoint presentation summary deck. This is a two stage process. The stages in this process are sales in percentage, financial year.

Column Chart Ppt PowerPoint Presentation Professional Aids
This is a column chart ppt powerpoint presentation professional aids. This is a two stage process. The stages in this process are product, sales in percentage, financial years.

Line Chart Ppt PowerPoint Presentation Pictures Layout
This is a line chart ppt powerpoint presentation pictures layout. This is a two stage process. The stages in this process are product, financial years, sales in percentage.

Column Chart Ppt PowerPoint Presentation Gallery Layout
This is a column chart ppt powerpoint presentation gallery layout. This is a two stage process. The stages in this process are product, sales in percentage, year.
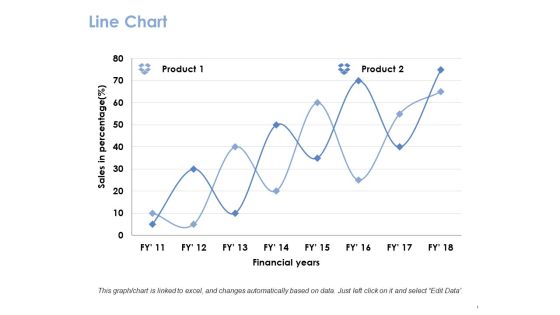
Line Chart Ppt PowerPoint Presentation Gallery Guide
This is a line chart ppt powerpoint presentation gallery guide. This is a two stage process. The stages in this process are product, financial years, sales in percentage.

Bar Graph Ppt PowerPoint Presentation Ideas Display
This is a bar graph ppt powerpoint presentation ideas display. This is a two stage process. The stages in this process are product, sales in percentage, bar graph.

Area Graph Ppt PowerPoint Presentation Slides Ideas
This is a area graph ppt powerpoint presentation slides ideas. This is a two stage process. The stages in this process are sales in percentage, financial year, product.

Area Chart Ppt PowerPoint Presentation Styles Professional
This is a area chart ppt powerpoint presentation styles professional. This is a two stage process. The stages in this process are sales in percentage, product, area chart.
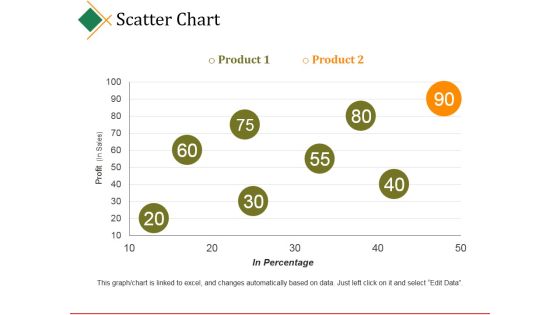
Scatter Chart Ppt PowerPoint Presentation Model
This is a scatter chart ppt powerpoint presentation model. This is a two stage process. The stages in this process are business, product, profit, in percentage, business.

Overall Revenue Analysis Bar Chart Powerpoint Slide Information
This is a overall revenue analysis bar chart powerpoint slide information. This is a nine stage process. The stages in this process are finance, success, business, marketing, percentage.
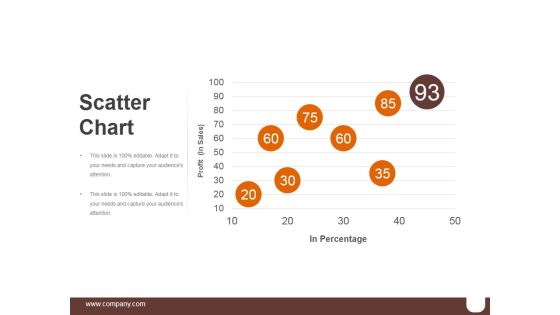
Scatter Chart Ppt PowerPoint Presentation Graphics
This is a scatter chart ppt powerpoint presentation graphics. This is a five stage process. The stages in this process are business, marketing, percentage, success, finance.

Clustered Bar Ppt PowerPoint Presentation Inspiration
This is a clustered bar ppt powerpoint presentation inspiration. This is a five stage process. The stages in this process are bar graph, business, marketing, finance, percentage.

Clustered Column Ppt PowerPoint Presentation Infographic Template
This is a clustered column ppt powerpoint presentation infographic template. This is a two stage process. The stages in this process are finance, percentage, bar graph, business, marketing.
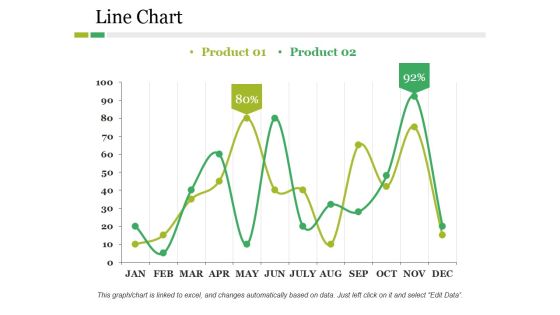
Line Chart Ppt PowerPoint Presentation Pictures Structure
This is a line chart ppt powerpoint presentation pictures structure. This is a two stage process. The stages in this process are product, business, line chart, finance, percentage.

Clustered Column Line Ppt PowerPoint Presentation Layout
This is a clustered column line ppt powerpoint presentation layout. This is a three stage process. The stages in this process are percentage, product, business, management.
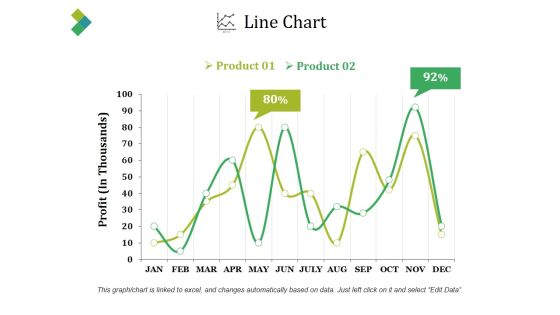
Line Chart Ppt PowerPoint Presentation Slides
This is a line chart ppt powerpoint presentation slides. This is a two stage process. The stages in this process are product, profit, percentage, finance, line chart.
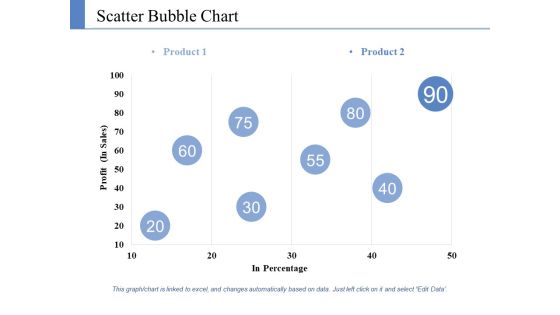
Scatter Bubble Chart Ppt PowerPoint Presentation Styles Information
This is a scatter bubble chart ppt powerpoint presentation styles information. This is a two stage process. The stages in this process are product, profit, in percentage.

Line Chart Ppt PowerPoint Presentation Layouts Templates
This is a line chart ppt powerpoint presentation layouts templates. This is a two stage process. The stages in this process are product, in percentage, in years.

Area Chart Ppt PowerPoint Presentation Layouts Gridlines
This is a area chart ppt powerpoint presentation layouts gridlines. This is a two stage process. The stages in this process are area chart, product, percentage, analysis, capture.

Combo Chart Ppt PowerPoint Presentation Styles Format Ideas
This is a combo chart ppt powerpoint presentation styles format ideas. This is a three stage process. The stages in this process are percentage, product, marketing.

Comparison Ppt PowerPoint Presentation Show
This is a comparison ppt powerpoint presentation show. This is a five stage process. The stages in this process are compare, percentage, finance, people, ratio.

Dashboard Ppt PowerPoint Presentation Rules
This is a dashboard ppt powerpoint presentation rules. This is a three stage process. The stages in this process are dashboard, measurement, percentage, analysis, business.
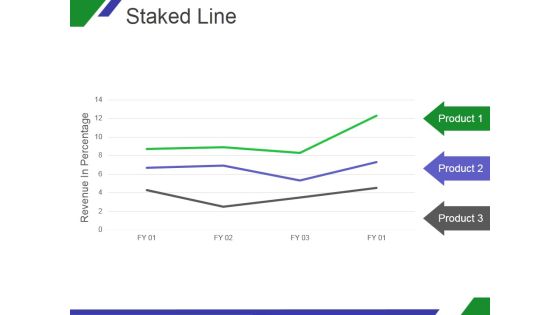
Staked Line Ppt PowerPoint Presentation Slide
This is a staked line ppt powerpoint presentation slide. This is a three stage process. The stages in this process are revenue in percentage, product, business.

Line Chart Ppt PowerPoint Presentation Model
This is a line chart ppt powerpoint presentation model. This is a two stage process. The stages in this process are in percentage, product, business.

Stacked Line Ppt PowerPoint Presentation Guide
This is a stacked line ppt powerpoint presentation guide. This is a three stage process. The stages in this process are revenue in percentage, product.

Line Chart Ppt PowerPoint Presentation Ideas
This is a line chart ppt powerpoint presentation ideas. This is a two stage process. The stages in this process are marketing, in percentage, sun, mon, tue, wed.

Scatter Chart Ppt PowerPoint Presentation Outline
This is a scatter chart ppt powerpoint presentation outline. This is a five stage process. The stages in this process are business, marketing, graph, percentage, finance.

Key Evaluation Metrics Ppt PowerPoint Presentation Influencers
This is a key evaluation metrics ppt powerpoint presentation influencers. This is a five stage process. The stages in this process are icons, percentage, marketing, management.
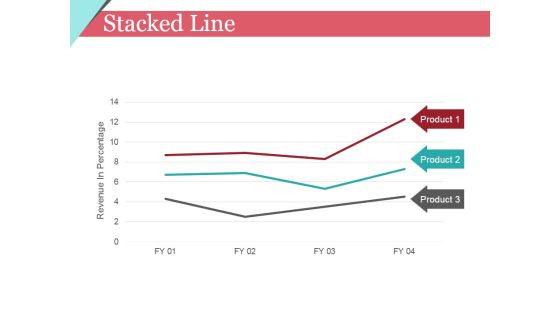
Stacked Line Ppt PowerPoint Presentation Gallery Display
This is a stacked line ppt powerpoint presentation gallery display. This is a three stage process. The stages in this process are revenue in percentage, product, graph, finance.
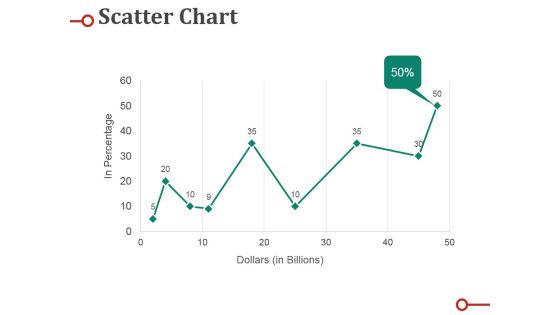
Scatter Chart Ppt PowerPoint Presentation Professional Deck
This is a scatter chart ppt powerpoint presentation professional deck. This is a nine stage process. The stages in this process are percentage, business, marketing, graph, line.

Stacked Column Ppt PowerPoint Presentation Model Good
This is a stacked column ppt powerpoint presentation model good. This is a nine stage process. The stages in this process are finance, percentage, business, product.

Bar Graph Ppt PowerPoint Presentation Layouts Gridlines
This is a bar graph ppt powerpoint presentation layouts gridlines. this is a three stage process. The stages in this process are product, percentage, business, marketing, management.

Area Chart Ppt PowerPoint Presentation Inspiration Slides
This is a area chart ppt powerpoint presentation inspiration slides. This is a two stage process. The stages in this process are area chart, product, in percentage.

Clustered Column Ppt PowerPoint Presentation Outline Slide Portrait
This is a clustered column ppt powerpoint presentation outline slide portrait. This is a two stage process. The stages in this process are product, finance, business, marketing, percentage.

Comparison Ppt PowerPoint Presentation Gallery Outfit
This is a comparison ppt powerpoint presentation gallery outfit. This is a two stage process. The stages in this process are comparison, finance, business, percentage, marketing.

Financial Ppt PowerPoint Presentation Gallery Templates
This is a financial ppt powerpoint presentation gallery templates. This is a three stage process. The stages in this process are circular, percentage, strategy, business, finance.
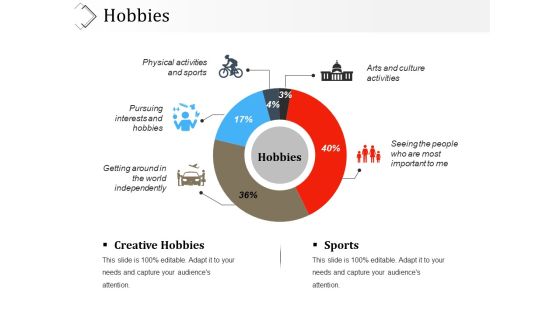
Hobbies Ppt PowerPoint Presentation Visual Aids Styles
This is a hobbies ppt powerpoint presentation visual aids styles. This is a five stage process. The stages in this process are icons, business, percentage, process, marketing.
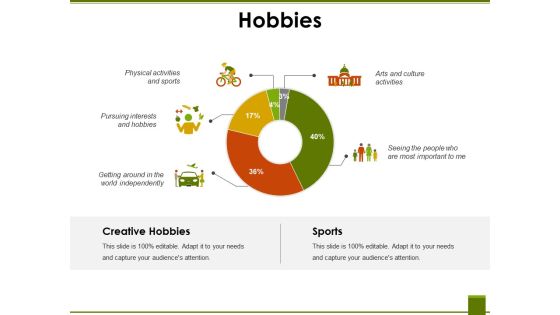
Hobbies Ppt PowerPoint Presentation Show Templates
This is a hobbies ppt powerpoint presentation show templates. This is a five stage process. The stages in this process are creative hobbies, sports, icons, business, percentage.
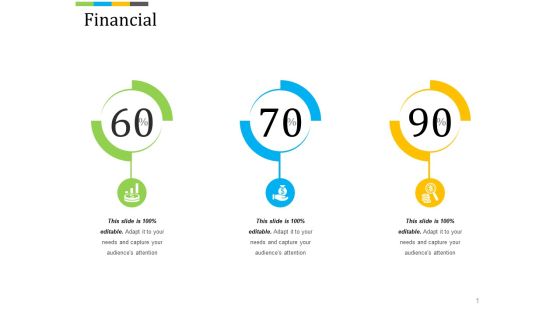
Financial Ppt PowerPoint Presentation Show Graphics Pictures
This is a financial ppt powerpoint presentation show graphics pictures. This is a three stage process. The stages in this process are business, finance, percentage, icons.
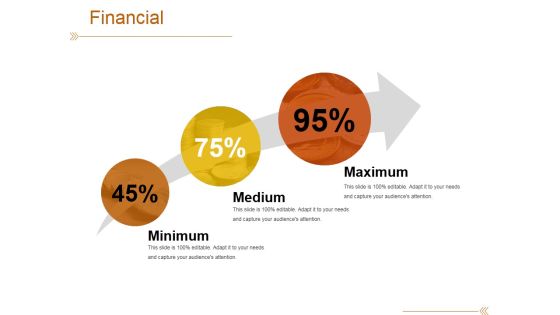
Financial Ppt PowerPoint Presentation Model Graphics Template
This is a financial ppt powerpoint presentation model graphics template. This is a three stage process. The stages in this process are minimum, medium, maximum, percentage, arrow.
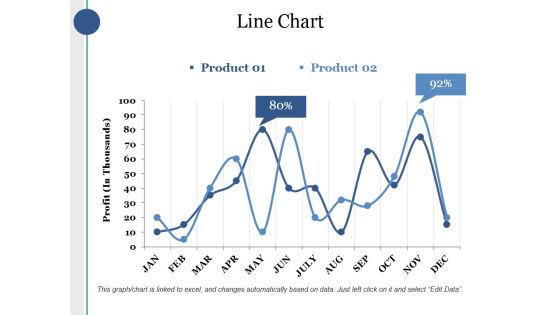
Line Chart Ppt PowerPoint Presentation Layouts Sample
This is a line chart ppt powerpoint presentation layouts sample. This is a two stage process. The stages in this process are product, profit, percentage, finance, business.

Comparison Ppt PowerPoint Presentation Ideas Guidelines
This is a comparison ppt powerpoint presentation ideas guidelines. This is a four stage process. The stages in this process are compare, percentage, finance, business, marketing.

Donut Pie Chart Ppt PowerPoint Presentation Show Outline
This is a donut pie chart ppt powerpoint presentation show outline. This is a six stage process. The stages in this process are business, marketing, percentage, chart, process.

Scatter Chart Ppt PowerPoint Presentation Show Sample
This is a scatter chart ppt powerpoint presentation show sample. This is a one stage process. The stages in this process are product, dollar, in percentage.

Area Chart Ppt PowerPoint Presentation Styles Brochure
This is a area chart ppt powerpoint presentation styles brochure. This is a two stage process. The stages in this process are product, financial years, in percentage.

Scatter Bubble Chart Ppt PowerPoint Presentation Summary Slides
This is a scatter bubble chart ppt powerpoint presentation summary slides. This is a one stage process. The stages in this process are product, profit, in percentage.

Bubble Chart Ppt PowerPoint Presentation Outline Demonstration
This is a bubble chart ppt powerpoint presentation outline demonstration. This is a two stage process. The stages in this process are bubble chart, product, in percentage.

Area Chart Ppt PowerPoint Presentation Show Graphics
This is a area chart ppt powerpoint presentation show graphics. This is a three stage process. The stages in this process are percentage, product, marketing, management, business.

Combo Chart Ppt PowerPoint Presentation Slides Slideshow
This is a combo chart ppt powerpoint presentation slides slideshow. This is a three stage process. The stages in this process are percentage, product, marketing, management, business.

Column Chart Ppt PowerPoint Presentation Show Objects
This is a column chart ppt powerpoint presentation show objects. This is a two stage process. The stages in this process are percentage, product, business, management, marketing.

Column Chart Ppt PowerPoint Presentation Model Slideshow
This is a column chart ppt powerpoint presentation model slideshow. This is a two stage process. The stages in this process are percentage, product, business, marketing.

Combo Chart Ppt PowerPoint Presentation Styles Topics
This is a combo chart ppt powerpoint presentation styles topics. This is a three stage process. The stages in this process are percentage, product, business, management, marketing.

Clustered Column Product Ppt PowerPoint Presentation Show Guidelines
This is a clustered column product ppt powerpoint presentation show guidelines. This is a four stage process. The stages in this process are business, management, marketing, percentage, product.

Column Chart Financial Ppt PowerPoint Presentation Information
This is a column chart financial ppt powerpoint presentation information. This is a three stage process. The stages in this process are business, management, marketing, percentage, product.

Column Chart Marketing Ppt PowerPoint Presentation Summary Images
This is a column chart marketing ppt powerpoint presentation summary images. This is a three stage process. The stages in this process are business, management, marketing, product, percentage.

Column Chart Ppt PowerPoint Presentation Slides Clipart
This is a column chart ppt powerpoint presentation slides clipart. This is a two stage process. The stages in this process are business, management, marketing, percentage, product.

Staff Oriented Goals To Improve Quality Introduction PDF
This slide shows the employee goals and objectives to improve the work quality and meeting the targets on time. It also includes the responsibilities of employees and the goal percentage. Pitch your topic with ease and precision using this Staff Oriented Goals To Improve Quality Introduction PDF. This layout presents information on Responsibilities, Objectives, Goal Percentage . It is also available for immediate download and adjustment. So, changes can be made in the color, design, graphics or any other component to create a unique layout.
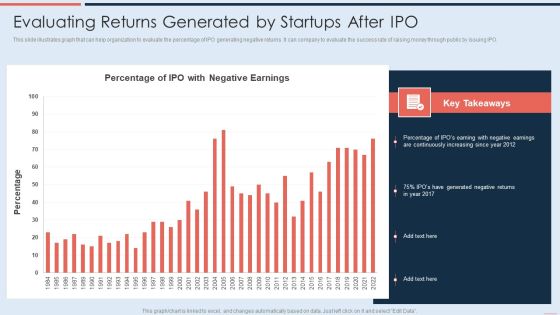
Evaluating Returns Generated By Startups After IPO Brochure PDF
This slide illustrates graph that can help organization to evaluate the percentage of IPO generating negative returns. It can company to evaluate the success rate of raising money through public by issuing IPO. Deliver and pitch your topic in the best possible manner with this Evaluating Returns Generated By Startups After IPO Brochure PDF. Use them to share invaluable insights on Percentage, Continuously Increasing, Generated Negative Returns and impress your audience. This template can be altered and modified as per your expectations. So, grab it now.

Sample To Create Best Personnel Experience Strategy Develop The Employee Experience Hypothesis Themes PDF
Have a hypothesis that you can test. For instance, introducing gamification during training will lead to 60 percentage increase in training attendance and 80 percentage completion success rate. This is a Sample To Create Best Personnel Experience Strategy Develop The Employee Experience Hypothesis Themes PDF template with various stages. Focus and dispense information on four stages using this creative set, that comes with editable features. It contains large content boxes to add your information on topics like Measurable Outcome, Customer. You can also showcase facts, figures, and other relevant content using this PPT layout. Grab it now.

Key Metrics To Measure Effectiveness Of Data Loss Prevention Strategies Elements PDF
Following slide illustrates various metrics which can be used to evaluate the success rate of data loss prevention strategies. The key metrics could be Data classification success rate percentage of policy exceptions percentage of false positives etc. Pitch your topic with ease and precision using this Key Metrics To Measure Effectiveness Of Data Loss Prevention Strategies Elements PDF. This layout presents information on Data Classification Success Rate, Key Metrics, Source. It is also available for immediate download and adjustment. So, changes can be made in the color, design, graphics or any other component to create a unique layout.
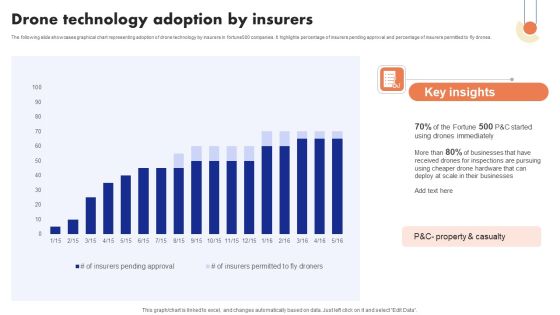
Implementation Of Digital Advancement Techniques Drone Technology Adoption Ideas PDF
The following slide showcases graphical chart representing adoption of drone technology by insurers in fortune500 companies. It highlights percentage of insurers pending approval and percentage of insurers permitted to fly drones. Slidegeeks is one of the best resources for PowerPoint templates. You can download easily and regulate Implementation Of Digital Advancement Techniques Drone Technology Adoption Ideas PDF for your personal presentations from our wonderful collection. A few clicks is all it takes to discover and get the most relevant and appropriate templates. Use our Templates to add a unique zing and appeal to your presentation and meetings. All the slides are easy to edit and you can use them even for advertisement purposes.
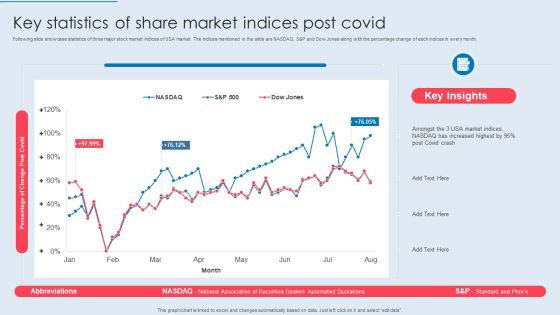
Key Statistics Of Share Market Indices Post Covid Sample PDF
Following slide showcase statistics of three major stock market indices of USA market. The indices mentioned in the slide are NASDAQ, S and P and Dow Jones along with the percentage change of each indices in every month. Showcasing this set of slides titled Key Statistics Of Share Market Indices Post Covid Sample PDF. The topics addressed in these templates are Percentage Change Post Covid, Increased Highest, Indices Post Covid. All the content presented in this PPT design is completely editable. Download it and make adjustments in color, background, font etc. as per your unique business setting.
Patient Retention Approaches For Improving Brand Loyalty Statistics On A Global Scale Guidelines PDF
This slide shows the some of the general Patient Satisfaction Statistics on a Global Scale such as percentage of patients that value customer service, patients not willing to hold call, percentage of patients who want appointment reminder etc. Presenting patient retention approaches for improving brand loyalty statistics on a global scale guidelines pdf to provide visual cues and insights. Share and navigate important information on six stages that need your due attention. This template can be used to pitch topics like appointment reminder, healthcare institution, dissatisfaction level In addtion, this PPT design contains high resolution images, graphics, etc, that are easily editable and available for immediate download.

Patient Retention Approaches For Improving Brand Loyalty Future Estimated Patient Information PDF
This slide shows the future Patient Satisfaction Status at the medical facility. This slide shows the percentage of patients that are satisfied and percentage that are dissatisfied at a medical facility after implementing patient satisfaction strategies Deliver and pitch your topic in the best possible manner with this patient retention approaches for improving brand loyalty future estimated patient information pdf Use them to share invaluable insights on processes personalizing, experience simplifying, patient satisfaction and impress your audience. This template can be altered and modified as per your expectations. So, grab it now.

Online Business Client Experience Improvement Strategy Playbook Deploy Potential Attention Grabbing Offers For Users Icons PDF
This slide provides information regarding deployment of potential attention grabbing offers for users in terms of percentage off, buy one get one, customized promo codes, in stock availability and quick and free shipping. This is a Online Business Client Experience Improvement Strategy Playbook Deploy Potential Attention Grabbing Offers For Users Icons PDF template with various stages. Focus and dispense information on five stages using this creative set, that comes with editable features. It contains large content boxes to add your information on topics like Percentage Off, Customized Promo Codes, Quick And Free Shipping. You can also showcase facts, figures, and other relevant content using this PPT layout. Grab it now.
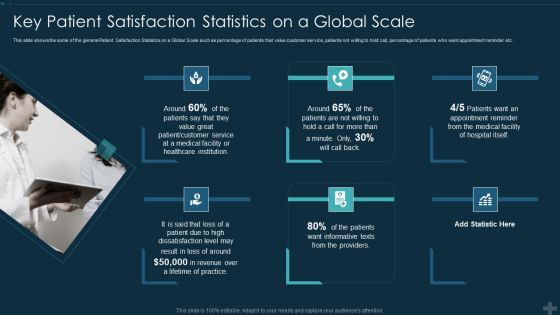
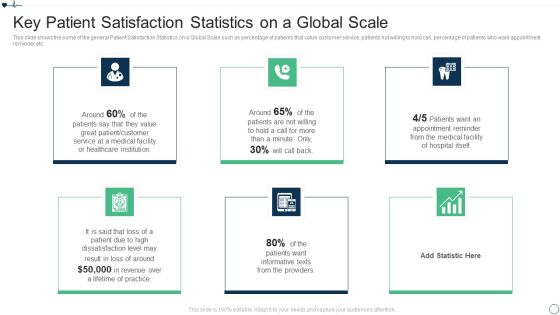
Application Patient Satisfaction Tactics Enhance Clinical Results Key Patient Satisfaction Statistics Elements PDF
This slide shows the some of the general Patient Satisfaction Statistics on a Global Scale such as percentage of patients that value customer service, patients not willing to hold call, percentage of patients who want appointment reminder etc. This is a application patient satisfaction tactics enhance clinical results key patient satisfaction statistics elements pdf template with various stages. Focus and dispense information on six stages using this creative set, that comes with editable features. It contains large content boxes to add your information on topics like medical facility, customer service, healthcare, revenue. You can also showcase facts, figures, and other relevant content using this PPT layout. Grab it now.

Addressing Key Concerns Faced By Sales Team In Managing B2B Buyer Inspiration PDF
This slide provides information regarding key concerns face by sales team in managing B2B buyer in terms of buyer getting disconnected with sales team, sales representatives unable to add value to purchase processes, rise in sales enablement spending.Deliver an awe inspiring pitch with this creative addressing key concerns faced by sales team in managing b2b buyer inspiration pdf bundle. Topics like percentage of buyers disconnected, percentage of sales representatives, sales enablement spending can be discussed with this completely editable template. It is available for immediate download depending on the needs and requirements of the user.

Addressing Key Concerns Faced By Sales Team In Managing B2B Buyer Designs PDF
This slide provides information regarding key concerns face by sales team in managing B2B buyer in terms of buyer getting disconnected with sales team, sales representatives unable to add value to purchase processes, rise in sales enablement spending. Deliver an awe inspiring pitch with this creative Addressing Key Concerns Faced By Sales Team In Managing B2B Buyer Designs PDF bundle. Topics like Percentage Of Buyers Disconnected, Percentage Of Sales Representatives, Enablement Spending can be discussed with this completely editable template. It is available for immediate download depending on the needs and requirements of the user.

Application Patient Satisfaction Tactics Enhance Clinical Results Current Patient Satisfaction Status Diagrams PDF
This slide shows the current Patient Satisfaction Status at the medical facility. This slide shows the percentage of patients that are satisfied and percentage that are dissatisfied at a medical facility due to various reasons. Deliver an awe inspiring pitch with this creative application patient satisfaction tactics enhance clinical results current patient satisfaction status diagrams pdf bundle. Topics like current patient satisfaction status at the medical facility can be discussed with this completely editable template. It is available for immediate download depending on the needs and requirements of the user.

Application Patient Satisfaction Tactics Enhance Clinical Results Future Estimated Patient Satisfaction Status Brochure PDF
This slide shows the future Patient Satisfaction Status at the medical facility. This slide shows the percentage of patients that are satisfied and percentage that are dissatisfied at a medical facility after implementing patient satisfaction strategies. Deliver and pitch your topic in the best possible manner with this application patient satisfaction tactics enhance clinical results future estimated patient satisfaction status brochure pdf. Use them to share invaluable insights on future estimated patient satisfaction status at the medical facility and impress your audience. This template can be altered and modified as per your expectations. So, grab it now.
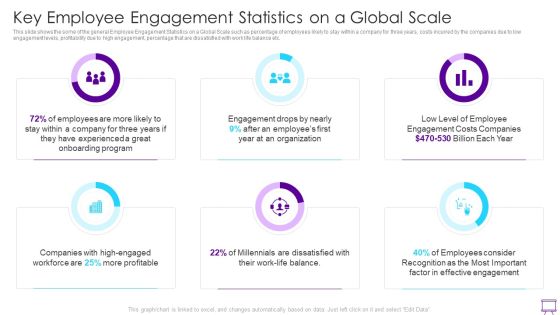
Strategies To Enhance Employee Engagement Key Employee Engagement Statistics On A Global Scale Inspiration PDF
This slide shows the some of the general Employee Engagement Statistics on a Global Scale such as percentage of employees likely to stay within a company for three years, costs incurred by the companies due to low engagement levels, profitability due to high engagement, percentage that are dissatisfied with work life balance etc. Deliver and pitch your topic in the best possible manner with this Strategies To Enhance Employee Engagement Key Employee Engagement Statistics On A Global Scale Inspiration PDF Use them to share invaluable insights on Millennials Dissatisfied, Employees Consider, Level Employee and impress your audience. This template can be altered and modified as per your expectations. So, grab it now.

Key Patient Satisfaction Statistics On A Global Scale Microsoft PDF
This slide shows the some of the general Patient Satisfaction Statistics on a Global Scale such as percentage of patients that value customer service, patients not willing to hold call, percentage of patients who want appointment reminder etc. Presenting key patient satisfaction statistics on a global scale microsoft pdf to provide visual cues and insights. Share and navigate important information on six stages that need your due attention. This template can be used to pitch topics like informative texts from the providers, appointment reminder, healthcare institution. In addtion, this PPT design contains high resolution images, graphics, etc, that are easily editable and available for immediate download.
Effective Remuneration Management Talent Acquisition Retention Key Employee Compensation Management Icons PDF
This slide shows the some of the general Employee Compensation Management Statistics on a Global Scale such as percentage of employees disagreeing on being paid fairly, percentage of companies having a compensation management system in their company etc. Presenting effective remuneration management talent acquisition retention key employee compensation management icons pdf to provide visual cues and insights. Share and navigate important information on six stages that need your due attention. This template can be used to pitch topics like payment, employees, compared, management, organization. In addtion, this PPT design contains high resolution images, graphics, etc, that are easily editable and available for immediate download.

End User Computing Problems Faced By The Company Pictures PDF Ppt PowerPoint Presentation File Inspiration PDF
This slide describes the problems faced by the company that include the percentage of total spreadsheets, percentage of excel sheets that contains errors and number of managers who do not know about high risk spreadsheets. If your project calls for a presentation, then Slidegeeks is your go to partner because we have professionally designed, easy to edit templates that are perfect for any presentation. After downloading, you can easily edit End User Computing Problems Faced By The Company Pictures PDF Ppt PowerPoint Presentation File Inspiration PDF and make the changes accordingly. You can rearrange slides or fill them with different images. Check out all the handy templates.

Auto Insurance Policies Claims Management Dashboard Infographics PDF
This slide illustrates graphical representation of data that helps the insurer company manages the car insurance policy claims. It includes no. of claims, percentage of claims, claims by usage, claims by type of vehicle etc. Pitch your topic with ease and precision using this Auto Insurance Policies Claims Management Dashboard Infographics PDF. This layout presents information on Percentage Claims, Claims Usage, Claims Type Vehicle. It is also available for immediate download and adjustment. So, changes can be made in the color, design, graphics or any other component to create a unique layout.

Database Migration Assessment Executive Summary Dashboard Mockup PDF
This slide shows the KPI dashboard of data migration assessment. It includes details related to development status to plan, target design percentage complete, field mapping percentage complete and field mapping and rule backlog. Pitch your topic with ease and precision using this Database Migration Assessment Executive Summary Dashboard Mockup PDF. This layout presents information on Wave, Process Area, Rule Build Status Plan. It is also available for immediate download and adjustment. So, changes can be made in the color, design, graphics or any other component to create a unique layout

Quarterly Sales Employee Representative Performance Assessment Scorecard For Service Business Professional PDF
This slide provides insights about quarterly sales performance assessment matrix which can be used by business to forecast organisation future profitability. It includes elements such as revenue, sales amount, units sold, production cost, profits and profit percentage to sales. Pitch your topic with ease and precision using this Quarterly Sales Employee Representative Performance Assessment Scorecard For Service Business Professional PDF. This layout presents information on Revenue, Sales Amount, Units Sold, Production Cost, Cost, Profits, Profit Percentage To Sales. It is also available for immediate download and adjustment. So, changes can be made in the color, design, graphics or any other component to create a unique layout.

Shareholder Capital Structure For Food Company Inspiration PDF
The slide carries a shareholder structure to understand the food companys share capital and voting rights. Various components included are percentage of share capital and percentage of voting rights owned by each shareholder of the company. Pitch your topic with ease and precision using this Shareholder Capital Structure For Food Company Inspiration PDF. This layout presents information on Shareholder Capital Structure, Food Company. It is also available for immediate download and adjustment. So, changes can be made in the color, design, graphics or any other component to create a unique layout.

Future Estimated Patient Satisfaction Status At The Medical Facility Sample PDF
This slide shows the future Patient Satisfaction Status at the medical facility. This slide shows the percentage of patients that are satisfied and percentage that are dissatisfied at a medical facility after implementing patient satisfaction strategies.Deliver and pitch your topic in the best possible manner with this future estimated patient satisfaction status at the medical facility sample pdf. Use them to share invaluable insights on personalizing the patient, improve calling experience, simplifying billing processes and impress your audience. This template can be altered and modified as per your expectations. So, grab it now.

Customer Recommendation Program For Brand Awareness Formats PDF
The following slide showcases a comprehensive referral program which can used for improving brand awareness. Information covered in this slide is related to referral level, number of referrals, reward percentage and total reward points. Showcasing this set of slides titled Customer Recommendation Program For Brand Awareness Formats PDF. The topics addressed in these templates are Reward Points, Referral Level, Reward Percentage. All the content presented in this PPT design is completely editable. Download it and make adjustments in color, background, font etc. as per your unique business setting.

CSR Activities Company Reputation Management Determining Overall Impact Of CSR Implementation Ppt Icon Slide PDF
This slide covers information regarding the analysis of firms overall performance after the successful implementation of CSR program. Deliver and pitch your topic in the best possible manner with this csr activities company reputation management determining overall impact of csr implementation ppt icon slide pdf. Use them to share invaluable insights on annual percentage, recurring revenue generated csr, 2018 to 2020, annual percentage revenue spent csr, b corp score and impress your audience. This template can be altered and modified as per your expectations. So, grab it now.

CSR Activities Company Reputation Management Determining Overall Impact Of CSR Implementation Elements PDF
This slide covers information regarding the analysis of firms overall performance after the successful implementation of CSR program. Deliver and pitch your topic in the best possible manner with this csr activities company reputation management determining overall impact of csr implementation elements pdf. Use them to share invaluable insights on annual percentage, revenue spent csr, b corp score, annual percentage recurring revenue generated csr, customer purchasing decision csr influence, 2018 to 2020 and impress your audience. This template can be altered and modified as per your expectations. So, grab it now.

Determining Overall Impact Of CSR Implementation Ppt Pictures Model PDF
This slide covers information regarding the analysis of firms overall performance after the successful implementation of CSR program. Deliver and pitch your topic in the best possible manner with this determining overall impact of csr implementation ppt pictures model pdf. Use them to share invaluable insights on annual percentage of revenue spent on csr, annual percentage of recurring revenue generated due to csr, customer purchasing decision under csr influence, corp score and impress your audience. This template can be altered and modified as per your expectations. So, grab it now.
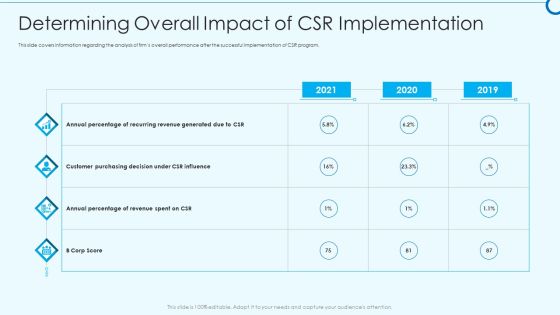
Developing Viable Working Surrounding Determining Overall Impact Of CSR Implementation Demonstration PDF
This slide covers information regarding the analysis of firms overall performance after the successful implementation of CSR program. Deliver an awe inspiring pitch with this creative developing viable working surrounding determining overall impact of csr implementation demonstration pdf bundle. Topics like annual percentage of revenue spent on csr, customer purchasing decision under csr influence, annual percentage of recurring revenue generated due to csrcan be discussed with this completely editable template. It is available for immediate download depending on the needs and requirements of the user.

Key People Engagement Statistics On A Global Scale Slides PDF
This slide shows the some of the general People Engagement Statistics on a Global Scale such as percentage of employees likely to stay within a company for three years, costs incurred by the companies due to low engagement levels, profitability due to high engagement, percentage that are dissatisfied with work life balance etc. Deliver an awe inspiring pitch with this creative key people engagement statistics on a global scale slides pdf bundle. Topics like onboarding program, engagement drops by nearly, engagement costs companies billion each can be discussed with this completely editable template. It is available for immediate download depending on the needs and requirements of the user.

Coronavirus Impact On Product Launches For 2020 Information PDF
Following slide provides information about the COVID 19 impact product launches for 2020. Here the graph indicates that 57 percentage products launches have been delayed and 6 percentage were cancelled due to the pandemic. Deliver and pitch your topic in the best possible manner with this coronavirus impact on product launches for 2020 information pdf. Use them to share invaluable insights on coronavirus impact on product launches for 2020 and impress your audience. This template can be altered and modified as per your expectations. So, grab it now.

Key Employee Compensation Management Statistics On A Global Scale Graphics PDF
This slide shows the some of the general Employee Compensation Management Statistics on a Global Scale such as percentage of employees disagreeing on being paid fairly, percentage of companies having a compensation management system in their company etc. This is a key employee compensation management statistics on a global scale graphics pdf template with various stages. Focus and dispense information on six stages using this creative set, that comes with editable features. It contains large content boxes to add your information on topics like organization, management, efficient. You can also showcase facts, figures, and other relevant content using this PPT layout. Grab it now.
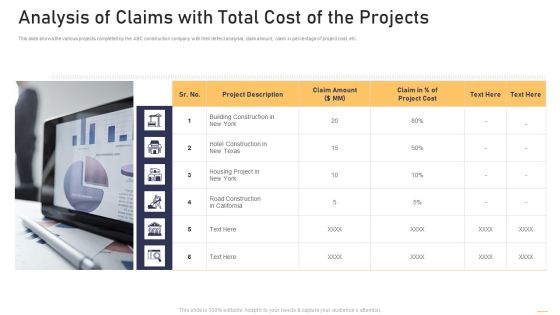
Surge In Construction Faults Lawsuits Case Competition Analysis Of Claims With Total Cost Of The Projects Elements PDF
This slide shows the various projects completed by the ABC construction company with their defect analysis, claim amount, claim in percentage of project cost, etc. This is a surge in construction faults lawsuits case competition analysis of claims with total cost of the projects elements pdf template with various stages. Focus and dispense information on six stages using this creative set, that comes with editable features. It contains large content boxes to add your information on topics like defect analysis, claim amount, claim in percentage of project cost. You can also showcase facts, figures, and other relevant content using this PPT layout. Grab it now.
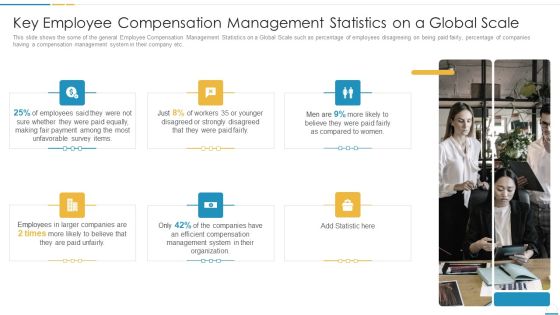
Key Employee Compensation Management Statistics On A Global Scale Designs PDF
This slide shows the some of the general Employee Compensation Management Statistics on a Global Scale such as percentage of employees disagreeing on being paid fairly, percentage of companies having a compensation management system in their company etc. This is a key employee compensation management statistics on a global scale designs pdf template with various stages. Focus and dispense information on six stages using this creative set, that comes with editable features. It contains large content boxes to add your information on topics like payment, management system, organization. You can also showcase facts, figures, and other relevant content using this PPT layout. Grab it now.

Current Patient Satisfaction Status At The Medical Facility Pictures PDF
This slide shows the current Patient Satisfaction Status at the medical facility. This slide shows the percentage of patients that are satisfied and percentage that are dissatisfied at a medical facility due to various reasons.Deliver an awe inspiring pitch with this creative current patient satisfaction status at the medical facility pictures pdf bundle. Topics like long waiting hours, inability to access, poor calling experience can be discussed with this completely editable template. It is available for immediate download depending on the needs and requirements of the user.

Communicate Company Value To Your Stakeholders Delivery Metrics Service Structure PDF
This template covers service delivery metrics aligned to a business value, such as percentage of projects on time, on budget, on spec, and percentage of business facing services meeting service level agreements slas. Deliver and pitch your topic in the best possible manner with this communicate company value to your stakeholders delivery metrics service structure pdf. Use them to share invaluable insights on project investments, services, metrics, budget, measure and impress your audience. This template can be altered and modified as per your expectations. So, grab it now.

Communicate Company Value To Your Stakeholders Innovation And Agility Metrics Microsoft PDF
This template covers IT service innovation and agility metrics aligned to a business value such as percentage of IT investment on run, grow, transform the business and percentage of project spend on customer facing initiatives. Deliver an awe inspiring pitch with this creative communicate company value to your stakeholders innovation and agility metrics microsoft pdf bundle. Topics like metric, project investments, metrics, business goals can be discussed with this completely editable template. It is available for immediate download depending on the needs and requirements of the user.
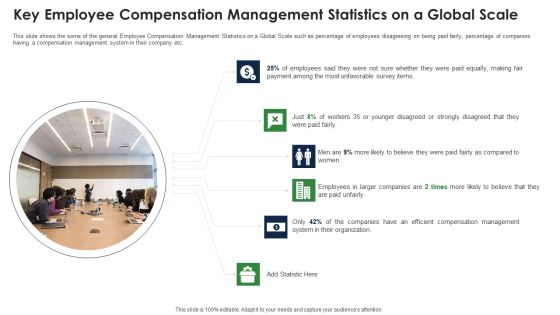
Key Employee Compensation Management Statistics On A Global Scale Topics PDF
This slide shows the some of the general Employee Compensation Management Statistics on a Global Scale such as percentage of employees disagreeing on being paid fairly, percentage of companies having a compensation management system in their company etc. This is a key employee compensation management statistics on a global scale topics pdf template with various stages. Focus and dispense information on six stages using this creative set, that comes with editable features. It contains large content boxes to add your information on topics like employees, organization, efficient, compensation, management, statistic. You can also showcase facts, figures, and other relevant content using this PPT layout. Grab it now.

Guidelines For Exhibiting Business Value Of Information And Technology Innovation And Agility Metrics Diagrams PDF
This template covers IT service innovation and agility metrics aligned to a business value such as percentage of IT investment on run, grow, transform the business and percentage of project spend on customer facing initiatives. Deliver an awe inspiring pitch with this creative guidelines for exhibiting business value of information and technology innovation and agility metrics diagrams pdf bundle. Topics like measures, investments, expenses, technological, capabilities can be discussed with this completely editable template. It is available for immediate download depending on the needs and requirements of the user.
