AI PPT Maker
Templates
PPT Bundles
Design Services
Business PPTs
Business Plan
Management
Strategy
Introduction PPT
Roadmap
Self Introduction
Timelines
Process
Marketing
Agenda
Technology
Medical
Startup Business Plan
Cyber Security
Dashboards
SWOT
Proposals
Education
Pitch Deck
Digital Marketing
KPIs
Project Management
Product Management
Artificial Intelligence
Target Market
Communication
Supply Chain
Google Slides
Research Services
 One Pagers
All Categories
-
Home
- Customer Favorites
- Percentage Circle
Percentage Circle

Circular Steps Of Global Business Process Powerpoint Templates
This PowerPoint diagram slide contains circular infographic. Download this diagram slide to display six steps of business process. You can edit text, color, shade and style of this diagram as per you need.
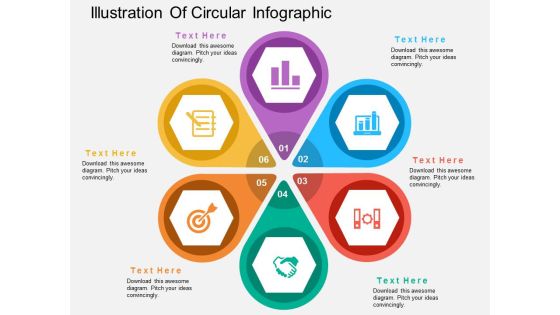
Illustration Of Circular Infographic Powerpoint Template
Our professionally designed business diagram is as an effective tool for communicating business ideas and strategies for corporate planning. This PPT slide contains circular Infographic. Download this template to build interactive presentation.
Number Banners Infographic Circular Layout Powerpoint Template
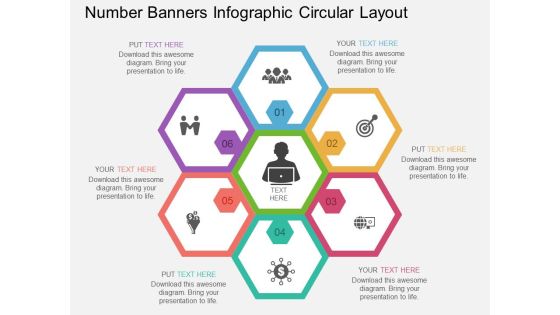
This business diagram contains business Infographic. Our professionally designed business diagram helps to depict business analysis. Enlighten your audience with your breathtaking ideas.
Four Steps Of Idea And Target Planning Powerpoint Slides
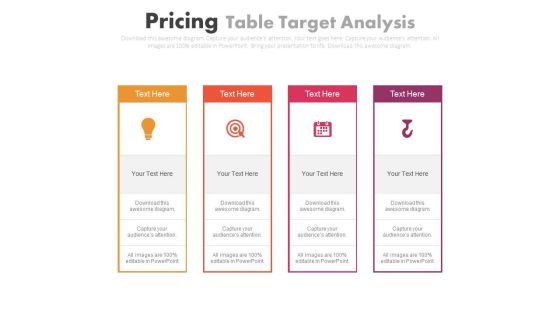
This PowerPoint template contains infographic diagram of display board. You may download this PPT slide design to display four ideas of target planning. You can easily customize this template to make it more unique as per your need.

Circular Process Business Infographic Diagram Powerpoint Template
Our above PowerPoint template displays circular infographic diagram. This diagram slide helps to exhibit steps of business incorporation. Above slide provide ideal backdrop to make business presentations.

Circular Network Diagram With Icons Powerpoint Slides
This PowerPoint template has been designed with circular diagram and business icons. This PPT slide displays six business steps in circular flow. You may download this PPT slide to display business process and workflow.
Readmit Rule Presentation Powerpoint Example
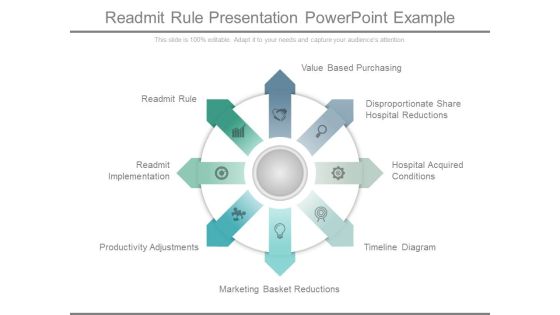
This is a readmit rule presentation powerpoint example. This is an eight stage process. The stages in this process are readmit rule, readmit implementation, productivity adjustments, marketing basket reductions, timeline diagram, hospital acquired conditions, disproportionate share hospital reductions, value based purchasing.

Demand Planning Demand Forecasting Example Of Ppt
This is a demand planning demand forecasting example of ppt. This is a four stage process. The stages in this process are demand planning, demand forecasting, assortment planning, demand forecasting, promotion planning.

Improving Investment Process Powerpoint Slides Background Designs
This is a improving investment process powerpoint slides background designs. This is a four stage process. The stages in this process are improving investment process, creating investment awareness, development competition portfolio, building investment foundation.

Corporate Governance Changes Ppt Powerpoint Ideas
This is a corporate governance changes ppt powerpoint ideas. This is a five stage process. The stages in this process are management and staff, external auditors, shareholder, internal auditors, other stakeholders.

Focus On Work Go Green Cost Focus Example Of Ppt
This is a focus on work go green cost focus example of ppt. This is a seven stage process. The stages in this process are focus on work, go green, insufficient space, virtual workforce, workplace strategy, technology and service, cost focus.
Management Function Planning Ppt Powerpoint Guide
This is a management function planning ppt powerpoint guide. This is a five stage process. The stages in this process are planning, organization, staffing, directing, controlling.
Operational Excellence Example Of Ppt Presentation
This is a operational excellence example of ppt presentation. This is a twelve stage process. The stages in this process are portfolio and project management, operational excellence, collaboration product innovation, responsive supply networks, marketing sales and aftermarket, product planning and execution.

Litigation And Judicial Activities Powerpoint Layout
This is a litigation and judicial activities powerpoint layout. This is a four stage process. The stages in this process are law enforcement, correctional activities, international affairs and commerce, litigation and judicial activities.
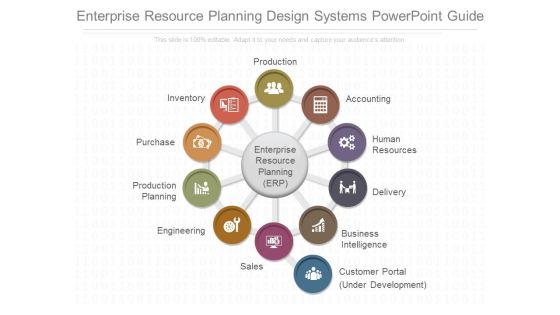
Enterprise Resource Planning Design Systems Powerpoint Guide
This is a enterprise resource planning design systems powerpoint guide. This is a eleven stage process. The stages in this process are production, accounting, human resources, delivery, business intelligence, customer portal under development, sales, engineering, production planning, purchase, inventory, enterprise resource planning.
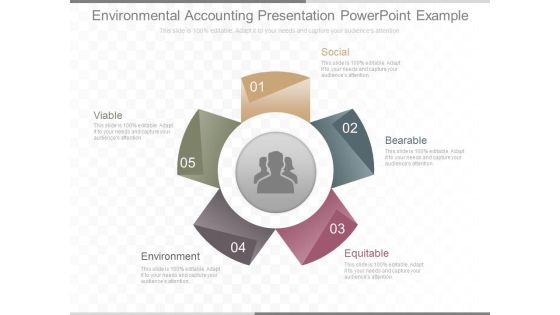
Environmental Accounting Presentation Powerpoint Example
This is a environmental accounting presentation powerpoint example. This is a five stage process. The stages in this process are viable, environment, equitable, bearable, social.
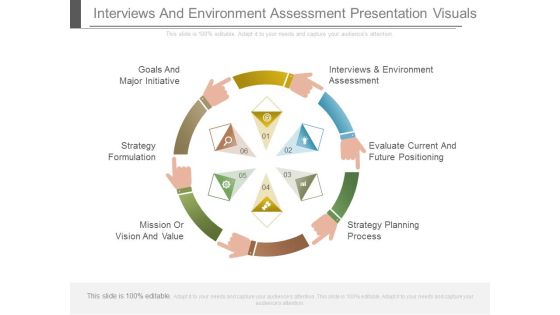
Interviews And Environment Assessment Presentation Visuals
This is a interviews and environment assessment presentation visuals. This is a six stage process. The stages in this process are goals and major initiative, strategy formulation, mission or vision and value, interviews and environment assessment, evaluate current and future positioning, strategy planning process.

Balanced Scorecard Information Metrics Ppt Slides
This is a balanced scorecard information metrics ppt slides. This is a four stage process. The stages in this process are assessing risk, conducting decision support, measuring program effectiveness, implementing controls.
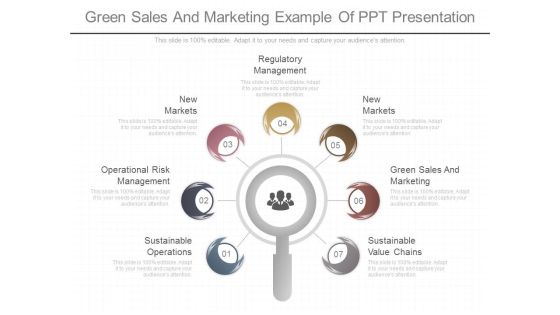
Green Sales And Marketing Example Of Ppt Presentation
This is a green sales and marketing example of ppt presentation. This is a seven stage process. The stages in this process are sustainable operations, operational risk management, markets new, regulatory management, markets markets new, green sales and marketing, sustainable value chains.

Hrm Competitive Advantage Ppt Powerpoint Slide Ideas
This is a hrm competitive advantage ppt powerpoint slide ideas. This is a five stage process. The stages in this process are motivate employee, retain employee, train employee, hire employee, attract employee.
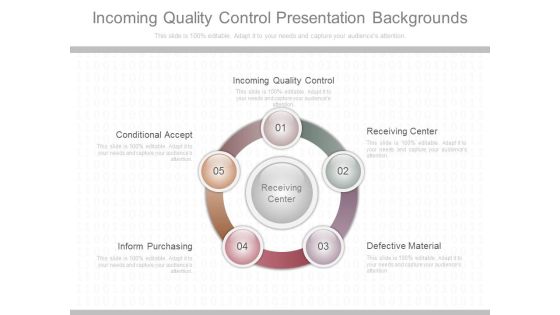
Incoming Quality Control Presentation Backgrounds
This is an incoming quality control presentation backgrounds. This is a five stage process. The stages in this process are incoming quality control, receiving center, defective material, inform purchasing, conditional accept.

Web Based Crm For Small Business Ppt Slides Styles
This is a web based crm for small business ppt slides styles. This is a ten stage process. The stages in this process are sales, support, marketing, collections, reports, inventory, security, work flow, customize, email sms.

Net Promoter Score Marketing Layout Powerpoint Templates
This is a net promoter score marketing layout powerpoint templates. This is a three stage process. The stages in this process are net promoter score, know your business, know your customer, know your market.
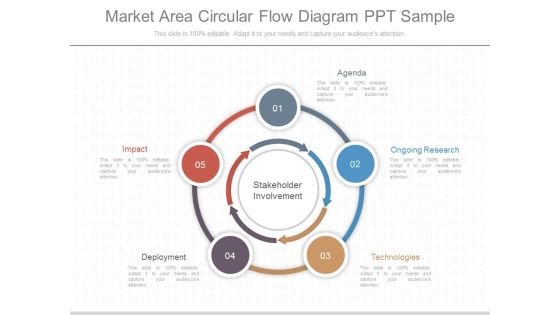
Market Area Circular Flow Diagram Ppt Sample
This is a market area circular flow diagram ppt sample. This is a five stage process. The stages in this process are agenda, ongoing research, technologies, deployment, impact.

Information Literacy Activities Ppt Powerpoint Presentation Templates
This is a information literacy activities ppt powerpoint presentation templates. This is a six stage process. The stages in this process are select sources, analyze content, evaluate, identify options, present finding, define task.

Architectural Project Management Plan Ppt Summary
This is a architectural project management plan ppt summary. This is a seven stage process. The stages in this process are design, project closeout, owner occupancy, commissioning, construction, procurement, pre construction.

Affiliate Web Marketing Techniques Diagram Powerpoint Graphics
This is a affiliate web marketing techniques diagram powerpoint graphics. This is a four stage process. The stages in this process are affiliate gets a commission you get a sale, affiliate puts your ad on their website, customer clicks and converts, conversions are tracked.

Customer Retention Tools Example Of Ppt
This is a customer retention tools example of ppt. This is a five stage process. The stages in this process are align systems with goals and strategy, consolidate customer data, segment customers, personalise customer interactions, re evaluate and recalibrate crm strategy.

Operational Development And Planning Ppt Images
This is a operational development and planning ppt images. This is a six stage process. The stages in this process are consultation, budgetary, calendar of event, maintenance schedules, facility use schedules, training plans, operational plan.

Service Strategy Cycle For Demand Management Ppt Example Of Ppt
This is a service strategy cycle for demand management ppt example of ppt. This is a three stage process. The stages in this process are service transition, service operation, service design, demand forecast, supply plan, marketing strategy, demand management.

Sample Of Sustained Behavioral Change Ppt Slides Show
This is a sample of sustained behavioral change ppt slides show. This is a five stage process. The stages in this process are training, remuneration, culture, consequence management, performance management, skill, attitude, behavior.

4 Points Survey Venn Circular Diagram Ppt PowerPoint Presentation Visuals
This is a 4 points survey venn circular diagram ppt powerpoint presentation visuals. This is a four stage process. The stages in this process are circular diagrams, venn diagram, survey diagram.
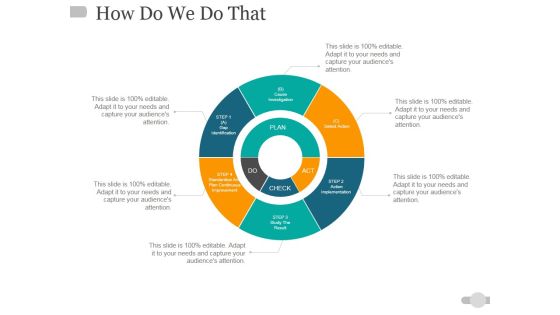
How Do We Do That Ppt PowerPoint Presentation Model Topics
This is a how do we do that ppt powerpoint presentation model topics. This is a six stage process. The stages in this process are plan, act, check, do.

Competitor Positioning Ppt PowerPoint Presentation Outline Tips
This is a competitor positioning ppt powerpoint presentation outline tips. This is a two stage process. The stages in this process are company growth, business, marketing, finance, graph.
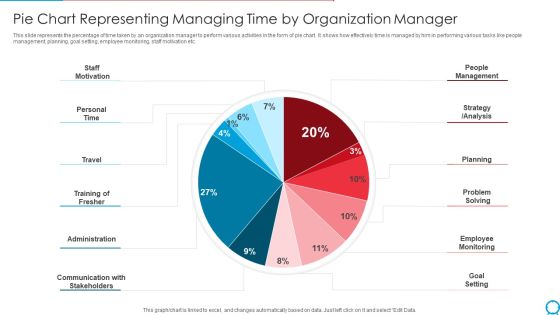
Pie Chart Representing Managing Time By Organization Manager Ppt PowerPoint Presentation Gallery Template PDF
This slide represents the percentage of time taken by an organization manager to perform various activities in the form of pie chart. It shows how effectively time is managed by him in performing various tasks like people management, planning, goal setting, employee monitoring, staff motivation etc. Pitch your topic with ease and precision using this pie chart representing managing time by organization manager ppt powerpoint presentation gallery template pdf. This layout presents information on staff motivation, personal time, travel training of fresher, administration. It is also available for immediate download and adjustment. So, changes can be made in the color, design, graphics or any other component to create a unique layout.

PowerPoint Backgrounds Process Chart Marketing Ppt Templates
PowerPoint Backgrounds Process Chart Marketing PPT Templates-The Circle of Life - a concept emmbedded in our minds and hence easy to comprehend. Life and Business is made up of processes comprising stages that flow from one to another. An excellent graphic to attract the attention of and understanding by your audience to improve earnings-PowerPoint Backgrounds Process Chart Marketing PPT Templates-This ppt can be used for presentations relating to-Arrow, Bond, Business, Button, Buying, Career, Change, Chart, Children, Circle, College, Death, Diagram, Education, Financial, Future, Graphic, House, Illustration, Investing, Investment, Marriage, Menu, Personal, Plan, Process

PowerPoint Template Business Process Chart Editable Ppt Design Slides
PowerPoint Template Business Process Chart Editable PPT Design Slides-The Circle of Life - a concept emmbedded in our minds and hence easy to comprehend. Life and Business is made up of processes comprising stages that flow from one to another. An excellent graphic to attract the attention of and understanding by your audience to improve earnings-PowerPoint Template Business Process Chart Editable PPT Design Slides-This ppt can be used for presentations relating to-Arrow, Bond, Business, Button, Buying, Career, Change, Chart, Children, Circle, College, Death, Diagram, Education, Financial, Future, Graphic, House, Illustration, Investing, Investment, Marriage, Menu, Personal, Plan, Process
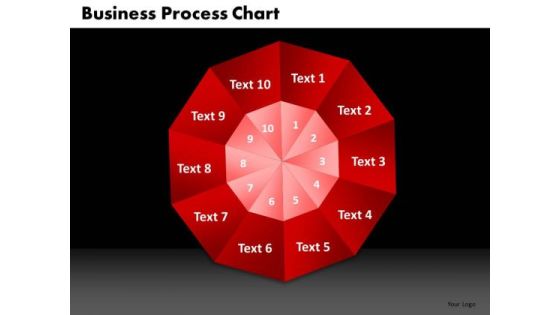
PowerPoint Templates Process Chart Business Ppt Design Slides
PowerPoint Templates Process Chart Business PPT Design Slides-The Circle of Life - a concept emmbedded in our minds and hence easy to comprehend. Life and Business is made up of processes comprising stages that flow from one to another. An excellent graphic to attract the attention of and understanding by your audience to improve earnings-PowerPoint Templates Process Chart Business PPT Design Slides-This ppt can be used for presentations relating to-Arrow, Bond, Business, Button, Buying, Career, Change, Chart, Children, Circle, College, Death, Diagram, Education, Financial, Future, Graphic, House, Illustration, Investing, Investment, Marriage, Menu, Personal, Plan, Process

Modal Transportation Share In United States Brochure PDF
The slide shows the pie chart presentation of percentage share of all modes of transportations Trains, Passenger cars, Other motor, buses etc., that travelers used to commute. Additionally, it provides key details related to companys strategic plan to attract new customers.Deliver and pitch your topic in the best possible manner with this modal transportation share in united states brochure pdf. Use them to share invaluable insights on transportation share 2021 and impress your audience. This template can be altered and modified as per your expectations. So, grab it now.

Determining The Major Issues Caused By Covid19 And Its Impact On Food Industry Demonstration PDF
Mentioned slide shows informational stats about the major issues caused by the coronavirus and their impact on food industry. Here the pie chart indicates that about 52 percentage of the food companies said that coronavirus had a dramatic impact on their operations. Deliver and pitch your topic in the best possible manner with this determining the major issues caused by covid19 and its impact on food industry demonstration pdf. Use them to share invaluable insights on communication, industry, dramatic and impress your audience. This template can be altered and modified as per your expectations. So, grab it now.

Modal Transportation Share In United States Ppt Inspiration Master Slide PDF
The slide shows the pie chart presentation of percentage share of all modes of transportations Trains, Passenger cars, Other motor, buses etc., that travelers used to commute. Additionally, it provides key details related to companys strategic plan to attract new customers. Deliver and pitch your topic in the best possible manner with this modal transportation share in united states ppt inspiration master slide pdf. Use them to share invaluable insights on marketing strategy, investment in technology, strategies and impress your audience. This template can be altered and modified as per your expectations. So, grab it now.
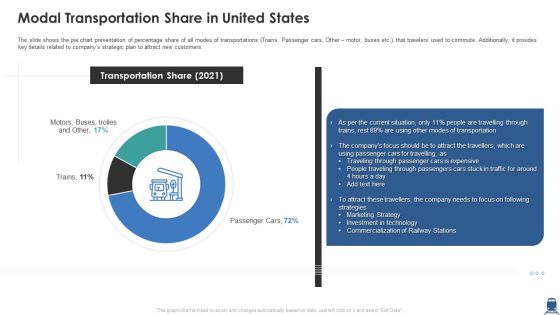
Modal Transportation Share In United States Sample PDF
The slide shows the pie chart presentation of percentage share of all modes of transportations Trains, Passenger cars, Other motor, buses etc. that travelers used to commute. Additionally, it provides key details related to companys strategic plan to attract new customers. Deliver and pitch your topic in the best possible manner with this modal transportation share in united states sample pdf. Use them to share invaluable insights on marketing strategy, investment technology, commercialization and impress your audience. This template can be altered and modified as per your expectations. So, grab it now.

Modal Transportation Share In United States 2021 Introduction PDF
The slide shows the pie chart presentation of percentage share of all modes of transportations Trains, Passenger cars, Other motor, buses etc, that travelers used to commute. Additionally, it provides key details related to companys strategic plan to attract new customers.Deliver an awe inspiring pitch with this creative modal transportation share in united states 2021 introduction pdf bundle. Topics like modes of transportation, commercialization of railway, marketing strategy can be discussed with this completely editable template. It is available for immediate download depending on the needs and requirements of the user.
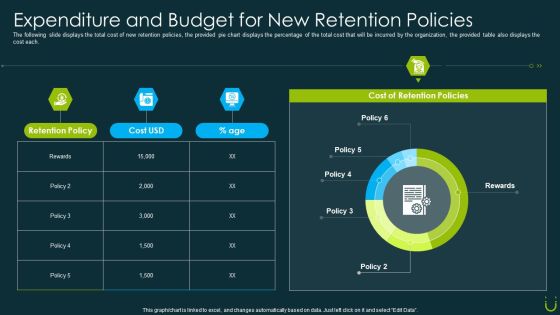
Staff Retention Plan Expenditure And Budget For New Retention Policies Ppt Ideas Graphics PDF
The following slide displays the total cost of new retention policies, the provided pie chart displays the percentage of the total cost that will be incurred by the organization, the provided table also displays the cost each. Deliver an awe inspiring pitch with this creative staff retention plan expenditure and budget for new retention policies ppt ideas graphics pdf bundle. Topics like expenditure and budget for new retention policies can be discussed with this completely editable template. It is available for immediate download depending on the needs and requirements of the user.

Strategic Human Resource Retention Management Expenditure And Budget Inspiration PDF
The following slide displays the total cost of new retention policies, the provided pie chart displays the percentage of the total cost that will be incurred by the organization, the provided table also displays the cost each. Deliver an awe inspiring pitch with this creative Strategic Human Resource Retention Management Expenditure And Budget Inspiration PDF bundle. Topics like Retention Policies, Rewards, Cost Of Retention can be discussed with this completely editable template. It is available for immediate download depending on the needs and requirements of the user.

Managing Employee Turnover Expenditure And Budget For New Retention Policies Topics PDF
The following slide displays the total cost of new retention policies, the provided pie chart displays the percentage of the total cost that will be incurred by the organization, the provided table also displays the cost each. Deliver and pitch your topic in the best possible manner with this Managing Employee Turnover Expenditure And Budget For New Retention Policies Topics PDF. Use them to share invaluable insights on Expenditure And Budget, New Retention Policies and impress your audience. This template can be altered and modified as per your expectations. So, grab it now.
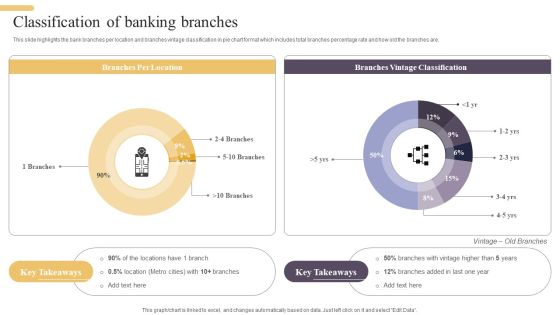
Improving Digital Banking Operations And Services Framework Classification Of Banking Branches Brochure PDF
This slide highlights the bank branches per location and branches vintage classification in pie chart format which includes total branches percentage rate and how old the branches are. Take your projects to the next level with our ultimate collection of Improving Digital Banking Operations And Services Framework Classification Of Banking Branches Brochure PDF. Slidegeeks has designed a range of layouts that are perfect for representing task or activity duration, keeping track of all your deadlines at a glance. Tailor these designs to your exact needs and give them a truly corporate look with your own brand colors they will make your projects stand out from the rest.

SDLC Models Applied By Industries Phases Of Software Development Procedure Mockup PDF
This slide depicts the percentage of the software development lifecycle models used by industries in 2021, including the waterfall, spiral, iterative, agile, and RAD models.This SDLC Models Applied By Industries Phases Of Software Development Procedure Mockup PDF is perfect for any presentation, be it in front of clients or colleagues. It is a versatile and stylish solution for organizing your meetings. The product features a modern design for your presentation meetings. The adjustable and customizable slides provide unlimited possibilities for acing up your presentation. Slidegeeks has done all the homework before launching the product for you. So, do not wait, grab the presentation templates today.

Company Shareholder Structure With Yearly Comparison Infographics PDF
The slide illustrates a company shareholder structure for two previous years to evaluate the change in ownership. It shows the percentage of shares owned by various companies such as Company A, Company B, Company C, etc. Pitch your topic with ease and precision using this Company Shareholder Structure With Yearly Comparison Infographics PDF. This layout presents information on Structure With Yearly Comparison, Company Shareholder. It is also available for immediate download and adjustment. So, changes can be made in the color, design, graphics or any other component to create a unique layout.

Company Shareholder Detailed Structure Overview Elements PDF
The slide carries a structure to define the percentage of ownership held by different shareholders of the company. Various shareholders included are Peter and Sons Co., Smith Williamson Ltd., Marx Inc., etc. Presenting Company Shareholder Detailed Structure Overview Elements PDF to dispense important information. This template comprises seven stages. It also presents valuable insights into the topics including Company Shareholder, Detailed Structure Overview. This is a completely customizable PowerPoint theme that can be put to use immediately. So, download it and address the topic impactfully.
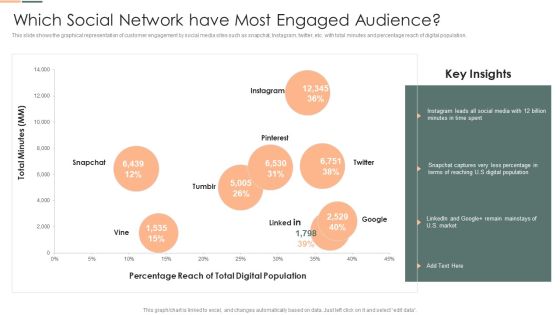
Developing Client Engagement Techniques Which Social Network Have Most Engaged Audience Rules PDF
This slide shows the graphical representation of customer engagement by social media sites such as snapchat, Instagram, twitter, etc. with total minutes and percentage reach of digital population. Presenting Developing Client Engagement Techniques Which Social Network Have Most Engaged Audience Rules PDF to provide visual cues and insights. Share and navigate important information on eight stages that need your due attention. This template can be used to pitch topics like Market, Digital Population, Social Media. In addtion, this PPT design contains high resolution images, graphics, etc, that are easily editable and available for immediate download.
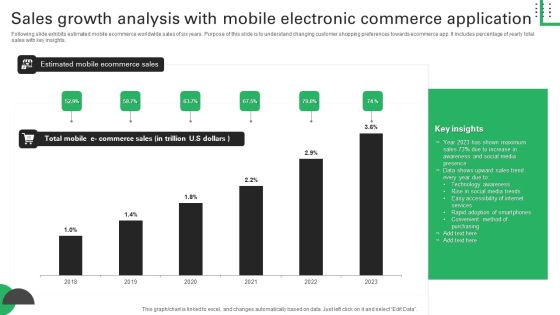
Sales Growth Analysis With Mobile Electronic Commerce Application Structure PDF
Following slide exhibits estimated mobile ecommerce worldwide sales of six years. Purpose of this slide is to understand changing customer shopping preferences towards ecommerce app. It includes percentage of yearly total sales with key insights. Pitch your topic with ease and precision using this Sales Growth Analysis With Mobile Electronic Commerce Application Structure PDF. This layout presents information on Shown Maximum, Awareness Social Media, Accessibility Internet. It is also available for immediate download and adjustment. So, changes can be made in the color, design, graphics or any other component to create a unique layout.

Monthly Performance Sales Report For Multiple Stores Structure PDF
The slide carries a quarterly store wise product sales report to evaluate the business growth. Various KPIs included are previous year 2022, current year 2023, variance percentage and variance. Pitch your topic with ease and precision using this Monthly Performance Sales Report For Multiple Stores Structure PDF. This layout presents information on Monthly Performance Sales, Report For Multiple Stores. It is also available for immediate download and adjustment. So, changes can be made in the color, design, graphics or any other component to create a unique layout.

Company Shareholder Structure With Share Capital Distribution Background PDF
The slide carries a shareholder structure to represent the distribution of share capital among various groups. The slide shows the percentage of capital owned by different shareholders such as The ABC Family Group, Foundation Group, etc. Pitch your topic with ease and precision using this Company Shareholder Structure With Share Capital Distribution Background PDF. This layout presents information on Executive Board, Management, Capital. It is also available for immediate download and adjustment. So, changes can be made in the color, design, graphics or any other component to create a unique layout.

Yearly Price List Data Comparison Chart Structure PDF
This slide showcases price catalogue chart that can help in comparing the cost of product in different financial years and calculate the price hiked by organization. It also outlines percentage change in prices Showcasing this set of slides titled yearly price list data comparison chart structure pdf. The topics addressed in these templates are yearly price list data comparison chart. All the content presented in this PPT design is completely editable. Download it and make adjustments in color, background, font etc. as per your unique business setting.

Business Operational Expenditure Budget Sheet With Financial Analysis Structure PDF
This slide represents operating expenditure opex budget sheet with financial analysis assisting companies in managing routine expenses and evaluate variance in the budget. It also provides information about particulars, actual, budget, difference and percentage change. Showcasing this set of slides titled Business Operational Expenditure Budget Sheet With Financial Analysis Structure PDF. The topics addressed in these templates are Marketing Programs, Professional Services, Interest Expense. All the content presented in this PPT design is completely editable. Download it and make adjustments in color, background, font etc. as per your unique business setting.
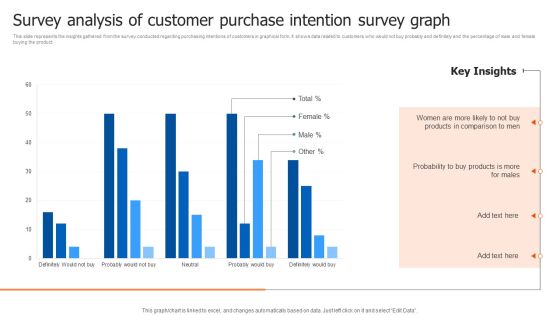
Survey Analysis Of Customer Purchase Intention Survey Graph Structure PDF
This slide represents the insights gathered from the survey conducted regarding purchasing intentions of customers in graphical form. It shows data related to customers who would not buy probably and definitely and the percentage of male and female buying the product. Pitch your topic with ease and precision using this Survey Analysis Of Customer Purchase Intention Survey Graph Structure PDF. This layout presents information on Probability, Products, Key Insights. It is also available for immediate download and adjustment. So, changes can be made in the color, design, graphics or any other component to create a unique layout.

Dashboard To Measure Robotic Process Automation Bots Performance Structure PDF
This slide presents a dashboard to measure RPA bots performance in an organization. It includes utilization hours, bot types, average daily utilization, percentage of errors that occurred by bots, and occupied bots by business operations. If your project calls for a presentation, then Slidegeeks is your go-to partner because we have professionally designed, easy-to-edit templates that are perfect for any presentation. After downloading, you can easily edit Dashboard To Measure Robotic Process Automation Bots Performance Structure PDF and make the changes accordingly. You can rearrange slides or fill them with different images. Check out all the handy templates
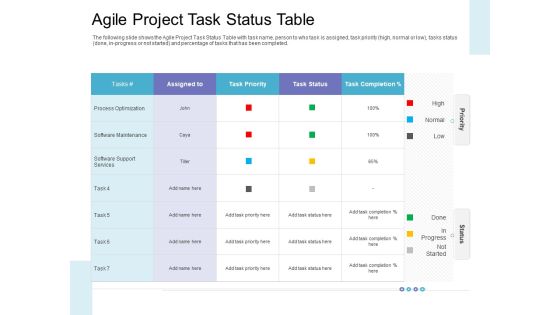
Executing Operations Structured System Support Agile Project Task Status Table Sample PDF
The following slide shows the Agile Project Task Status Table with task name, person to who task is assigned, task priority high, normal or low, tasks status done, in progress or not started and percentage of tasks that has been completed. Deliver an awe-inspiring pitch with this creative executing operations structured system support agile project task status table sample pdf bundle. Topics like process optimization, task priority, task completion can be discussed with this completely editable template. It is available for immediate download depending on the needs and requirements of the user.

Banking And Finance Company Shareholder Structure Summary PDF
The slide illustrates an ownership structure for a banking and finance company to indicate the percentage of shareholdings. Various shareholders included are ABC bank, Holding Co., Investment Bank, Silver Finance Bank, etc. Showcasing this set of slides titled Banking And Finance Company Shareholder Structure Summary PDF. The topics addressed in these templates are Banking And Finance, Investment Bank, Silver Finance Bank. All the content presented in this PPT design is completely editable. Download it and make adjustments in color, background, font etc. as per your unique business setting.
