Percentage Circle

Pitch Deck To Raise Capital From Commercial Financial Institution Using Bonds Companys Shareholder Structure With Details Information PDF
This slide shows companys Shareholder structure with shareholder names and their respective percentages Deliver an awe inspiring pitch with this creative pitch deck to raise capital from commercial financial institution using bonds companys shareholder structure with details information pdf bundle. Topics like consumer finance companies, add shareholder details here, banking institutions can be discussed with this completely editable template. It is available for immediate download depending on the needs and requirements of the user.
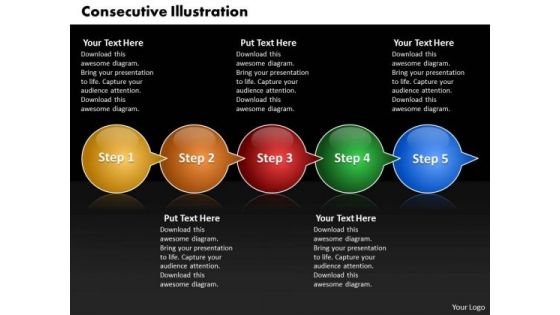
Ppt Consecutive Example Of 5 PowerPoint Slide Numbers Through Arrows Templates
PPT consecutive example of 5 powerpoint slide numbers through arrows Templates-The above template displays a diagram of circles connected with arrows. This is a graphic organizer for recording related ideas about a concept. It can be used to emphasize direction of movement and interconnections of stages in a flow. Deliver amazing presentations to mesmerize your audience.-PPT consecutive example of 5 powerpoint slide numbers through arrows Templates-3d, Abstract, Arrow, Circle, Circular, Click, Computer, Data, Direction, Graphic, Icon, Illustration, Insignia, Intention, Internet, Isolated, Label, Mail, Mascot, Media, Menu, Motion, Page, Pushing, Search, Shiny, Sign, Simple, Symbol
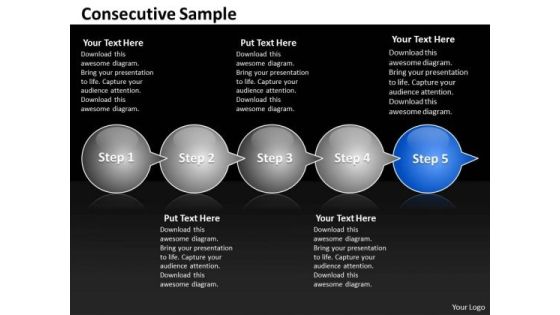
Ppt Consecutive Sample Of 5 Steps Through Curved Arrows PowerPoint 2010 Templates
PPT consecutive sample of 5 steps through curved arrows powerpoint 2010 Templates-The above template displays a diagram of circles connected with arrows. This is a graphic organizer for recording related ideas about a concept. It can be used to emphasize direction of movement and interconnections of stages in a flow. Deliver amazing presentations to mesmerize your audience.-PPT consecutive sample of 5 steps through curved arrows powerpoint 2010 Templates-3d, Abstract, Arrow, Circle, Circular, Click, Computer, Data, Direction, Graphic, Icon, Illustration, Insignia, Intention, Internet, Isolated, Label, Mail, Mascot, Media, Menu, Motion, Page, Pushing, Search, Shiny, Sign, Simple, Symbol
Product Marketing And Promotional Budget Spends Pie Chart Icons PDF
This slide covers marketing expenditures from budget allotted. It includes percentages for online advertising, sales training, conventions, trade shows, print advertising, publications, radio advertisements, magazines, catalogues and brochures. Pitch your topic with ease and precision using this Product Marketing And Promotional Budget Spends Pie Chart Icons PDF. This layout presents information on Conventions Were Maximum, Drive Maximum, Profit And Sales. It is also available for immediate download and adjustment. So, changes can be made in the color, design, graphics or any other component to create a unique layout.

Doughnut Chart Ppt PowerPoint Presentation Styles Backgrounds
This is a doughnut chart ppt powerpoint presentation styles backgrounds. This is a three stage process. The stages in this process are percentage, finance, business, marketing, strategy.
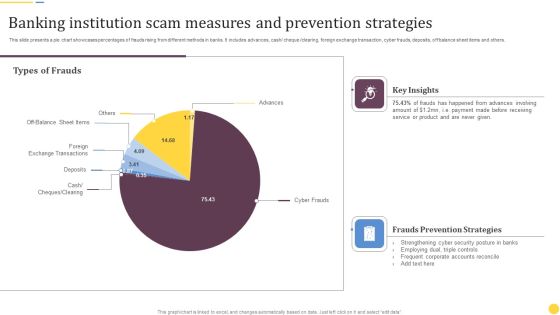
Banking Institution Scam Measures And Prevention Strategies Information PDF
This slide presents a pie chart showcases percentages of frauds rising from different methods in banks. It includes advances, cash or cheque or clearing, foreign exchange transaction, cyber frauds, deposits, off balance sheet items and others. Showcasing this set of slides titled Banking Institution Scam Measures And Prevention Strategies Information PDF. The topics addressed in these templates are Key Insights, Frauds Prevention Strategies, Types Of Frauds. All the content presented in this PPT design is completely editable. Download it and make adjustments in color, background, font etc. as per your unique business setting.

Doughnut Chart Ppt PowerPoint Presentation Visual Aids Files
This is a doughnut chart ppt powerpoint presentation visual aids files. This is a three stage process. The stages in this process are finance, donut, percentage, business, marketing.

Weekly Resource Planning Management With Task Allocation Structure PDF
This slide focuses on the weekly resourcing plan of organizational workforce which includes software developer, project manager, administrator, team leader and engineer that shows percentages of total resource utilization with allocation of project tasks. Presenting Weekly Resource Planning Management With Task Allocation Structure PDF to dispense important information. This template comprises six stages. It also presents valuable insights into the topics including Software Developer, Project Manager, Administrator. This is a completely customizable PowerPoint theme that can be put to use immediately. So, download it and address the topic impactfully.
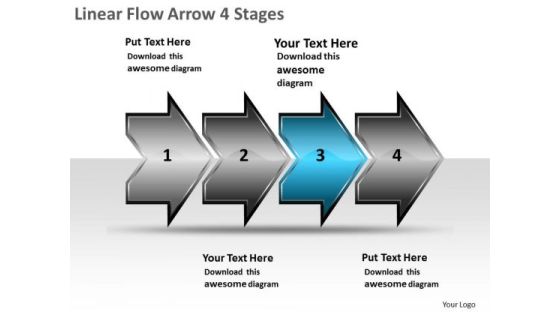
Linear Flow Arrow 4 Stages Ppt Charting Slides PowerPoint Templates
We present our linear flow arrow 4 stages ppt charting Slides PowerPoint templates. Use our Design PowerPoint Templates because, your quicksilver ideas are the arrows in your quiver. Use our Arrows PowerPoint Templates because, Ideas roll along in your mind like billiard balls. Use our Business PowerPoint Templates because, The Venn graphic comprising interlinking circles geometrically demonstrate how various functions operating independently, to a large extent, are essentially interdependent. Use our Shapes PowerPoint Templates because; Highlight the important timelines and milestones of this exciting journey. Use our Process and Flows PowerPoint Templates because; illustrate your plans to your listeners with the same accuracy. Use these PowerPoint slides for presentations relating to 3d, abstract, around, arrows, business, center, circle, circular, concept, connections, curve, cycle, directions, distribution, illustration, management, middle, objects, plan, process, recycle, rounded, shadows, space, system. The prominent colors used in the PowerPoint template are Blue, Black, and Gray

3d Chronological Puzzle Process 8 Stages Quote Flow Chart PowerPoint Templates
We present our 3d chronological puzzle process 8 stages quote flow chart PowerPoint templates. Use our Leadership PowerPoint Templates because, The Venn graphic comprising interlinking circles geometrically demonstrate how various functions operating independently, to a large extent, are essentially interdependent. Use our Puzzles or Jigsaws PowerPoint Templates because; now funnel your marketing strategies down the cone, stage by stage, refining as you go along. Use our Arrows PowerPoint Templates because; Show them how you can save the day. Use our Business PowerPoint Templates because, aesthetically designed to make a great first impression this template highlights. Use our Metaphors-Visual Concepts PowerPoint Templates because, Activities which in themselves have many inherent business opportunities. Use these PowerPoint slides for presentations relating to Art, business, chart, circle, clip, diagram, metaphor, marketing, finance, success, drop, graph, graphic, icon, illustration, process, puzzle, round, set, shadow, leadership, sales, shape, transparency. The prominent colors used in the PowerPoint template are Blue, Gray, and White
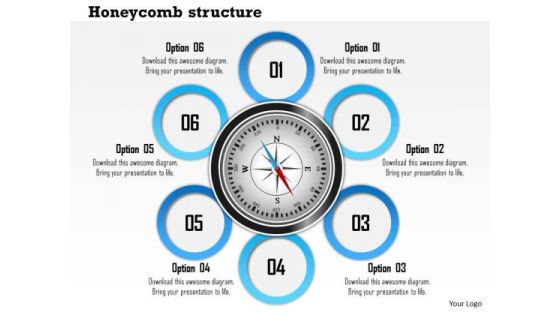
Business Diagram Six Staged Honey Comb Structure Diagram Presentation Template
This Power Point template slide has been designed with graphic of 3d compass and six text circles around it. Display any six levels of data with this exclusive diagram and get good remarks. Give professional appearance to your presentations using this business slide.

PowerPoint Designs Sales Environment Ppt Themes
PowerPoint Designs Sales Environment PPT Themes-The Venn graphic comprising interlinking circles geometrically demonstrate how various functions operating independently, to a large extent, are essentially interdependent. Amplify on this basic corporate concept and forefront the benefits of overlapping processes to arrive at common goals.

Leaders With Team Members Introduction Powerpoint Slides
This PowerPoint template displays circles chart with team pictures. This PPT slide may be used for team briefing sessions or it may be used to display leadership and teamwork concepts. Transmit your thoughts via this slide and prod your team to action.

Venn Diagram For Business Deal And Analysis Powerpoint Slides
This power point template contains graphic of two circles with handshake and bar chart icons. Use this Venn diagram for business deal planning and strategy analysis. Illustrate your ideas and imprint them in the minds of your team with this template.

Pie Chart Ppt PowerPoint Presentation Professional Pictures
This is a pie chart ppt powerpoint presentation professional pictures. This is a five stage process. The stages in this process are pie chart, percentage, finance, process, business.
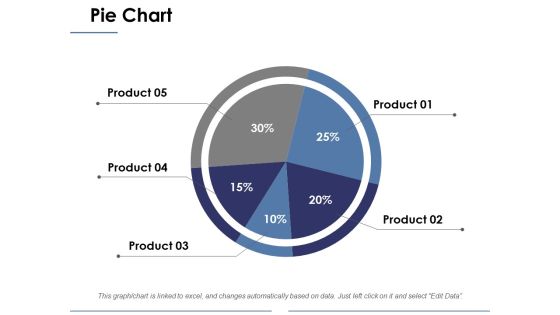
Pie Chart Ppt PowerPoint Presentation Infographics Shapes
This is a pie chart ppt powerpoint presentation infographics shapes. This is a five stage process. The stages in this process are business, pie chart, marketing, percentage, strategy.
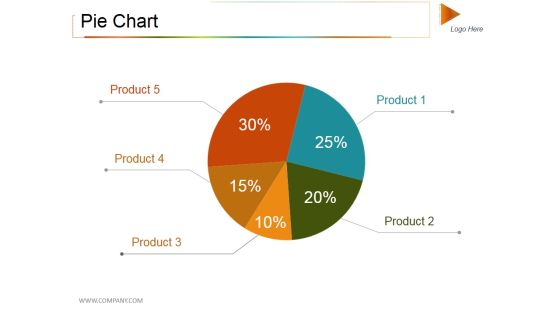
Pie Chart Ppt PowerPoint Presentation Styles Objects
This is a pie chart ppt powerpoint presentation styles objects. This is a five stage process. The stages in this process are pie, process, percentage, finance, business.
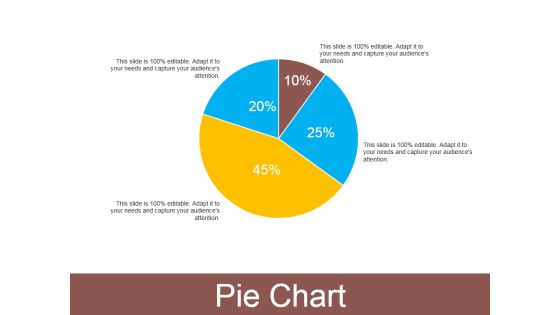
Pie Chart Ppt PowerPoint Presentation Outline Smartart
This is a pie chart ppt powerpoint presentation outline smartart. This is a four stage process. The stages in this process are pie, process, percentage, finance, business.

Pie Chart Ppt PowerPoint Presentation Visual Aids
This is a pie chart ppt powerpoint presentation visual aids. This is a five stage process. The stages in this process are pie, finance, analysis, division, percentage.

Pie Chart Ppt PowerPoint Presentation Deck
This is a pie chart ppt powerpoint presentation deck. This is a five stage process. The stages in this process are business, pie, finance, percentage, product.

Pie Chart Ppt PowerPoint Presentation Layouts Topics
This is a pie chart ppt powerpoint presentation layouts topics. This is a three stage process. The stages in this process are pie, process, percentage, finance, business.
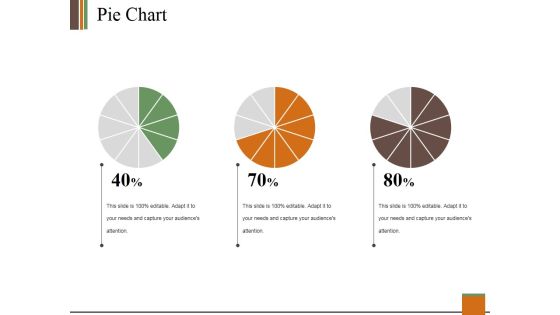
Pie Chart Ppt PowerPoint Presentation Summary Infographics
This is a pie chart ppt powerpoint presentation summary infographics. This is a three stage process. The stages in this process are pie, process, percentage, finance, business.
Pie Chart Ppt PowerPoint Presentation Outline Icon
This is a pie chart ppt powerpoint presentation outline icon. This is a four stage process. The stages in this process are pie, process, percentage, finance, business.
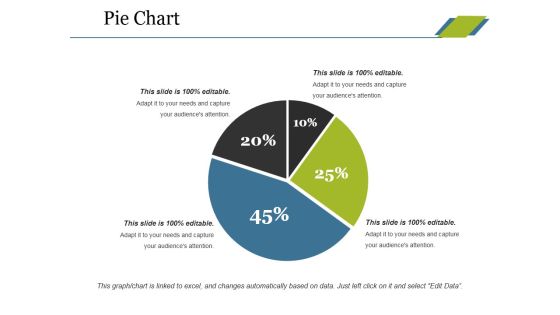
Pie Chart Ppt PowerPoint Presentation Layouts Gridlines
This is a pie chart ppt powerpoint presentation layouts gridlines. This is a four stage process. The stages in this process are pie, process, percentage, finance, business.
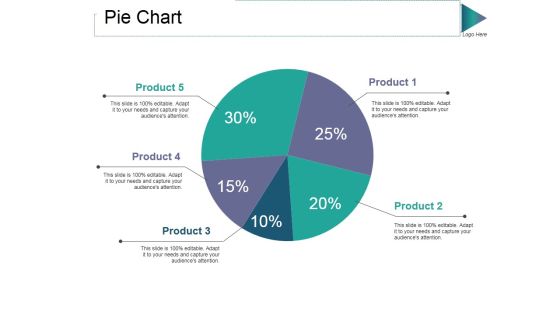
Pie Chart Ppt PowerPoint Presentation Model Grid
This is a pie chart ppt powerpoint presentation model grid. This is a five stage process. The stages in this process are product, pie, process, percentage, finance.
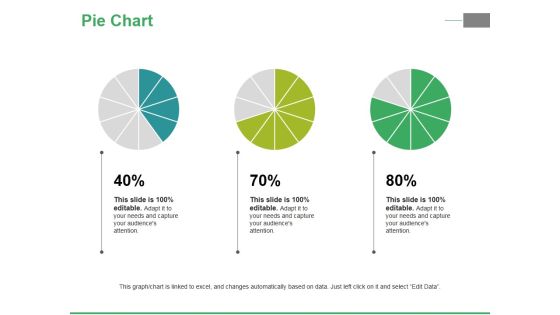
Pie Chart Ppt PowerPoint Presentation Ideas Inspiration
This is a pie chart ppt powerpoint presentation ideas inspiration. This is a three stage process. The stages in this process are pie, process, percentage, finance, business.
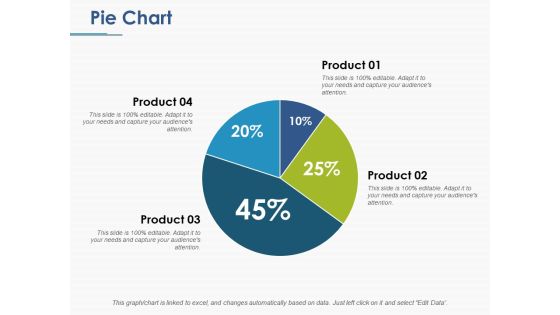
Pie Chart Ppt PowerPoint Presentation File Background
This is a pie chart ppt powerpoint presentation file background. This is a four stage process. The stages in this process are pie, process, percentage, finance, business.
Pie Chart Ppt PowerPoint Presentation Icon Outline
This is a pie chart ppt powerpoint presentation icon outline. This is a four stage process. The stages in this process are pie, process, percentage, product, business.

Pie Chart Ppt PowerPoint Presentation Ideas Deck
This is a pie chart ppt powerpoint presentation ideas deck. This is a four stage process. The stages in this process are pie, process, percentage, finance, business.

Pie Chart Ppt PowerPoint Presentation Design Templates
This is a pie chart ppt powerpoint presentation design templates. This is a two stage process. The stages in this process are pie chart, finance, business, marketing, percentage.
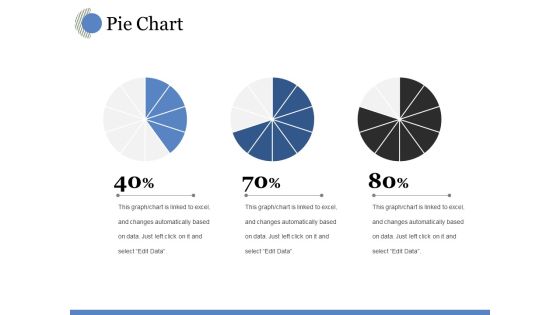
Pie Chart Ppt PowerPoint Presentation Professional Graphics
This is a pie chart ppt powerpoint presentation professional graphics. This is a three stage process. The stages in this process are chart, percentage, business, marketing, strategy.

Pie Chart Ppt PowerPoint Presentation Layouts Shapes
This is a pie chart ppt powerpoint presentation layouts shapes. This is a four stage process. The stages in this process are pie, finance, percentage, business, marketing.
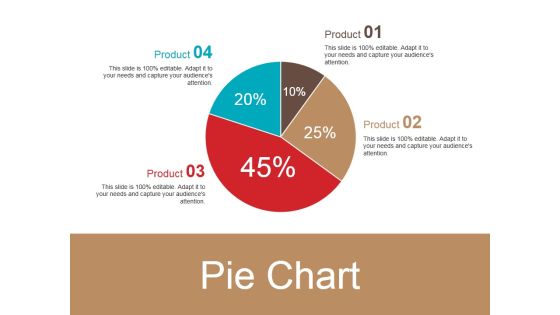
Pie Chart Ppt PowerPoint Presentation Ideas Slideshow
This is a pie chart ppt powerpoint presentation ideas slideshow. This is a four stage process. The stages in this process are pie, process, percentage, finance, business.

Pie Chart Ppt PowerPoint Presentation Model Smartart
This is a pie chart ppt powerpoint presentation model smartart. This is a five stage process. The stages in this process are management, marketing, business, percentage, product.

Pie Chart Ppt PowerPoint Presentation Layouts Elements
This is a pie chart ppt powerpoint presentation layouts elements. This is a four stage process. The stages in this process are product, business, marketing, percentage, growth.
Operating Expenses Analysis Pie Chart Ppt Icon
This is a operating expenses analysis pie chart ppt icon. This is a seven stage process. The stages in this process are finance, success, business, marketing, percentage.
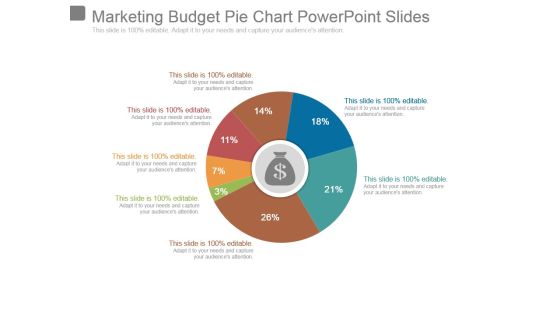
Marketing Budget Pie Chart Powerpoint Slides
This is a marketing budget pie chart powerpoint slides. This is a seven stage process. The stages in this process are business, marketing, strategy, finance, percentage.
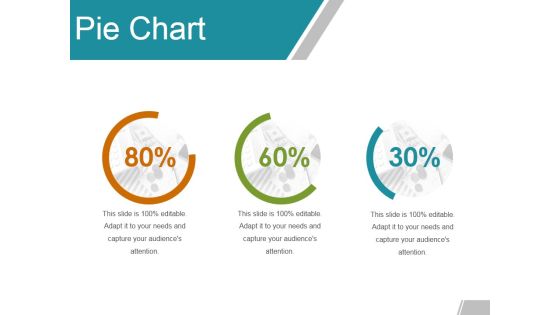
Pie Chart Ppt PowerPoint Presentation Summary Slide
This is a pie chart ppt powerpoint presentation summary slide. This is a three stage process. The stages in this process are percentage, finance, marketing, business.

Pie Chart Ppt PowerPoint Presentation Inspiration Summary
This is a pie chart ppt powerpoint presentation inspiration summary. This is a five stage process. The stages in this process are product, donut, business, percentage, marketing.
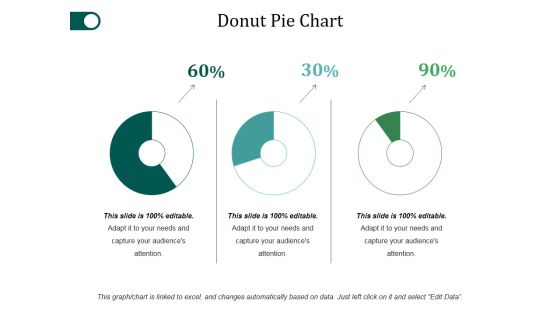
Donut Pie Chart Ppt PowerPoint Presentation Examples
This is a donut pie chart ppt powerpoint presentation examples. This is a three stage process. The stages in this process are percentage, finance, donut, business.

Pie Chart Ppt PowerPoint Presentation Infographic Template Topics
This is a pie chart ppt powerpoint presentation infographic template topics. This is a three stage process. The stages in this process are percentage, management, marketing, business.

Donut Pie Chart Ppt PowerPoint Presentation Outline Structure
This is a donut pie chart ppt powerpoint presentation outline structure. This is a four stage process. The stages in this process are percentage, finance, donut, business, marketing.
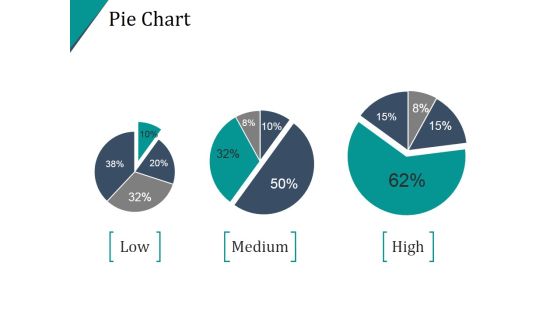
Pie Chart Template Ppt PowerPoint Presentation Example 2015
This is a pie chart template ppt powerpoint presentation example 2015. This is a four stage process. The stages in this process are pie, division, percentage, finance, analysis.
Pie Chart Ppt PowerPoint Presentation Icon Graphics Download
This is a pie chart ppt powerpoint presentation icon graphics download. This is a four stage process. The stages in this process are pie, finance, analysis, marketing, percentage.

Pie Chart Ppt PowerPoint Presentation Professional Graphic Images
This is a pie chart ppt powerpoint presentation professional graphic images. This is a four stage process. The stages in this process are product, percentage, pie, finance, business.
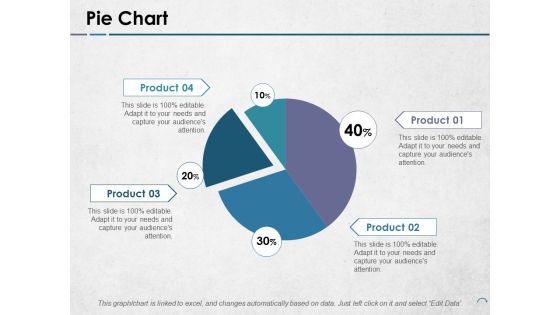
Pie Chart Ppt PowerPoint Presentation Infographics Example Topics
This is a pie chart ppt powerpoint presentation infographics example topics. This is a four stage process. The stages in this process are product, pie, process, percentage, finance.
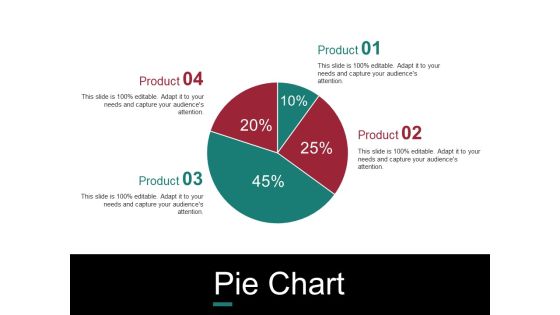
Pie Chart Ppt PowerPoint Presentation Outline Example Topics
This is a pie chart ppt powerpoint presentation outline example topics. This is a four stage process. The stages in this process are chart, process, business, percentage.

Pie Chart For Result Analysis Ppt Example File
This is a pie chart for result analysis ppt example file. This is a seven stage process. The stages in this process are pie, marketing, strategy, finance, percentage.
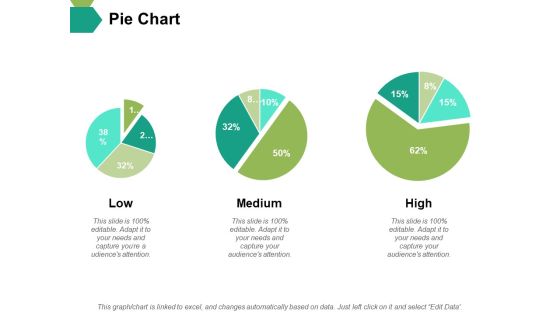
Pie Chart Ppt PowerPoint Presentation Slides Master Slide
This is a pie chart ppt powerpoint presentation slides master slide. This is a three stage process. The stages in this process are pie, process, percentage, finance, business.
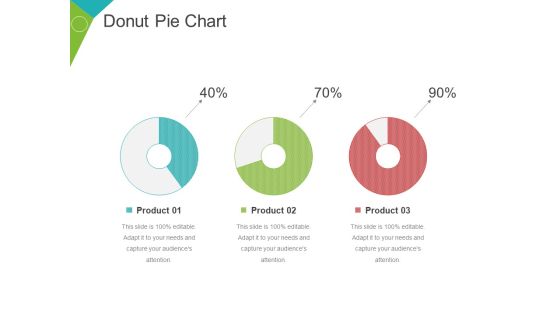
Donut Pie Chart Ppt PowerPoint Presentation Inspiration Guidelines
This is a donut pie chart ppt powerpoint presentation inspiration guidelines. This is a three stage process. The stages in this process are finance, percentage, business, marketing, management.
Pie Chart Ppt PowerPoint Presentation Icon Infographic Template
This is a pie chart ppt powerpoint presentation icon infographic template. This is a three stage process. The stages in this process are percentage, product, management, business.

Donut Pie Chart Ppt PowerPoint Presentation Inspiration Elements
This is a donut pie chart ppt powerpoint presentation inspiration elements. This is a three stage process. The stages in this process are percentage, product, business, management, marketing.
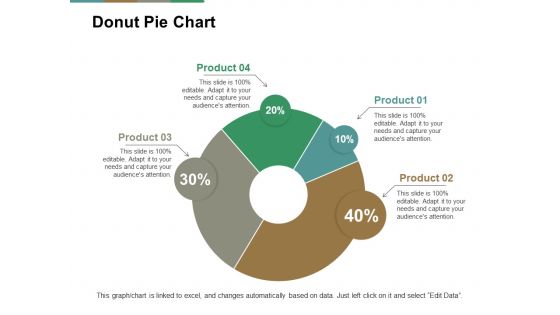
Donut Pie Chart Ppt PowerPoint Presentation Pictures Summary
This is a donut pie chart ppt powerpoint presentation pictures summary. This is a four stage process. The stages in this process are percentage, product, business, management, marketing.
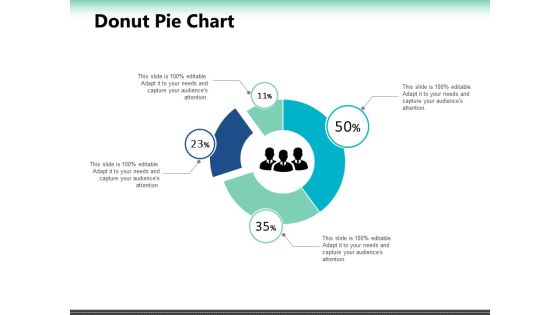
Donut Pie Chart Ppt PowerPoint Presentation Outline Deck
This is a donut pie chart ppt powerpoint presentation outline deck. This is a four stage process. The stages in this process are finance, business, marketing, management, percentage.
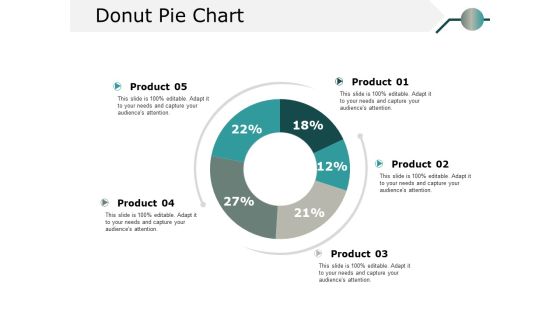
Donut Pie Chart Ppt PowerPoint Presentation Model Information
This is a donut pie chart ppt powerpoint presentation model information. This is a five stage process. The stages in this process are percentage, product, business.

Donut Pie Chart Ppt PowerPoint Presentation Portfolio Vector
This is a donut pie chart ppt powerpoint presentation portfolio vector. This is a four stage process. The stages in this process are percentage, finance, donut, business.
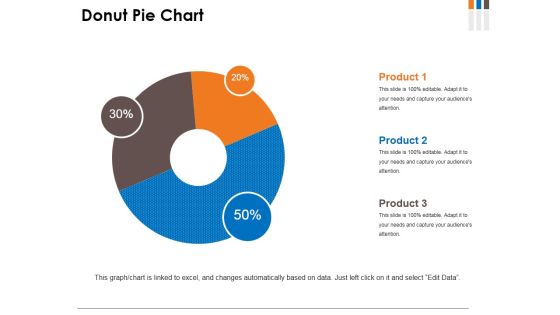
Donut Pie Chart Ppt PowerPoint Presentation Infographics Model
This is a donut pie chart ppt powerpoint presentation infographics model. This is a three stage process. The stages in this process are donut, business, marketing, percentage, finance.

Donut Pie Chart Ppt PowerPoint Presentation Professional Influencers
This is a donut pie chart ppt powerpoint presentation professional influencers. This is a five stage process. The stages in this process are product, percentage, finance, donut, business.
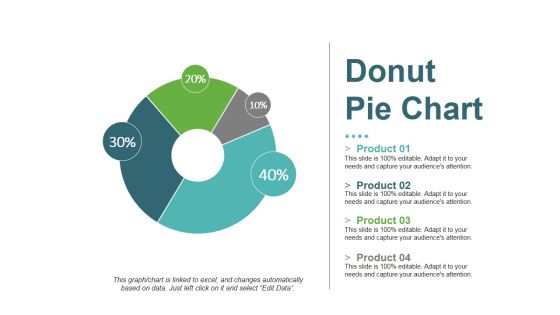
Donut Pie Chart Ppt PowerPoint Presentation Portfolio Sample
This is a donut pie chart ppt powerpoint presentation portfolio sample. This is a four stage process. The stages in this process are product, donut, percentage, finance, process.

Donut Pie Chart Ppt PowerPoint Presentation Layouts Visuals
This is a donut pie chart ppt powerpoint presentation layouts visuals. This is a five stage process. The stages in this process are product, donut, percentage, finance, business.

 Home
Home