AI PPT Maker
Templates
PPT Bundles
Design Services
Business PPTs
Business Plan
Management
Strategy
Introduction PPT
Roadmap
Self Introduction
Timelines
Process
Marketing
Agenda
Technology
Medical
Startup Business Plan
Cyber Security
Dashboards
SWOT
Proposals
Education
Pitch Deck
Digital Marketing
KPIs
Project Management
Product Management
Artificial Intelligence
Target Market
Communication
Supply Chain
Google Slides
Research Services
 One Pagers
All Categories
-
Home
- Customer Favorites
- Organizational Chart
Organizational Chart

Customizable Circle Charts Showing Revenue From US Region Themes PDF
Pitch your topic with ease and precision using this Customizable Circle Charts Showing Revenue From US Region Themes PDF This layout presents information on Customizable Circle, Charts Showing, Revenue Region It is also available for immediate download and adjustment. So, changes can be made in the color, design, graphics or any other component to create a unique layout.

Business Circular Charts PowerPoint Templates Leadership Gears Process Ppt Slides
Business Circular Charts PowerPoint Templates Leadership Gears Process PPT Slides-This PowerPoint Template shows Leadership Gears Process Chart.You can easily edit the size, position, text and color.-Business Circular Charts PowerPoint Templates Leadership Gears Process PPT Slides-This template can be used for presentations relating to 3d, Business, Circle, Circular, Clockwork, Cogs, Cogwheel, Colorful, Colors, Community, Component, Concept, Cooperate, Cooperation, Cycle, Cyclical, Different, Diverse, Diversity, Gear, Geometric, Hi-Tech, Idea, Industrial, Industry, Machine, Machinery, Mechanical, Mechanics, Round, Process,Progress

Business Circle Charts PowerPoint Templates Success Gears Process Ppt Slides
Business Circle Charts PowerPoint Templates Success Gears Process PPT Slides-This Gears Process diagram is used to show interlocking ideas. Use this diagram to lay out your strategic plans, key growth areas.-Business Circle Charts PowerPoint Templates Success Gears Process PPT Slides-This template can be used for presentations relating to 3d, Business, Circle, Circular, Clockwork, Cogs, Cogwheel, Colorful, Colors, Community, Component, Concept, Cooperate, Cooperation, Cycle, Cyclical, Different, Diverse, Diversity, Gear, Geometric, Hi-Tech, Idea, Industrial, Industry, Machine, Machinery, Mechanical, Mechanics, Round, Process,Progress
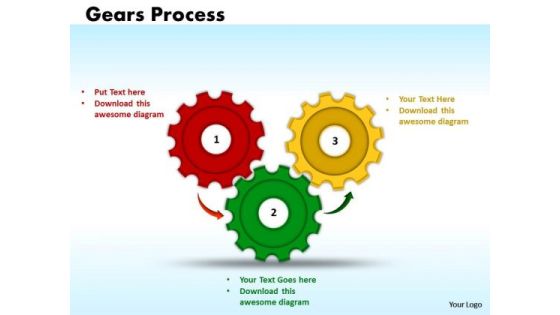
Business Circle Charts PowerPoint Templates Marketing Gears Process Ppt Slides
Business Circle Charts PowerPoint Templates Marketing Gears Process PPT Slides-Effective Marketing is Essential if You Want Your Business to Get Noticed. So explain you marketing plan with this wonderful diagram-Business Circle Charts PowerPoint Templates Marketing Gears Process PPT Slides-This template can be used for presentations relating to 3d, Business, Circle, Circular, Clockwork, Cogs, Cogwheel, Colorful, Colors, Community, Component, Concept, Cooperate, Cooperation, Cycle, Cyclical, Different, Diverse, Diversity, Gear, Geometric, Hi-Tech, Idea, Industrial, Industry, Machine, Machinery, Mechanical, Mechanics, Round, Process,Progress
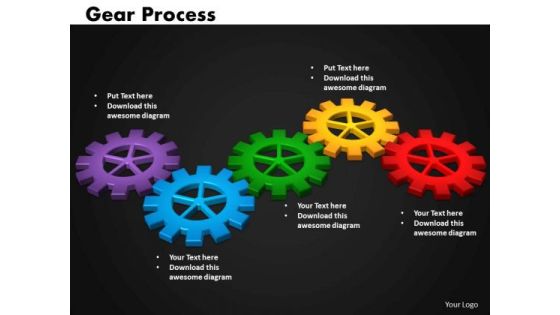
Business Circular Charts PowerPoint Templates Marketing Gears Process Ppt Slides
Business Circular Charts PowerPoint Templates Marketing Gears Process PPT Slides-Effective Marketing is Essential if You Want Your Business to Get Noticed. So explain you marketing plan with this wonderful diagram-Business Circular Charts PowerPoint Templates Marketing Gears Process PPT Slides-This template can be used for presentations relating to 3d, Business, Circle, Circular, Clockwork, Cogs, Cogwheel, Colorful, Colors, Community, Component, Concept, Cooperate, Cooperation, Cycle, Cyclical, Different, Diverse, Diversity, Gear, Geometric, Hi-Tech, Idea, Industrial, Industry, Machine, Machinery, Mechanical, Mechanics, Round, Process,Progress

Business Cycle Charts PowerPoint Templates Marketing Gears Process Ppt Slides
Business Cycle Charts PowerPoint Templates Marketing Gears Process PPT Slides-Effective Marketing is Essential if You Want Your Business to Get Noticed. So explain you marketing plan with this wonderful diagram-Business Cycle Charts PowerPoint Templates Marketing Gears Process PPT Slides-This template can be used for presentations relating to 3d, Business, Circle, Circular, Clockwork, Cogs, Cogwheel, Colorful, Colors, Community, Component, Concept, Cooperate, Cooperation, Cycle, Cyclical, Different, Diverse, Diversity, Gear, Geometric, Hi-Tech, Idea, Industrial, Industry, Machine, Machinery, Mechanical, Mechanics, Round, Process,Progress

Business Circle Charts PowerPoint Templates Business Gears Process Ppt Slides
Business Circle Charts PowerPoint Templates Business Gears Process PPT Slides-This PowerPoint diagram shows gears aligned and working together. Can represent processing or teamwork-Business Circle Charts PowerPoint Templates Business Gears Process PPT Slides-This template can be used for presentations relating to 3d, Business, Circle, Circular, Clockwork, Cogs, Cogwheel, Colorful, Colors, Community, Component, Concept, Cooperate, Cooperation, Cycle, Cyclical, Different, Diverse, Diversity, Gear, Geometric, Hi-Tech, Idea, Industrial, Industry, Machine, Machinery, Mechanical, Mechanics, Round, Process,Progress

Business Circle Charts PowerPoint Templates Leadership Gears Process Ppt Slides
Business Circle Charts PowerPoint Templates Leadership Gears Process PPT Slides-This PowerPoint diagram shows gears aligned and working together. Can represent processing or teamwork-Business Circle Charts PowerPoint Templates Leadership Gears Process PPT Slides-This template can be used for presentations relating to 3d, Business, Circle, Circular, Clockwork, Cogs, Cogwheel, Colorful, Colors, Community, Component, Concept, Cooperate, Cooperation, Cycle, Cyclical, Different, Diverse, Diversity, Gear, Geometric, Hi-Tech, Idea, Industrial, Industry, Machine, Machinery, Mechanical, Mechanics, Round, Process,Progress
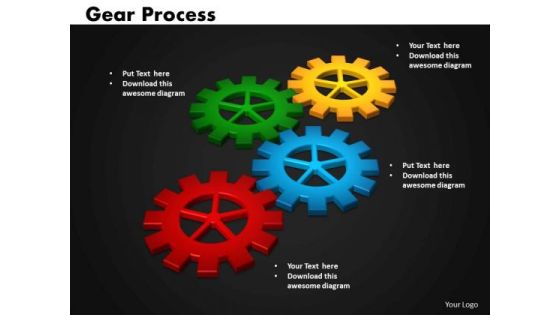
Business Circle Charts PowerPoint Templates Teamwork Gears Process Ppt Slides
Business Circle Charts PowerPoint Templates Teamwork Gears Process PPT Slides-This PowerPoint diagram slide shows gears aligned and working together. Can represent processing or teamwork-Business Circle Charts PowerPoint Templates Teamwork Gears Process PPT Slides-This template can be used for presentations relating to 3d, Business, Circle, Circular, Clockwork, Cogs, Cogwheel, Colorful, Colors, Community, Component, Concept, Cooperate, Cooperation, Cycle, Cyclical, Different, Diverse, Diversity, Gear, Geometric, Hi-Tech, Idea, Industrial, Industry, Machine, Machinery, Mechanical, Mechanics, Round, Process,Progress

Business Circular Charts PowerPoint Templates Business Gears Process Ppt Slides
Business Circular Charts PowerPoint Templates Business Gears Process PPT Slides-Develop ideas from this diagram and you can also map and Outline Views.-Business Circular Charts PowerPoint Templates Business Gears Process PPT Slides-This template can be used for presentations relating to 3d, Business, Circle, Circular, Clockwork, Cogs, Cogwheel, Colorful, Colors, Community, Component, Concept, Cooperate, Cooperation, Cycle, Cyclical, Different, Diverse, Diversity, Gear, Geometric, Hi-Tech, Idea, Industrial, Industry, Machine, Machinery, Mechanical, Mechanics, Round, Process,Progress
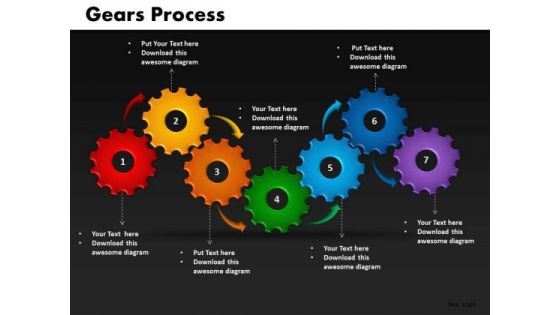
Business Circular Charts PowerPoint Templates Teamworks Gears Process Ppt Slides
Business Circular Charts PowerPoint Templates Teamworks Gears Process PPT Slides-This PowerPoint diagram slide shows gears aligned and working together. Can represent processing or teamwork-Business Circular Charts PowerPoint Templates Teamworks Gears Process PPT Slides-This template can be used for presentations relating to 3d, Business, Circle, Circular, Clockwork, Cogs, Cogwheel, Colorful, Colors, Community, Component, Concept, Cooperate, Cooperation, Cycle, Cyclical, Different, Diverse, Diversity, Gear, Geometric, Hi-Tech, Idea, Industrial, Industry, Machine, Machinery, Mechanical, Mechanics, Round, Process,Progress
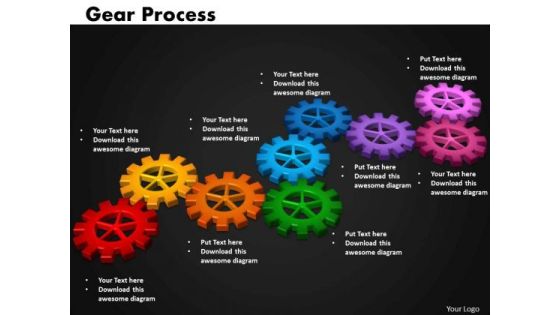
Business Circular Charts PowerPoint Templates Growth Gears Process Ppt Slides
Business Circular Charts PowerPoint Templates Growth Gears Process PPT Slides-Geared devices can change the speed, and direction of a power source. Use this graphic to explain sustainability objectives.-Business Circular Charts PowerPoint Templates Growth Gears Process PPT Slides-This template can be used for presentations relating to 3d, Business, Circle, Circular, Clockwork, Cogs, Cogwheel, Colorful, Colors, Community, Component, Concept, Cooperate, Cooperation, Cycle, Cyclical, Different, Diverse, Diversity, Gear, Geometric, Hi-Tech, Idea, Industrial, Industry, Machine, Machinery, Mechanical, Mechanics, Round, Process,Progress

Business Circular Charts PowerPoint Templates Success Gears Process Ppt Slides
Business Circular Charts PowerPoint Templates Success Gears Process PPT Slides-Use this graphics for most important events during the event identification and analysis stage. -Business Circular Charts PowerPoint Templates Success Gears Process PPT Slides-This template can be used for presentations relating to 3d, Business, Circle, Circular, Clockwork, Cogs, Cogwheel, Colorful, Colors, Community, Component, Concept, Cooperate, Cooperation, Cycle, Cyclical, Different, Diverse, Diversity, Gear, Geometric, Hi-Tech, Idea, Industrial, Industry, Machine, Machinery, Mechanical, Mechanics, Round, Process,Progress
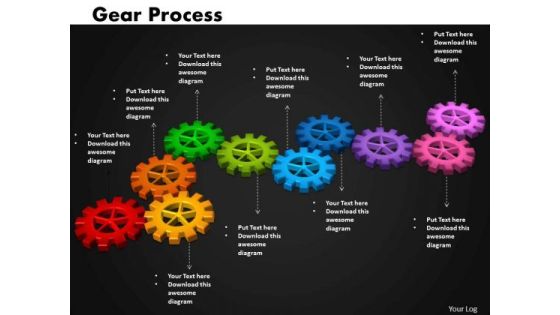
Business Cycle Charts PowerPoint Templates Business Gears Process Ppt Slides
Business Cycle Charts PowerPoint Templates Business Gears Process PPT Slides-Graphic gears Process is a mechanism or group of parts performing one function or serving one purpose in a complex situation-Business Cycle Charts PowerPoint Templates Business Gears Process PPT Slides-This template can be used for presentations relating to 3d, Business, Circle, Circular, Clockwork, Cogs, Cogwheel, Colorful, Colors, Community, Component, Concept, Cooperate, Cooperation, Cycle, Cyclical, Different, Diverse, Diversity, Gear, Geometric, Hi-Tech, Idea, Industrial, Industry, Machine, Machinery, Mechanical, Mechanics, Round, Process,Progress

Business Cycle Charts PowerPoint Templates Growth Gears Process Ppt Slides
Business Cycle Charts PowerPoint Templates Growth Gears Process PPT Slides-Geared devices can change the speed, and direction of a power source. Use this graphic to explain sustainability objectives.-Business Cycle Charts PowerPoint Templates Growth Gears Process PPT Slides-This template can be used for presentations relating to 3d, Business, Circle, Circular, Clockwork, Cogs, Cogwheel, Colorful, Colors, Community, Component, Concept, Cooperate, Cooperation, Cycle, Cyclical, Different, Diverse, Diversity, Gear, Geometric, Hi-Tech, Idea, Industrial, Industry, Machine, Machinery, Mechanical, Mechanics, Round, Process,Progress
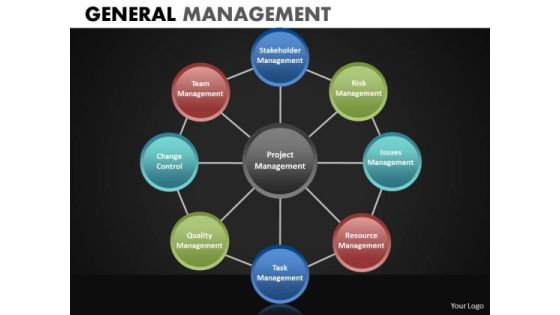
Wheel Diagrams PowerPoint Templates And Wheel Process Charts Ppt Slides
Wheel Diagrams PowerPoint Templates and Wheel Process Charts PPT Slides-These high quality powerpoint pre-designed slides and powerpoint templates have been carefully created by our professional team to help you impress your audience. All slides have been created and are 100% editable in powerpoint. Each and every property of any graphic - color, size, orientation, shading, outline etc. can be modified to help you build an effective powerpoint presentation. Any text can be entered at any point in the powerpoint template or slide. Simply DOWNLOAD, TYPE and PRESENT!-These PowerPoint presentation slides can be used to represent concepts relating to--Abstract, action, analysis, blank, business, chart, clipart, commerce, concept, conceptual, design, diagram, direction, flow, generic, goals, guide, guidelines, heirarchy, icon, idea, illustration, lingakes, links, manage, management, mba, model, organization, performance, plan, process, project, relationship, representation, resource, steps, strategy, success, tactics, theoretical, theory, tool, workflow-Wheel Diagrams PowerPoint Templates and Wheel Process Charts PPT Slides

Customizable Circle Charts For Strategic Planning Process Clipart PDF
Pitch your topic with ease and precision using this Customizable Circle Charts For Strategic Planning Process Clipart PDF This layout presents information on Vision Statement, Mission Statement, Monitor Progress It is also available for immediate download and adjustment. So, changes can be made in the color, design, graphics or any other component to create a unique layout.
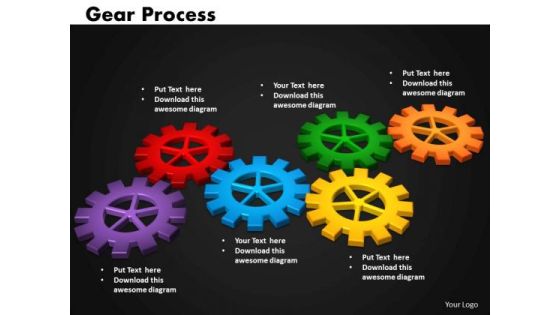
Business Circular Charts PowerPoint Templates Process Gears Process Ppt Slides
Business Circular Charts PowerPoint Templates Process Gears Process PPT Slides-Highlight the key components of your entire manufacturing/ business process. Illustrate how each element flows seamlessly onto the next stage. Emphasise on any critical or key factors within them. Demonstrate how they all combine to form the final product.-Business Circular Charts PowerPoint Templates Process Gears Process PPT Slides-This template can be used for presentations relating to 3d, Business, Circle, Circular, Clockwork, Cogs, Cogwheel, Colorful, Colors, Community, Component, Concept, Cooperate, Cooperation, Cycle, Cyclical, Different, Diverse, Diversity, Gear, Geometric, Hi-Tech, Idea, Industrial, Industry, Machine, Machinery, Mechanical, Mechanics, Round, Process,Progress
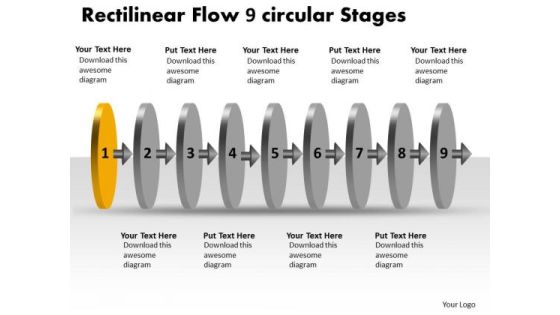
Rectilinear Flow 9 Circular Stages Free Charts PowerPoint Slides
We present our rectilinear flow 9 circular stages free charts PowerPoint Slides.Use our Circle Charts PowerPoint Templates because,The concept and strategy is your strength. Use our Arrows PowerPoint Templates because,You have the moves to sway the market. Use our Design PowerPoint Templates because,You are aware of some pitfalls ahead where you need to be cautious not to overrun and avoid a stall. Use our Shapes PowerPoint Templates because,They have fired the dreams of many fertile minds. Use our Process and Flows PowerPoint Templates because,Individual components well researched and understood in their place.Use these PowerPoint slides for presentations relating to abstract, arrow, blank, business, chart, circular, circulation, concept, conceptual, design, diagram, executive, flow, icon, idea, illustration, linear, management, model, numbers, organization, procedure, process, progression, resource, sequence, sequential, stages, steps, strategy. The prominent colors used in the PowerPoint template are Green, Gray, Black
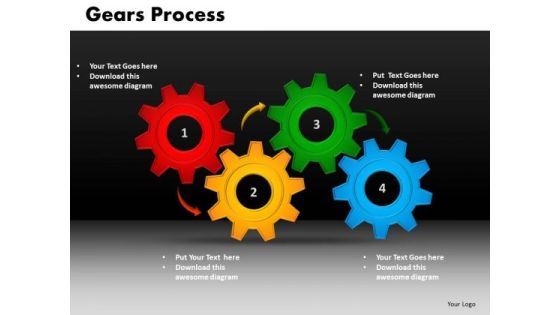
Business Circle Charts PowerPoint Templates Strategy Gears Process Ppt Slides
Business Circle Charts PowerPoint Templates Strategy Gears Process PPT Slides-Development Strategy should primarily be seen as a process.. Illustrate your ideas with this diagram and demonstrate how each factor is important to prove how they mesh to motivate the company team and provide the steam to activate the composite machine-Business Circle Charts PowerPoint Templates Strategy Gears Process PPT Slides-This template can be used for presentations relating to 3d, Business, Circle, Circular, Clockwork, Cogs, Cogwheel, Colorful, Colors, Community, Component, Concept, Cooperate, Cooperation, Cycle, Cyclical, Different, Diverse, Diversity, Gear, Geometric, Hi-Tech, Idea, Industrial, Industry, Machine, Machinery, Mechanical, Mechanics, Round, Process,Progress

Business Circular Charts PowerPoint Templates Strategy Gears Process Ppt Slides
Business Circular Charts PowerPoint Templates Strategy Gears Process PPT Slides-Development Strategy should primarily be seen as a process.. Illustrate your ideas with this diagram and demonstrate how each factor is important to prove how they mesh to motivate the company team and provide the steam to activate the composite machi-Business Circular Charts PowerPoint Templates Strategy Gears Process PPT Slides-This template can be used for presentations relating to 3d, Business, Circle, Circular, Clockwork, Cogs, Cogwheel, Colorful, Colors, Community, Component, Concept, Cooperate, Cooperation, Cycle, Cyclical, Different, Diverse, Diversity, Gear, Geometric, Hi-Tech, Idea, Industrial, Industry, Machine, Machinery, Mechanical, Mechanics, Round, Process,Progress
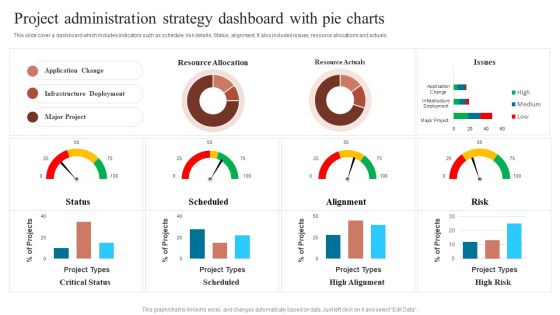
Project Administration Strategy Dashboard With Pie Charts Sample PDF
This slide cover a dashboard which includes indicators such as schedule, risk details, Status, alignment. It also includes issues, resource allocations and actuals. Pitch your topic with ease and precision using this Project Administration Strategy Dashboard With Pie Charts Sample PDF. This layout presents information on Communication Goal, Communication Tool, Increase Revenue. It is also available for immediate download and adjustment. So, changes can be made in the color, design, graphics or any other component to create a unique layout.
Maintenance Software Dashboard With Charts Ppt Icon Slide Download PDF
This slide shows the dashboard of maintenance software which covers tasks per subsystem, highest maintenance time, task count, mean time to repair per level with motherboard, camera, propeller assembly, ground controller, motor , etc. Pitch your topic with ease and precision using this Maintenance Software Dashboard With Charts Ppt Icon Slide Download PDF. This layout presents information on 10 Highest Mean, Time To Repair, 10 Highest Task, Task Per Subsystem, 10 Highest Maintenance. It is also available for immediate download and adjustment. So, changes can be made in the color, design, graphics or any other component to create a unique layout.
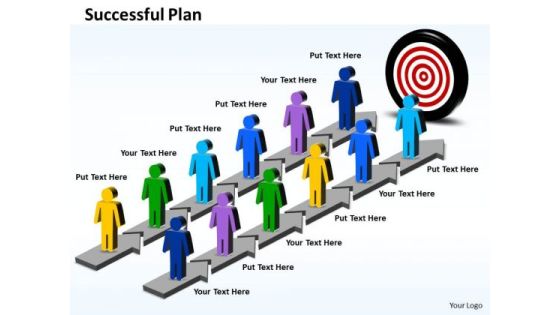
Business Charts PowerPoint Templates Parallel Steps For Successful Plan
Business Charts PowerPoint templates parallel steps for successful plan-This PowerPoint Diagram consists of the two parallel steps to reach the goal that is board. It portrays practice, procedure, proceeding, progress, progression, red tape, routine, rule, stage, step, suit, system, technique, transaction, trial, unfolding, way, wise, working.-Business Charts PowerPoint templates parallel steps for successful plan

Business Charts PowerPoint Templates Parallel Steps To Plan
Business Charts PowerPoint templates parallel steps to plan-This PowerPoint Diagram consists of the two parallel steps which further consist of five stages to reach the goal. It portrays practice, procedure, progression, routine, rule, stage, step, system, technique, way, working. This Graphical representation will help you to make your Presentation more interesting and easy to understand.-Business Charts PowerPoint templates parallel steps to plan

Business Charts PowerPoint Templates Parallel Steps Plan For Planning
Business Charts PowerPoint templates parallel steps plan for planning-This Business PowerPoint Diagram Shows the Parallel steps which individually consists of four stages to achieve the goal. Use this graphic design to represent a continuing sequence of stages, tasks, or events and emphasize the connection between all components.-Business Charts PowerPoint templates parallel steps plan for planning

Charts For Portfolio Evaluation Techniques Example Ppt Presentation
This is a charts for portfolio evaluation techniques example ppt presentation. This is a five stage process. The stages in this process are peso govt debt securities, foreign govt debt securities, peso corporate debt securities, dollar corporate debt securities, equity.

Business Charts PowerPoint Templates Parallel Key Steps Plan
Business Charts PowerPoint templates parallel key steps plan-This Business PowerPoint Diagram Shows the Parallel steps which consists of five stages to achieve the goal. Use this graphic design to represent a continuing sequence of stages, tasks, or events and emphasize the connection between all components.-Business Charts PowerPoint templates parallel key steps plan
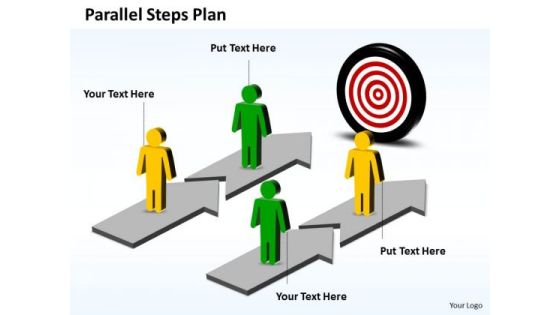
Business Charts PowerPoint Templates Parallel Steps Plan Towards Goal
Business Charts PowerPoint templates parallel steps plan towards goal-Use this Parallel Process with two steps in each process to represent a continuing sequence of stages, tasks, or events in a circular flow and emphasize the connection between all components. This Diagram will definitely make your Presentation more attractive and interesting.-Business Charts PowerPoint templates parallel steps plan towards goal
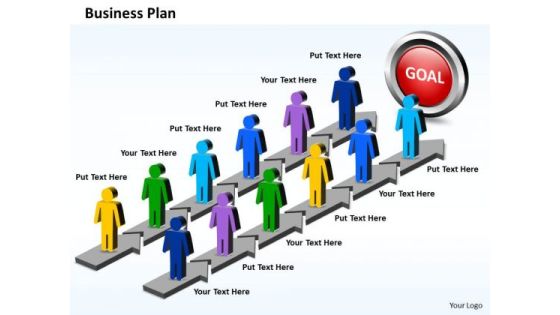
Business Charts PowerPoint Templates Parallel Steps Plan For Achieving Results
Business Charts PowerPoint templates parallel steps plan for achieving results-Use this Parallel Process with six steps in each process to represent a continuing sequence of stages, tasks, or events in a circular flow and emphasize the connection between all components. You can change color, size and orientation of any icon to your liking.-Business Charts PowerPoint templates parallel steps plan for achieving results
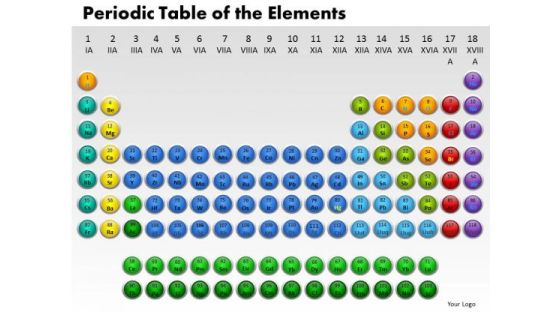
Business Circle Charts PowerPoint Templates Business Periodic Table Ppt Slides
Business Circle Charts PowerPoint Templates Business periodic table PPT Slides-Use this graphics to represent a continuing sequence of stages, tasks, or events in a circular flow and emphasize the connection between all components. -Business Circle Charts PowerPoint Templates Business periodic table PPT Slides-This template can be used for presentations relating to Actinoids, Atom, Atomic, Chemistry, Electrons, Element, Helium, Hydrogen, Lanthanoids, Liquid, Molecule, Noble, Periodic, Physics, Plutonium, Quantum, Radium, Science, Scientific, Solid, Symbol, Table
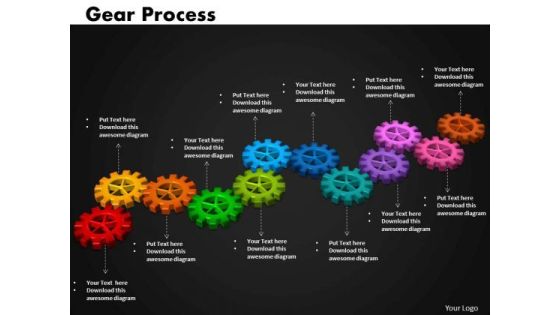
Business Cycle Charts PowerPoint Templates Success Gears Process Ppt Slides
Business Cycle Charts PowerPoint Templates Success Gears Process PPT Slides-Use this graphics for most important events during the event identification and analysis stage.-Business Cycle Charts PowerPoint Templates Success Gears Process PPT Slides-This template can be used for presentations relating to 3d, Business, Circle, Circular, Clockwork, Cogs, Cogwheel, Colorful, Colors, Community, Component, Concept, Cooperate, Cooperation, Cycle, Cyclical, Different, Diverse, Diversity, Gear, Geometric, Hi-Tech, Idea, Industrial, Industry, Machine, Machinery, Mechanical, Mechanics, Round, Process,Progress

3d Arrows Depicting 8 Concepts Create Flow Charts PowerPoint Templates
We present our 3d arrows depicting 8 concepts create flow charts PowerPoint templates. Use our Marketing PowerPoint Templates because, Individual components well researched and understood in their place. Use our Business PowerPoint Templates because, are the triggers of our growth. Use our Shapes PowerPoint Templates because; educate your staff on the means to provide the required support for speedy recovery. Use our Process and Flows PowerPoint Templates because, Timelines Template:- Getting it done may not be enough. Use our Arrows PowerPoint Templates because, Brainstorming Light Bulbs: - The atmosphere in the workplace is electric. Use these PowerPoint slides for presentations relating to Arrows, business, career, cartoon, center, challenge, change, choice, concept, confusion, crossroads, decide, deciding, decision, directions, figure, idea, man, many, opportunity, paths, person, problem, question, risk, strategic, strategize, strategy, uncertain. The prominent colors used in the PowerPoint template are Green, Black, and Gray

Hands Emphasizing 7 Stages Process Sample Flow Charts PowerPoint Templates
We present our hands emphasizing 7 stages process sample flow charts PowerPoint templates. Use our Advertising PowerPoint Templates because, creating a winner is your passion and dream. Use our Shapes PowerPoint Templates because, now fire the arrows to emblazon the desired path by which you will achieve anticipated results. Use our Business PowerPoint Templates because; Highlight the key components of your entire manufacturing/ business process. Use our Process and Flows PowerPoint Templates because, are the Tools of the Trade. Use our Signs PowerPoint Templates because, Start the gears of youthful minds and set them in motion. Use these PowerPoint slides for presentations relating to Alone, arranging, background, child, dirty, empty, family, handprint, hands, human, identity, illustration, isolated, messy, naked, objects, painting, palm, shape, simple, stage, stained, stamp, toe, togetherness. The prominent colors used in the PowerPoint template are Gray, White, and Blue

Working Capital Due Diligence Analytics Checklist Inspiration PDF
This slide showcases a checklist for venture capital due diligence analysis to scrutinize the primary concerns that must be examined before a venture capital investor will make an investment. It also includes checkpoints related to debt securities, credit terms, intellectual property, etc. Persuade your audience using this Working Capital Due Diligence Analytics Checklist Inspiration PDF. This PPT design covers one stages, thus making it a great tool to use. It also caters to a variety of topics including Information, Checkpoints, Organizational Chart. Download this PPT design now to present a convincing pitch that not only emphasizes the topic but also showcases your presentation skills.
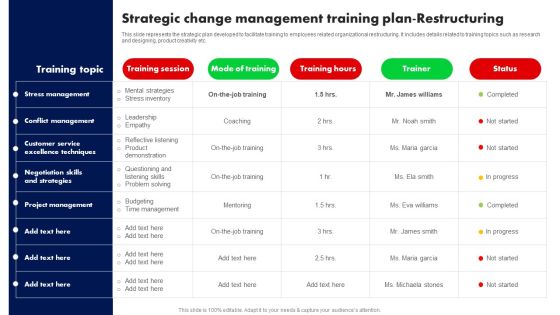
Strategic Change Management Training Plan Restructuring Ppt PowerPoint Presentation Diagram Graph Charts PDF
This slide represents the strategic plan developed to facilitate training to employees related organizational restructuring. It includes details related to training topics such as research and designing, product creativity etc. Take your projects to the next level with our ultimate collection of Strategic Change Management Training Plan Restructuring Ppt PowerPoint Presentation Diagram Graph Charts PDF. Slidegeeks has designed a range of layouts that are perfect for representing task or activity duration, keeping track of all your deadlines at a glance. Tailor these designs to your exact needs and give them a truly corporate look with your own brand colors they will make your projects stand out from the rest.
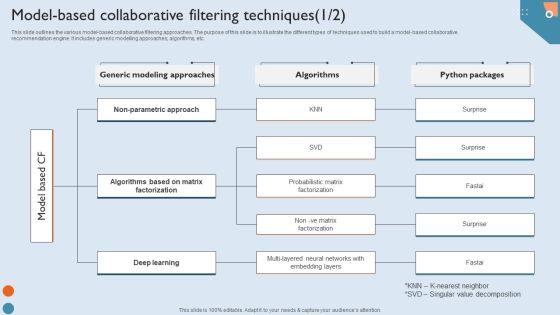
Recommendation Techniques Model Based Collaborative Filtering Techniques Demonstration PDF
This slide outlines the various model-based collaborative filtering approaches. The purpose of this slide is to illustrate the different types of techniques used to build a model-based collaborative recommendation engine. It includes generic modelling approaches, algorithms, etc. Present like a pro with Recommendation Techniques Model Based Collaborative Filtering Techniques Demonstration PDF Create beautiful presentations together with your team, using our easy-to-use presentation slides. Share your ideas in real-time and make changes on the fly by downloading our templates. So whether you are in the office, on the go, or in a remote location, you can stay in sync with your team and present your ideas with confidence. With Slidegeeks presentation got a whole lot easier. Grab these presentations today.
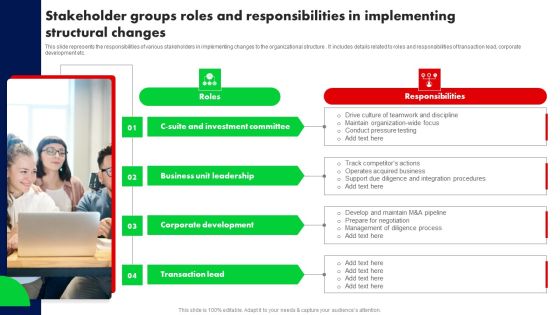
Stakeholder Groups Roles And Responsibilities In Implementing Structural Changes Ppt PowerPoint Presentation Diagram Graph Charts PDF
This slide represents the responsibilities of various stakeholders in implementing changes to the organizational structure . It includes details related to roles and responsibilities of transaction lead, corporate development etc. Retrieve professionally designed Stakeholder Groups Roles And Responsibilities In Implementing Structural Changes Ppt PowerPoint Presentation Diagram Graph Charts PDF to effectively convey your message and captivate your listeners. Save time by selecting pre made slideshows that are appropriate for various topics, from business to educational purposes. These themes come in many different styles, from creative to corporate, and all of them are easily adjustable and can be edited quickly. Access them as PowerPoint templates or as Google Slides themes. You do not have to go on a hunt for the perfect presentation because Slidegeeks got you covered from everywhere.

Data Automation Solution Investor Funding Presentation Org Structure Introduction PDF
This slide represents organizational chart of company. It comprises of key members such as CEO, Head of field operations, data strategy, marketing director, CDO, global head of business development, etc. If you are looking for a format to display your unique thoughts, then the professionally designed Data Automation Solution Investor Funding Presentation Org Structure Introduction PDF is the one for you. You can use it as a Google Slides template or a PowerPoint template. Incorporate impressive visuals, symbols, images, and other charts. Modify or reorganize the text boxes as you desire. Experiment with shade schemes and font pairings. Alter, share or cooperate with other people on your work. Download Data Automation Solution Investor Funding Presentation Org Structure Introduction PDF and find out how to give a successful presentation. Present a perfect display to your team and make your presentation unforgettable.

Talent Retention Initiatives For New Hire Onboarding Strategies For Introducing New Hires Topics PDF
This slide presents an overview why introduction to key stakeholders is important. It also includes strategies to effectively introduce new hires to stakeholders such as, schedule one-on-one meetings, use video conferencing, provide an organizational chart and encourage informal meetings. Are you searching for a Talent Retention Initiatives For New Hire Onboarding Strategies For Introducing New Hires Topics PDF that is uncluttered, straightforward, and original Its easy to edit, and you can change the colors to suit your personal or business branding. For a presentation that expresses how much effort you have put in, this template is ideal. With all of its features, including tables, diagrams, statistics, and lists, its perfect for a business plan presentation. Make your ideas more appealing with these professional slides. Download Talent Retention Initiatives For New Hire Onboarding Strategies For Introducing New Hires Topics PDF from Slidegeeks today.

Guide For Marketing Analytics To Improve Decisions Develop Marketing Analytics Team Structure Professional PDF
The following slide showcases analytics team organizational chart to ensure clarity of role and accountability. It includes elements such as statistical analyst, marketing database, campaign strategist, predictive models, quantifiable outcomes etc. Get a simple yet stunning designed Guide For Marketing Analytics To Improve Decisions Develop Marketing Analytics Team Structure Professional PDF. It is the best one to establish the tone in your meetings. It is an excellent way to make your presentations highly effective. So, download this PPT today from Slidegeeks and see the positive impacts. Our easy to edit Guide For Marketing Analytics To Improve Decisions Develop Marketing Analytics Team Structure Professional PDF can be your go to option for all upcoming conferences and meetings. So, what are you waiting for Grab this template today.

Business Circle Charts PowerPoint Templates Marketing Financial Planning Process Ppt Slides
Business Circle Charts PowerPoint Templates Marketing Financial Planning Process PPT Slides-This circle chart can be used in business, education and economic presentations to help the audience visualize the content better, or to find flaws in a financial planning process.-Business Circle Charts PowerPoint Templates Marketing Financial Planning Process PPT Slides-This template can be used for presentations relating to Abstract, Action, Business, Chart, Commerce, Competitor, Components, Concept, Conceptual, Design, Diagram, Executive, Financial, Goals, Guide, Guidelines, Hierarchy, Icon, Idea, Illustration, Manage, Management, Marketing, Mind, Mission, Model, Operations, Organization, Performance, Plan, Planning, Process

Project Communication System Data Flow Charts Ppt PowerPoint Presentation Gallery Background Images PDF
This slide displays communication system processes within the framework of a data flow charts to analyse interactions, processing, and data flow before creating the network. it includes components such as project requestor, management, vendors, current system examination and models. Presenting Project Communication System Data Flow Charts Ppt PowerPoint Presentation Gallery Background Images PDF to dispense important information. This template comprises six stages. It also presents valuable insights into the topics including Project Requestor, Management, Vendors. This is a completely customizable PowerPoint theme that can be put to use immediately. So, download it and address the topic impactfully.

Dashboard Showing Data Charts For Statistics Analysis Ppt PowerPoint Presentation Infographic Template Grid PDF
Pitch your topic with ease and precision using this dashboard showing data charts for statistics analysis ppt powerpoint presentation infographic template grid pdf. This layout presents information on dashboard showing data charts for statistics analysis. It is also available for immediate download and adjustment. So, changes can be made in the color, design, graphics or any other component to create a unique layout.
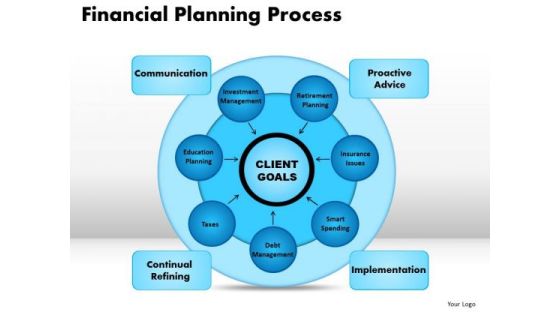
Business Circle Charts PowerPoint Templates Business Financial Planning Process Ppt Slides
Business Circle Charts PowerPoint Templates Business Financial Planning Process PPT Slides-This PowerPoint diagram shows transformations from one stage to others stage of Financial Planning Process-Business Circle Charts PowerPoint Templates Business Financial Planning Process PPT Slides-This template can be used for presentations relating to Abstract, Action, Business, Chart, Commerce, Competitor, Components, Concept, Conceptual, Design, Diagram, Executive, Financial, Goals, Guide, Guidelines, Hierarchy, Icon, Idea, Illustration, Manage, Management, Marketing, Mind, Mission, Model, Operations, Organization, Performance, Plan, Planning, Process
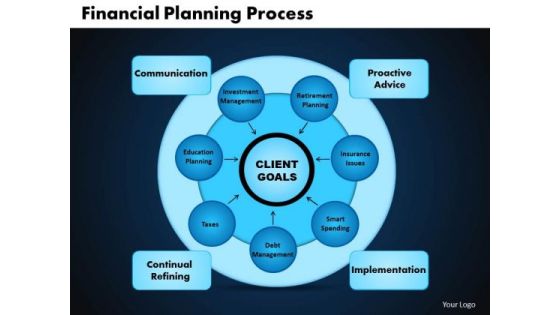
Business Circle Charts PowerPoint Templates Leadership Financial Planning Process Ppt Slides
Business Circle Charts PowerPoint Templates Leadership Financial Planning Process PPT Slides-This PowerPoint diagram shows transformations from one stage to others stage of Financial Planning Process-Business Circle Charts PowerPoint Templates Leadership Financial Planning Process PPT Slides-This template can be used for presentations relating to Abstract, Action, Business, Chart, Commerce, Competitor, Components, Concept, Conceptual, Design, Diagram, Executive, Financial, Goals, Guide, Guidelines, Hierarchy, Icon, Idea, Illustration, Manage, Management, Marketing, Mind, Mission, Model, Operations, Organization, Performance, Plan, Planning, Process

3d Diverging 11 Stages Of Single Process Ppt Charts And Diagrams PowerPoint Templates
We present our 3d diverging 11 stages of single process ppt Charts and Diagrams PowerPoint templates.Use our Circle Charts PowerPoint Templates because it is a step by step process with levels rising at every stage. Use our Arrows PowerPoint Templates because this PPt slide can educate your listeners on the relevance and importance of each one as per your plan and how they all contribute as you strive to hit the Bullseye. Download our Business PowerPoint Templates because The foundation of the structure of your business is resilient and dependable. Convey this confidence to your colleagues and assure them of a great and enduring future. Download our Shapes PowerPoint Templates because others naturally tend to follow in the path blazed by you. Present our Flow Charts PowerPoint Templates because our PowerPoint templates designed for your ideas to sell.Use these PowerPoint slides for presentations relating to advice, analysis, analyze, background, blank, business, center, central, chalk, component, concept, connection, core, counter, deploy, diagram, distribute, draw, education, element, exchange, flow, gather, industry, input, join, link, management, manager, output, people, person, plan, process, reaction, strategy, support, surround, teamwork. The prominent colors used in the PowerPoint template are Yellow, Green, Blue. Customers tell us our 3d diverging 11 stages of single process ppt Charts and Diagrams PowerPoint templates are Liberated. PowerPoint presentation experts tell us our analyze PowerPoint templates and PPT Slides are Ultra. People tell us our 3d diverging 11 stages of single process ppt Charts and Diagrams PowerPoint templates are topically designed to provide an attractive backdrop to any subject. People tell us our background PowerPoint templates and PPT Slides will help you be quick off the draw. Just enter your specific text and see your points hit home. Customers tell us our 3d diverging 11 stages of single process ppt Charts and Diagrams PowerPoint templates are Fashionable. People tell us our center PowerPoint templates and PPT Slides are Enchanting.

Business Charts PowerPoint Templates Simple 4 Stage Circular Process Editable Sales
Business Charts PowerPoint templates simple 4 stage circular process editable Sales-This PowerPoint Diagram consists of four animated Process tables of Different Colors. It can be used to symbolize four different Approaches or four distinct techniques. It consists of single color slide as well. This diagram will fit for Business Presentations.
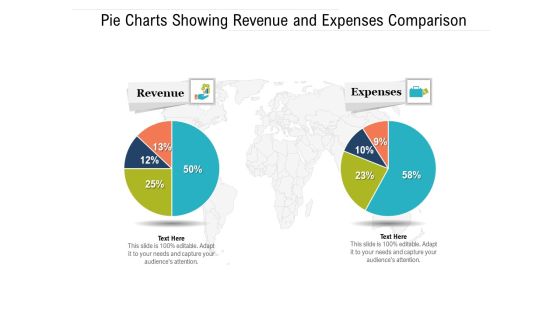
Pie Charts Showing Revenue And Expenses Comparison Ppt PowerPoint Presentation File Objects PDF
Pitch your topic with ease and precision using this pie charts showing revenue and expenses comparison ppt powerpoint presentation file objects pdf. This layout presents information on revenue, expenses. It is also available for immediate download and adjustment. So, changes can be made in the color, design, graphics or any other component to create a unique layout.

Famous Technology Trends Charts With Multichannel Analytics Ppt PowerPoint Presentation Ideas Graphics Tutorials PDF
Pitch your topic with ease and precision using this famous technology trends charts with multichannel analytics ppt powerpoint presentation ideas graphics tutorials pdf. This layout presents information on multichannel analytics, content marketing, paid media, social media marketing, email marketing . It is also available for immediate download and adjustment. So, changes can be made in the color, design, graphics or any other component to create a unique layout.

SEO Trend Charts With On Site Optimization Ppt PowerPoint Presentation Gallery Inspiration PDF
Pitch your topic with ease and precision using this seo trend charts with on site optimization ppt powerpoint presentation gallery inspiration pdf. This layout presents information on social media marketing, content creation, site optimization, local search optimization. It is also available for immediate download and adjustment. So, changes can be made in the color, design, graphics or any other component to create a unique layout.

Free Business Charts Sequential Mixed Process Flow Diagram 5 Stages PowerPoint Template
We present our free business charts sequential mixed process flow diagram 5 stages PowerPoint template.Download our Marketing PowerPoint Templates because It can Conjure up grand ideas with our magical PowerPoint Templates and Slides. Leave everyone awestruck by the end of your presentation. Use our Process and Flows PowerPoint Templates because you can Break through with our PowerPoint Templates and Slides. Bring down the mental barriers of your audience. Use our Business PowerPoint Templates because Our PowerPoint Templates and Slides are conceived by a dedicated team. Use them and give form to your wondrous ideas. Present our Circle Charts PowerPoint Templates because Our PowerPoint Templates and Slides are aesthetically designed to attract attention. We gaurantee that they will grab all the eyeballs you need. Download and present our Shapes PowerPoint Templates because you can Break through with our PowerPoint Templates and Slides. Bring down the mental barriers of your audience.Use these PowerPoint slides for presentations relating to Diagram, Concept, Process, Organization, Stakeholders, Tactics, Model, Corporate, Tool, Business, Vector, Hierarchy, Representation, Guide, Marketing, Theory, Idea, Development, Abstract, Management, Manage, Cycle, Innovate, Icon, Strategy, Mission, Clipart, Guidelines, Direction, Design, Plans, Commerce, Conceptual, Resource, Action, Product, Goals, Performance. The prominent colors used in the PowerPoint template are Green, Gray, Black.

Free Business Charts Sequential Mixed Process Flow Diagram 5 Stages PowerPoint Templates
We present our free business charts sequential mixed process flow diagram 5 stages PowerPoint templates.Present our Marketing PowerPoint Templates because You can Inspire your team with our PowerPoint Templates and Slides. Let the force of your ideas flow into their minds. Present our Process and Flows PowerPoint Templates because Our PowerPoint Templates and Slides will let you Clearly mark the path for others to follow. Present our Business PowerPoint Templates because You can Stir your ideas in the cauldron of our PowerPoint Templates and Slides. Cast a magic spell on your audience. Download and present our Circle Charts PowerPoint Templates because You have gained great respect for your brilliant ideas. Use our PowerPoint Templates and Slides to strengthen and enhance your reputation. Download and present our Shapes PowerPoint Templates because Our PowerPoint Templates and Slides will help you be quick off the draw. Just enter your specific text and see your points hit home.Use these PowerPoint slides for presentations relating to Diagram, Concept, Process, Organization, Stakeholders, Tactics, Model, Corporate, Tool, Business, Vector, Hierarchy, Representation, Guide, Marketing, Theory, Idea, Development, Abstract, Management, Manage, Cycle, Innovate, Icon, Strategy, Mission, Clipart, Guidelines, Direction, Design, Plans, Commerce, Conceptual, Resource, Action, Product, Goals, Performance. The prominent colors used in the PowerPoint template are Yellow, Gray, Black.

Comparison Of Social Media Platforms To Run Online Ads Ppt PowerPoint Presentation Diagram Graph Charts PDF
This slide showcases comparative assessment of social media channels which can help marketers to identify ideal platform for running ad campaigns. Its key components are platform, worldwide users, user demographics, B2B and B2C Slidegeeks is here to make your presentations a breeze with Comparison Of Social Media Platforms To Run Online Ads Ppt PowerPoint Presentation Diagram Graph Charts PDF With our easy to use and customizable templates, you can focus on delivering your ideas rather than worrying about formatting. With a variety of designs to choose from, you are sure to find one that suits your needs. And with animations and unique photos, illustrations, and fonts, you can make your presentation pop. So whether you are giving a sales pitch or presenting to the board, make sure to check out Slidegeeks first.

Information Technology Expenditure Summary Dashboard Ppt PowerPoint Presentation Diagram Graph Charts PDF
The following slide showcases the cyber security expense overview to better allocate budget. It includes elements such as IT cost, revenue, security incidents, services down, issue status summary, total business hours lost etc. This Information Technology Expenditure Summary Dashboard Ppt PowerPoint Presentation Diagram Graph Charts PDF from Slidegeeks makes it easy to present information on your topic with precision. It provides customization options, so you can make changes to the colors, design, graphics, or any other component to create a unique layout. It is also available for immediate download, so you can begin using it right away. Slidegeeks has done good research to ensure that you have everything you need to make your presentation stand out. Make a name out there for a brilliant performance.
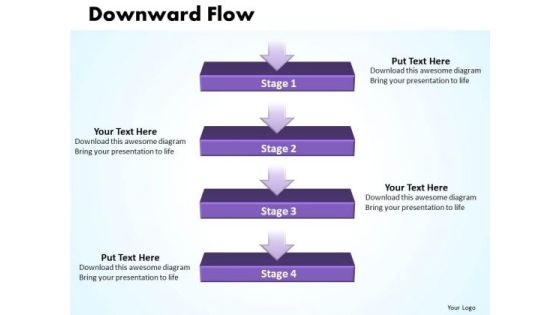
Ppt Linear Flow Process Charts 4 Power Point Stage PowerPoint Templates
PPT linear flow process charts 4 power point stage PowerPoint Templates-This Four State Diagram is a significant modeling technique for analyzing and constructing information processes.-PPT linear flow process charts 4 power point stage PowerPoint Templates-Advertise, Advertisement, Badge, Box, Business, Card, Collection, Column, Corporate, Costing, Counting, Design, Discount, Element, Featured, Finance, Grid, Hosting, Information, List, Message, Placard, Plan, Price, Pricing, Rectangle, Report, Round
Statistical Analysis Icon With Business Charts Ppt PowerPoint Presentation Gallery File Formats PDF
Pitch your topic with ease and precision using this statistical analysis icon with business charts ppt powerpoint presentation gallery file formats pdf. This layout presents information on statistical analysis icon with business charts. It is also available for immediate download and adjustment. So, changes can be made in the color, design, graphics or any other component to create a unique layout.
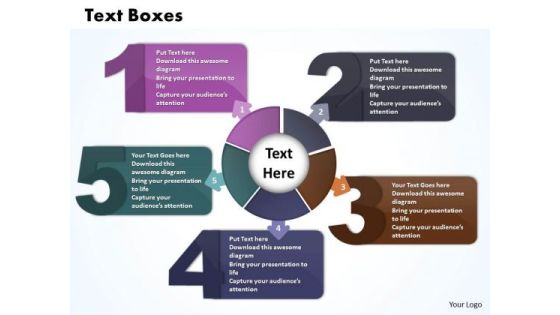
Business Charts PowerPoint Templates Five Text Boxes Connected With Circular Direction
Business Charts PowerPoint templates five text boxes connected with circular direction-Use this Circular Process with five text Boxes to represent a continuing sequence of stages, tasks, or events in a circular flow and emphasize the connection between all components. You can change color, size and orientation of any icon to your liking.-Business Charts PowerPoint templates five text boxes connected with circular direction
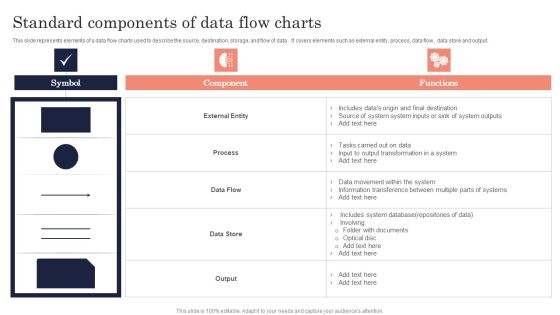
Standard Components Of Data Flow Charts Ppt PowerPoint Presentation File Pictures PDF
this slide represents elements of a data flow charts used to describe the source, destination, storage, and flow of data. it covers elements such as external entity, process, data flow, data store and output. Showcasing this set of slides titled Standard Components Of Data Flow Charts Ppt PowerPoint Presentation File Pictures PDF. The topics addressed in these templates are Symbol, Component, Functions. All the content presented in this PPT design is completely editable. Download it and make adjustments in color, background, font etc. as per your unique business setting.
HR Services Icon With Analytics Technology And Charts Ppt PowerPoint Presentation Inspiration Format Ideas PDF
Pitch your topic with ease and precision using this hr services icon with analytics technology and charts ppt powerpoint presentation inspiration format ideas pdf. This layout presents information on hr services icon with analytics technology and charts. It is also available for immediate download and adjustment. So, changes can be made in the color, design, graphics or any other component to create a unique layout.
