AI PPT Maker
Templates
PPT Bundles
Design Services
Business PPTs
Business Plan
Management
Strategy
Introduction PPT
Roadmap
Self Introduction
Timelines
Process
Marketing
Agenda
Technology
Medical
Startup Business Plan
Cyber Security
Dashboards
SWOT
Proposals
Education
Pitch Deck
Digital Marketing
KPIs
Project Management
Product Management
Artificial Intelligence
Target Market
Communication
Supply Chain
Google Slides
Research Services
 One Pagers
All Categories
-
Home
- Customer Favorites
- Organizational Chart
Organizational Chart

Customer Retention With Email Advertising Campaign Plan Statistics Highlighting Customer Conversion Rate Demonstration PDF
Mentioned slide showcases reducing customer conversion rate over the year which provided overview of declining business performance. It includes key components such as yearly customer conversion rate, key reasons of declining conversion rate. This modern and well arranged Customer Retention With Email Advertising Campaign Plan Statistics Highlighting Customer Conversion Rate Demonstration PDF provides lots of creative possibilities. It is very simple to customize and edit with the Powerpoint Software. Just drag and drop your pictures into the shapes. All facets of this template can be edited with Powerpoint no extra software is necessary. Add your own material, put your images in the places assigned for them, adjust the colors, and then you can show your slides to the world, with an animated slide included.
Statistics Indicating Recurring Business Operational Expenditure In Telecom Operations Icons PDF
This slide shows statistics indicating recurring operating expenditure OPEX in telecom operations which can benefit their executives in evaluating the current expenses and make cost effective amendments for future operations. It includes information about maintenance, repair, network charging and billing, customer support, marketing and operational planning costs. Pitch your topic with ease and precision using this Statistics Indicating Recurring Business Operational Expenditure In Telecom Operations Icons PDF. This layout presents information on Company, Costs, Marketing Costs. It is also available for immediate download and adjustment. So, changes can be made in the color, design, graphics or any other component to create a unique layout.
Emerging Trends In Integrated Solid Waste Administration Icons PDF
This slide represents the statistical data of the upcoming trends in the management of solid waste of different areas. It shows millions of tonnes collected for the current year and forecast of future years. Pitch your topic with ease and precision using this Emerging Trends In Integrated Solid Waste Administration Icons PDF. This layout presents information on Emerging, Integrated, Administration. It is also available for immediate download and adjustment. So, changes can be made in the color, design, graphics or any other component to create a unique layout.
Yearly Outcomes Summary Of Profit And Loss Trends Icons PDF
This slide shows the graphical representation of result summary of profit and loss trends for five consecutive years that shows revenues, cost of goods sold, selling, general and administrative expenses, net income, etc.Pitch your topic with ease and precision using this Yearly Outcomes Summary Of Profit And Loss Trends Icons PDF This layout presents information on Earned Maximum, Selling General, Administrative Expenses It is also available for immediate download and adjustment. So, changes can be made in the color, design, graphics or any other component to create a unique layout.
Marketing And Operations Dashboard For Performance Management Icons PDF
This slide covers sales and operation dashboard for performance management. It involves details such as number of new buyers, sales revenue, average revenue per unit etc. Pitch your topic with ease and precision using this Marketing And Operations Dashboard For Performance Management Icons PDF. This layout presents information on Average Revenue Per Unit, Customer Acquisition Cost, Customer Lifetime Value. It is also available for immediate download and adjustment. So, changes can be made in the color, design, graphics or any other component to create a unique layout.

Company Inward Marketing Strategy Key Barriers Statistics Icons PDF
This slide covers top challenges of inbound marketing strategy that reduces its effectiveness. It includes generation of traffic, proving ROI for marketing activities, securing budget, technology update, website management, hiring talent and training team.Pitch your topic with ease and precision using this Company Inward Marketing Strategy Key Barriers Statistics Icons PDF. This layout presents information on Difficult To Search, Insufficient Traffic, Setting Budget. It is also available for immediate download and adjustment. So, changes can be made in the color, design, graphics or any other component to create a unique layout.
Gross Profit Margin Dashboard With Revenue Vs Expenses Icons PDF
This slide showcases dashboard that can help organization to evaluate the revenue generated and expenses incurred in conducting operations. It also showcases gross profit and margin of last financial year. Pitch your topic with ease and precision using this Gross Profit Margin Dashboard With Revenue Vs Expenses Icons PDF. This layout presents information on Gross Profit Margin, EBITDA Margin, Net Profit Margin. It is also available for immediate download and adjustment. So, changes can be made in the color, design, graphics or any other component to create a unique layout.
Phishing Incident Management Dashboard For Attacks Awareness Training Icons PDF
This slide covers phishing incident management dashboard for effective awareness training. It involves details such as average resolution time, new incidents, incident status, resolved vs unresolved incidents and created vs closed incidents. Pitch your topic with ease and precision using this Phishing Incident Management Dashboard For Attacks Awareness Training Icons PDF. This layout presents information on Phishing Incident Management Dashboard, Attacks Awareness Training. It is also available for immediate download and adjustment. So, changes can be made in the color, design, graphics or any other component to create a unique layout.
Marketing Barriers Faced By Product Managers Ppt Icon Skills PDF
The slide includes survey of product managers to discover marketing challenges and solutions. It includes various problems such as lack of time, data quality management, lack of financial resources, etc along with some solutions. Pitch your topic with ease and precision using this Marketing Barriers Faced By Product Managers Ppt Icon Skills PDF. This layout presents information on AI And ML, Problems, Technical Support. It is also available for immediate download and adjustment. So, changes can be made in the color, design, graphics or any other component to create a unique layout.
VR Technology Market Overview Ppt PowerPoint Presentation Icon Example PDF
The following slide highlights VR technology market overview, including its growth drivers such as increase in smartphone penetration, post COVID-19 growth of virtual reality market and boost in gaming industry. Pitch your topic with ease and precision using this VR Technology Market Overview Ppt PowerPoint Presentation Icon Example PDF. This layout presents information on Growth Drivers, Key Takeaways, Exponential Virtual Reality. It is also available for immediate download and adjustment. So, changes can be made in the color, design, graphics or any other component to create a unique layout.

Content Gap Analysis For E Commerce Staff Skills Icons PDF
The slide inculcates gap analysis for content team to formulate effective ,marketing strategies for e commerce business. Various types of content included are audio content, email content, blog content, case study, etc. Pitch your topic with ease and precision using this Content Gap Analysis For E Commerce Staff Skills Icons PDF. This layout presents information on Audio Content, Email Content, Blog Content. It is also available for immediate download and adjustment. So, changes can be made in the color, design, graphics or any other component to create a unique layout.
Driver Attention Monitoring Software Dashboard For Automotive Vehicles Icons PDF
This slide covers the dashboard representing the automotive vehicles driver monitoring system. It includes details related to content performance, platform wise volume of mentions, media and website overview. Pitch your topic with ease and precision using this Driver Attention Monitoring Software Dashboard For Automotive Vehicles Icons PDF. This layout presents information on Content Performance, Website Overview, Media Overview. It is also available for immediate download and adjustment. So, changes can be made in the color, design, graphics or any other component to create a unique layout.

Comparative Analysis For Manual And Automation Testing Lifecycle Icons PDF
This slide showcases graphical report to compare test expenses from manual and automated testing cycles over the years. It further includes details about benefits that can be derived from test automation cycle. Pitch your topic with ease and precision using this Comparative Analysis For Manual And Automation Testing Lifecycle Icons PDF. This layout presents information on Comparative Analysis For Manual, Automation Testing Lifecycle. It is also available for immediate download and adjustment. So, changes can be made in the color, design, graphics or any other component to create a unique layout.

Data Expansion Trends For Global Home Ware Market Icons PDF
This slide shows data growth trends for home ware industry that presents incremental growth, CAGR and other figures etc. It include figure next year growth and incremental growth etc. Pitch your topic with ease and precision using this Data Expansion Trends For Global Home Ware Market Icons PDF. This layout presents information on Incremental Growth Figures, Growth Rate Predicted, Fragmented Market Model. It is also available for immediate download and adjustment. So, changes can be made in the color, design, graphics or any other component to create a unique layout.
Soft Drink Company Executive Report Overview Icons PDF
This slide illustrate soft drink manufacturing company overview along with its vision and mission statement. It includes elements such as company background, key facts about company, sales, revenue and cost of goods comparison etc. Pitch your topic with ease and precision using this Soft Drink Company Executive Report Overview Icons PDF. This layout presents information on Vision, Products, Financial Comparison. It is also available for immediate download and adjustment. So, changes can be made in the color, design, graphics or any other component to create a unique layout.
Online Shopping Survey Outcome In Percentage Icons PDF
The slide showcases percentage results to analyze experience of online shopping to identify areas for enhancing shopping experience. It includes key elements such as reasons for online shopping, elements considered by customers and shopping platforms. Pitch your topic with ease and precision using this Online Shopping Survey Outcome In Percentage Icons PDF. This layout presents information on Price Comparison, Product Information, Online Reviews. It is also available for immediate download and adjustment. So, changes can be made in the color, design, graphics or any other component to create a unique layout.

Project Controlling Dashboard Indicating Stages And Deliverables Ppt Styles Guide PDF
This slide shows dashboard for controlling multiple phases and deliverables of project. It provides information such as total revenue, cost, margin, task by status, risk, planned end date, owner, etc. Pitch your topic with ease and precision using this Project Controlling Dashboard Indicating Stages And Deliverables Ppt Styles Guide PDF. This layout presents information on Total Revenue, Total Margin, Total Cost. It is also available for immediate download and adjustment. So, changes can be made in the color, design, graphics or any other component to create a unique layout.

Weekly Performance Report Dashboard With Project Budget Download PDF
This slide contains the weekly performance report of various phases of project with the overdue tasks and their upcoming . it also includes the project budget with the tracking of workload on staff members. Pitch your topic with ease and precision using this Weekly Performance Report Dashboard With Project Budget Download PDF. This layout presents information on Planning, Design, Development, Testing. It is also available for immediate download and adjustment. So, changes can be made in the color, design, graphics or any other component to create a unique layout.
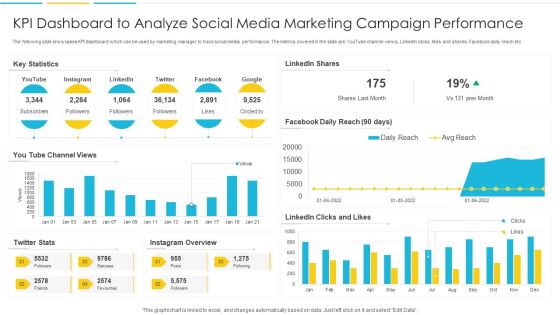
KPI Dashboard To Analyze Social Media Marketing Campaign Performance Rules PDF
The following slide showcases KPI dashboard which can be used by marketing manager to track social media performance. The metrics covered in the slide are YouTube channel views, LinkedIn clicks, likes and shares, Facebook daily reach etc. Pitch your topic with ease and precision using this KPI Dashboard To Analyze Social Media Marketing Campaign Performance Rules PDF. This layout presents information on Dashboard, Marketing, Analyze. It is also available for immediate download and adjustment. So, changes can be made in the color, design, graphics or any other component to create a unique layout.
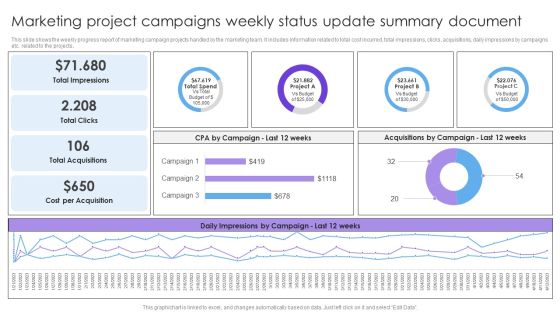
Marketing Project Campaigns Weekly Status Update Summary Document Formats PDF
This slide shows the weekly progress report of marketing campaign projects handled by the marketing team. It includes information related to total cost incurred, total impressions, clicks, acquisitions, daily impressions by campaigns etc. related to the projects. Pitch your topic with ease and precision using this Marketing Project Campaigns Weekly Status Update Summary Document Formats PDF. This layout presents information on Total Impressions, Total Clicks, Total Acquisitions. It is also available for immediate download and adjustment. So, changes can be made in the color, design, graphics or any other component to create a unique layout.
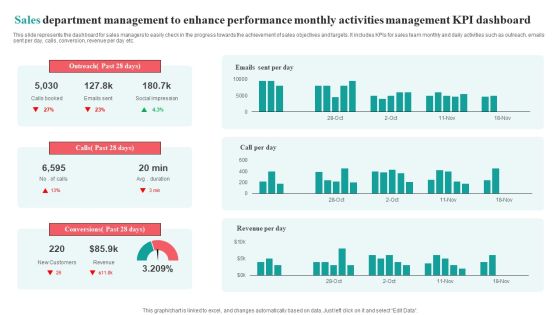
Sales Department Management To Enhance Performance Monthly Activities Management KPI Dashboard Brochure PDF
This slide represents the dashboard for sales managers to easily check in the progress towards the achievement of sales objectives and targets. It includes KPIs for sales team monthly and daily activities such as outreach, emails sent per day, calls, conversion, revenue per day etc.Pitch your topic with ease and precision using this Sales Department Management To Enhance Performance Monthly Activities Management KPI Dashboard Brochure PDF. This layout presents information on Social Impression, Conversions Past, Outreach Past. It is also available for immediate download and adjustment. So, changes can be made in the color, design, graphics or any other component to create a unique layout.
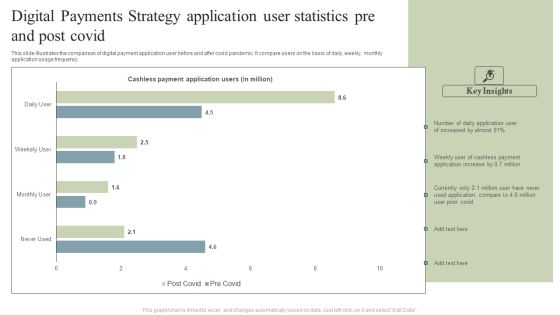
Digital Payments Strategy Application User Statistics Pre And Post Covid Pictures PDF
This slide illustrates the comparison of digital payment application user before and after covid pandemic. It compare users on the basis of daily, weekly, monthly application usage frequency. Pitch your topic with ease and precision using this Digital Payments Strategy Application User Statistics Pre And Post Covid Pictures PDF. This layout presents information on Cashless Payment, Application Users, Cashless Payment, Application Increase. It is also available for immediate download and adjustment. So, changes can be made in the color, design, graphics or any other component to create a unique layout.
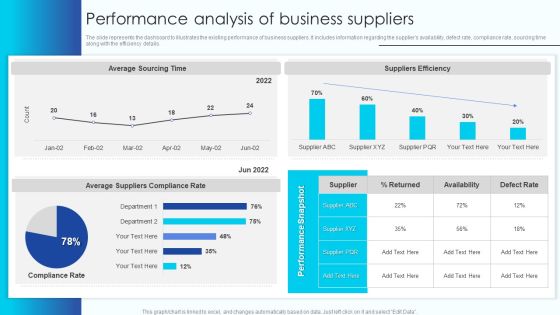
Performance Analysis Of Business Suppliers Vendor Management Program For Supplier Mockup PDF
The slide represents the dashboard to illustrates the existing performance of business suppliers. It includes information regarding the suppliers availability, defect rate, compliance rate, sourcing time along with the efficiency details.This Performance Analysis Of Business Suppliers Vendor Management Program For Supplier Mockup PDF from Slidegeeks makes it easy to present information on your topic with precision. It provides customization options, so you can make changes to the colors, design, graphics, or any other component to create a unique layout. It is also available for immediate download, so you can begin using it right away. Slidegeeks has done good research to ensure that you have everything you need to make your presentation stand out. Make a name out there for a brilliant performance.
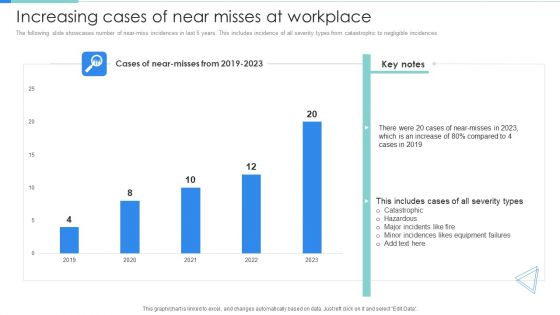
Deployment Of Workplace Safety Management Program Increasing Cases Of Near Misses At Workplace Clipart PDF
The following slide showcases number of near-miss incidences in last 5 years. This includes incidence of all severity types from catastrophic to negligible incidences. This Deployment Of Workplace Safety Management Program Increasing Cases Of Near Misses At Workplace Clipart PDF from Slidegeeks makes it easy to present information on your topic with precision. It provides customization options, so you can make changes to the colors, design, graphics, or any other component to create a unique layout. It is also available for immediate download, so you can begin using it right away. Slidegeeks has done good research to ensure that you have everything you need to make your presentation stand out. Make a name out there for a brilliant performance.

Change In Customer Preference Towards E Banking Inspiration PDF
This slide highlights the consumer preference for retail branch banking in bar graph format, which showcases the interest of consumers for digital or in person transaction with bank. This Change In Customer Preference Towards E Banking Inspiration PDF from Slidegeeks makes it easy to present information on your topic with precision. It provides customization options, so you can make changes to the colors, design, graphics, or any other component to create a unique layout. It is also available for immediate download, so you can begin using it right away. Slidegeeks has done good research to ensure that you have everything you need to make your presentation stand out. Make a name out there for a brilliant performance.

Market Research Project Dashboard For Measuring Brand Awareness Rules PDF
Mentioned slide delineates research program dashboard which can be used by marketers for measuring brand awareness. This dashboard includes various elements such as celebrity analysis, top branding themes etc. Pitch your topic with ease and precision using this market research project dashboard for measuring brand awareness rules pdf. This layout presents information on brand awareness, celebrity analysis, advertisement. It is also available for immediate download and adjustment. So, changes can be made in the color, design, graphics or any other component to create a unique layout.

Statistics Highlighting Revenue Generated After Implementation Of Advertisement Work Plan Professional PDF
Entire slide depicts the statistics illustrating the amount of money that was made once the marketing work plan was implemented which assist in meeting up the objectives. It covers the period from2018 to 2023 Pitch your topic with ease and precision using this Statistics Highlighting Revenue Generated After Implementation Of Advertisement Work Plan Professional PDF. This layout presents information on Key Insights, Work Plan, Statistics. It is also available for immediate download and adjustment. So, changes can be made in the color, design, graphics or any other component to create a unique layout.
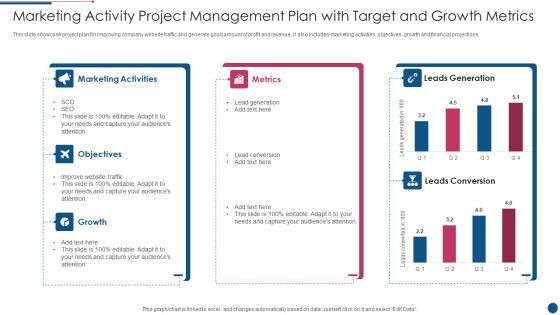
Marketing Activity Project Management Plan With Target And Growth Metrics Introduction PDF
This slide showcase project plan for improving company website traffic and generate good amount of profit and revenue, it also includes marketing activities, objectives, growth and financial projections. Pitch your topic with ease and precision using this Marketing Activity Project Management Plan With Target And Growth Metrics Introduction PDF. This layout presents information on Marketing Activities, Metrics, Growth. It is also available for immediate download and adjustment. So, changes can be made in the color, design, graphics or any other component to create a unique layout.
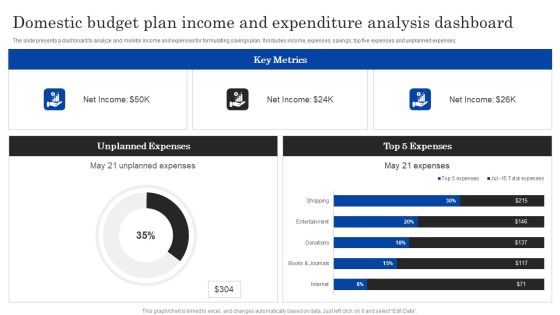
Domestic Budget Plan Income And Expenditure Analysis Dashboard Ppt PowerPoint Presentation Layouts Clipart Images PDF
The slide presents a dashboard to analyze and monitor income and expenses for formulating savings plan. It includes income, expenses, savings, top five expenses and unplanned expenses.Pitch your topic with ease and precision using this Domestic Budget Plan Income And Expenditure Analysis Dashboard Ppt PowerPoint Presentation Layouts Clipart Images PDF. This layout presents information on Unplanned Expenses, Expenses, Key Metrics. It is also available for immediate download and adjustment. So, changes can be made in the color, design, graphics or any other component to create a unique layout.
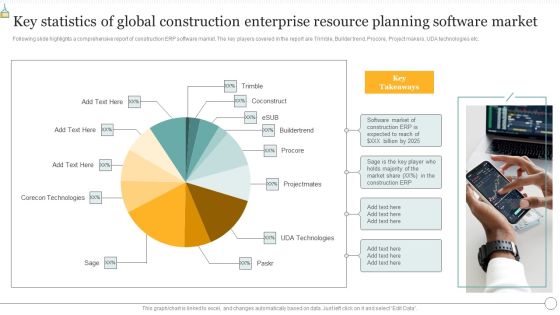
Key Statistics Of Global Construction Enterprise Resource Planning Software Market Sample PDF
Following slide highlights a comprehensive report of construction ERP software market. The key players covered in the report are Trimble, Builder trend, Procore, Project makers, UDA technologies etc. Pitch your topic with ease and precision using this Key Statistics Of Global Construction Enterprise Resource Planning Software Market Sample PDF. This layout presents information on Key Statistics, Global Construction Enterprise, Resource Planning Software Market. It is also available for immediate download and adjustment. So, changes can be made in the color, design, graphics or any other component to create a unique layout.
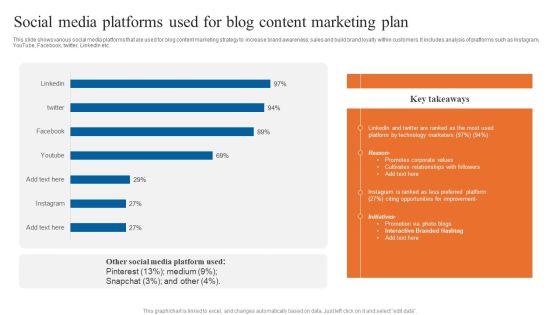
Social Media Platforms Used For Blog Content Marketing Plan Portrait PDF
This slide shows various social media platforms that are used for blog content marketing strategy to increase brand awareness, sales and build brand loyalty within customers. It includes analysis of platforms such as Instagram, YouTube, Facebook, twitter, LinkedIn etc. Pitch your topic with ease and precision using this Social Media Platforms Used For Blog Content Marketing Plan Portrait PDF. This layout presents information on Social Media Platforms, Content Marketing Plan, Promotes Corporate Values. It is also available for immediate download and adjustment. So, changes can be made in the color, design, graphics or any other component to create a unique layout.
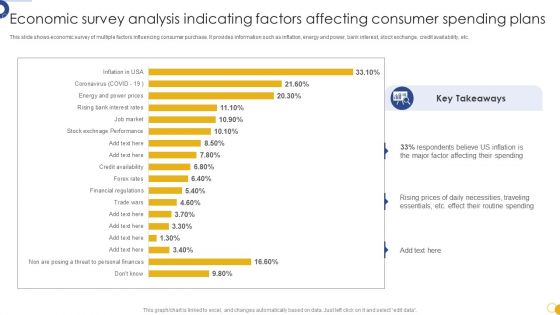
Economic Survey Analysis Indicating Factors Affecting Consumer Spending Plans Download PDF
This slide shows economic survey of multiple factors influencing consumer purchase. It provides information such as inflation, energy and power, bank interest, stock exchange, credit availability, etc. Pitch your topic with ease and precision using this Economic Survey Analysis Indicating Factors Affecting Consumer Spending Plans Download PDF. This layout presents information on Economic Survey Analysis, Indicating Factors Affecting, Consumer Spending Plans. It is also available for immediate download and adjustment. So, changes can be made in the color, design, graphics or any other component to create a unique layout.

Planned Vs Actual Budget Variance Analysis For Financial Year 2023 Inspiration PDF
The following slide depicts the variance in the planned and actual revenues and expenses to track budget accurately. It includes elements such as income, expenses, net cash flows, total variable cost, total fixed cost etc. Pitch your topic with ease and precision using this Planned Vs Actual Budget Variance Analysis For Financial Year 2023 Inspiration PDF. This layout presents information on Budget Variance Analysis, Variable Cost, Fixed Cost. It is also available for immediate download and adjustment. So, changes can be made in the color, design, graphics or any other component to create a unique layout.
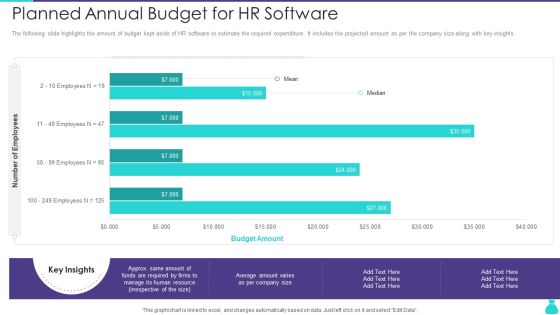
Planned Annual Budget For HR Software Ppt PowerPoint Presentation Gallery Outfit PDF
The following slide highlights the amount of budget kept aside of HR software to estimate the required expenditure. It includes the projected amount as per the company size along with key insights. Pitch your topic with ease and precision using this Planned Annual Budget For HR Software Ppt PowerPoint Presentation Gallery Outfit PDF. This layout presents information on Budget Amount, Employee. It is also available for immediate download and adjustment. So, changes can be made in the color, design, graphics or any other component to create a unique layout.
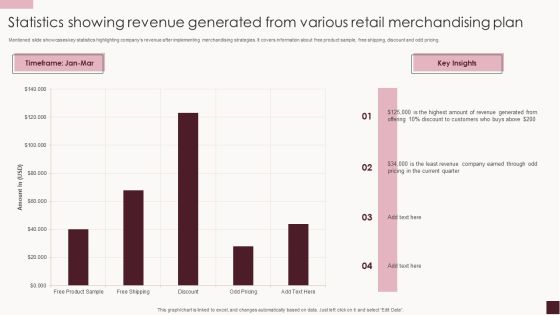
Statistics Showing Revenue Generated From Various Retail Merchandising Plan Background PDF
Mentioned slide showcases key statistics highlighting companys revenue after implementing merchandising strategies. It covers information about free product sample, free shipping, discount and odd pricing. Pitch your topic with ease and precision using this Statistics Showing Revenue Generated From Various Retail Merchandising Plan Background PDF. This layout presents information on Highest Amount, Discount Customers, Revenue Generated. It is also available for immediate download and adjustment. So, changes can be made in the color, design, graphics or any other component to create a unique layout.
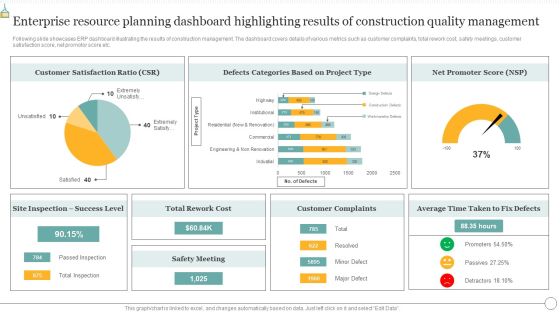
Enterprise Resource Planning Dashboard Highlighting Results Of Construction Quality Management Summary PDF
Following slide exhibits various functionalities that constructing company look for in ERP software. The multiple functionalities covered in the slide are project tracking, job costing, project estimating, improved accuracy, process automation etc. Pitch your topic with ease and precision using this Enterprise Resource Planning Dashboard Highlighting Results Of Construction Quality Management Summary PDF. This layout presents information on Technology Efficiency, Process Automation, Improved Accuracy. It is also available for immediate download and adjustment. So, changes can be made in the color, design, graphics or any other component to create a unique layout.

KPI Dashboard To Track Performance Of Online Promotional Budget Plan Inspiration PDF
This slide enables to monitor quarterly performance and return on marketing expenditure of digital marketing executed by an organization. It includes source wise performance report , return on investment, sales funnel , average order value report etc. Pitch your topic with ease and precision using this KPI Dashboard To Track Performance Of Online Promotional Budget Plan Inspiration PDF. This layout presents information on Average Order Value, Return On Investment, Sales. It is also available for immediate download and adjustment. So, changes can be made in the color, design, graphics or any other component to create a unique layout.

Edtech Service Launch And Promotion Plan Evaluating Market Share Of Competitors Infographics PDF
This slide showcases assessment of competitor share that can help organization to identify key player in market for targeted service offering. Its key components are market share assessment and competitor details. Take your projects to the next level with our ultimate collection of Edtech Service Launch And Promotion Plan Evaluating Market Share Of Competitors Infographics PDF. Slidegeeks has designed a range of layouts that are perfect for representing task or activity duration, keeping track of all your deadlines at a glance. Tailor these designs to your exact needs and give them a truly corporate look with your own brand colors they will make your projects stand out from the rest.
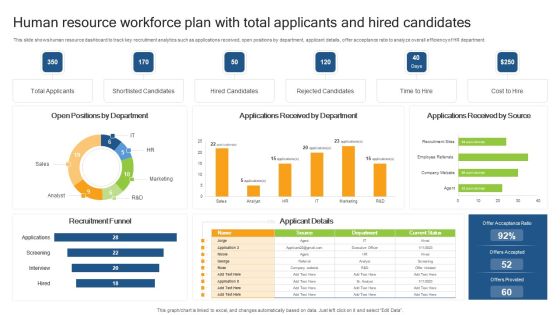
Human Resource Workforce Plan With Total Applicants And Hired Candidates Clipart PDF
This slide shows human resource dashboard to track key recruitment analytics such as applications received, open positions by department, applicant details, offer acceptance ratio to analyze overall efficiency of HR department. Pitch your topic with ease and precision using this Human Resource Workforce Plan With Total Applicants And Hired Candidates Clipart PDF. This layout presents information on Total Applicants, Shortlisted Candidates, Recruitment Funnel. It is also available for immediate download and adjustment. So, changes can be made in the color, design, graphics or any other component to create a unique layout.

Customer Onboarding Journey Optimization Plan Impact Of Efficient Customer Graphics PDF
This slide showcases positive impact of proper customer onboarding process. It includes reduced customer churn rate and onboarding support tickets. This Customer Onboarding Journey Optimization Plan Impact Of Efficient Customer Graphics PDF from Slidegeeks makes it easy to present information on your topic with precision. It provides customization options, so you can make changes to the colors, design, graphics, or any other component to create a unique layout. It is also available for immediate download, so you can begin using it right away. Slidegeeks has done good research to ensure that you have everything you need to make your presentation stand out. Make a name out there for a brilliant performance.

Strategic Global Expansion Business Plan Dashboard To Analyse Sales Post Global Expansion Diagrams PDF
This slide showcase dashboard that can help organization track sales after global expansion. Its key components are sales target, target achievement, sales by channel, inventory days outstanding, sales growth, gross profit, gross profit margin etc. Presenting this PowerPoint presentation, titled Strategic Global Expansion Business Plan Dashboard To Analyse Sales Post Global Expansion Diagrams PDF, with topics curated by our researchers after extensive research. This editable presentation is available for immediate download and provides attractive features when used. Download now and captivate your audience. Presenting this Strategic Global Expansion Business Plan Dashboard To Analyse Sales Post Global Expansion Diagrams PDF. Our researchers have carefully researched and created these slides with all aspects taken into consideration. This is a completely customizable Strategic Global Expansion Business Plan Dashboard To Analyse Sales Post Global Expansion Diagrams PDF that is available for immediate downloading. Download now and make an impact on your audience. Highlight the attractive features available with our PPTs.

Learning And Development Metrics Overview Analysis Dashboard Graphics PDF
This slide shows dashboard of employees trained in different locations for learning and development activity. It includes elements such as total invited, total trained, unique trained, total active employees, total programs etc. Pitch your topic with ease and precision using this Learning And Development Metrics Overview Analysis Dashboard Graphics PDF. This layout presents information on Unique Trained YTD, Training Man Days, Total Programs. It is also available for immediate download and adjustment. So, changes can be made in the color, design, graphics or any other component to create a unique layout.

B2C Email Marketing Performance Benchmarks Analysis Topics PDF
The purpose of this slide is to outline e-mail marketing benchmarks metrics that are used to assess the success of an email campaign. Certain metrics include follow-up email, finance related, response rate, loyalty program etc. Pitch your topic with ease and precision using this B2C Email Marketing Performance Benchmarks Analysis Topics PDF. This layout presents information on Advertisement, Loyalty Program, Performance Benchmarks Analysis. It is also available for immediate download and adjustment. So, changes can be made in the color, design, graphics or any other component to create a unique layout.
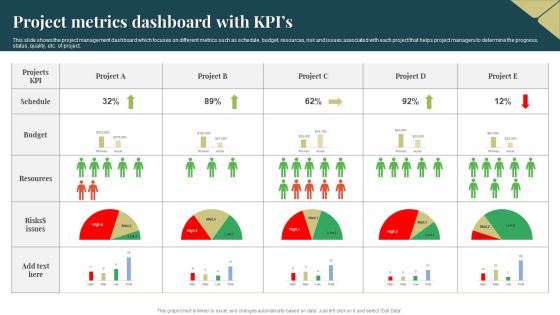
Project Metrics Dashboard With Kpis Ideas PDF
This slide shows the project management dashboard which focuses on different metrics such as schedule, budget, resources, risk and issues associated with each project that helps project managers to determine the progress, status, quality, etc. of project. Pitch your topic with ease and precision using this Project Metrics Dashboard With Kpis Ideas PDF. This layout presents information on Resources, Budget, Risks. It is also available for immediate download and adjustment. So, changes can be made in the color, design, graphics or any other component to create a unique layout.

Investment Project KPI Dashboard For Construction Analytics Background PDF
This slide illustrates construction dashboard for improving capital project outcomes. It also include KPIs such as projects completion, schedule performance index, consumer price index, project status, cost breakdown, etc. Pitch your topic with ease and precision using this Investment Project KPI Dashboard For Construction Analytics Background PDF. This layout presents information on Cost Breakdown, Completion, Progress. It is also available for immediate download and adjustment. So, changes can be made in the color, design, graphics or any other component to create a unique layout.

Attain Production Goals And Objectives KPI Metrices Ppt Summary Format Ideas PDF
This slide covers dashboard for comparing targets with actual units produced. It includes metrics such as production volume, quality, performance, production time, scheduled time, operating time, revenue, etc. Pitch your topic with ease and precision using this Attain Production Goals And Objectives KPI Metrices Ppt Summary Format Ideas PDF. This layout presents information on Production, Cost, Revenue, Performance. It is also available for immediate download and adjustment. So, changes can be made in the color, design, graphics or any other component to create a unique layout.
Multiple Project Progress Tracking Report Dashboard With Key Performance Indicators Brochure PDF
This slide shows the dashboard representing status of various projects and tracking their performance with the help of key performance indicators which are as follows schedule, budget, resources, risk and issues and quality of projects.Pitch your topic with ease and precision using this Multiple Project Progress Tracking Report Dashboard With Key Performance Indicators Brochure PDF. This layout presents information on Risks Issues, Quality Open Defects, Techno Blogger. It is also available for immediate download and adjustment. So, changes can be made in the color, design, graphics or any other component to create a unique layout.
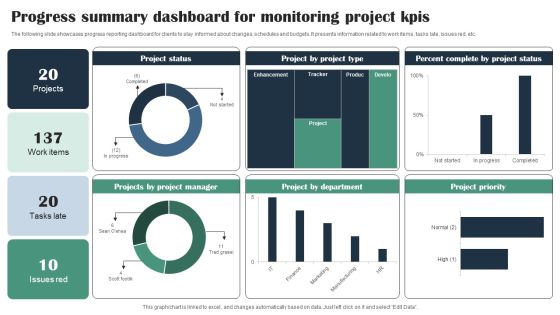
Progress Summary Dashboard For Monitoring Project Kpis Infographics PDF
The following slide showcases progress reporting dashboard for clients to stay informed about changes, schedules and budgets. It presents information related to work items, tasks late, issues red, etc. Pitch your topic with ease and precision using this Progress Summary Dashboard For Monitoring Project Kpis Infographics PDF. This layout presents information on Project Status, Project Manager, Project Type, Percent Complete. It is also available for immediate download and adjustment. So, changes can be made in the color, design, graphics or any other component to create a unique layout.

Business Intelligence Dashboard To Track Call Center Kpis Download PDF
This slide showcases business intelligence dashboard to help organization track key performance metrics. It further includes details about top agents, close rate, calls handled, abandon rate, scheduled leads, average speed of answer, etc. Pitch your topic with ease and precision using this Business Intelligence Dashboard To Track Call Center Kpis Download PDF. This layout presents information on Business Intelligence Dashboard, Track Call Center Kpis. It is also available for immediate download and adjustment. So, changes can be made in the color, design, graphics or any other component to create a unique layout.
SFA Dashboard To Track Performance Ppt PowerPoint Presentation Icon Example File PDF
This Slide visually represents sales force automation dashboard to track performance which can be utilized by marketing managers to streamline the process of automated selling. It includes information about sales pipeline, competitors, opportunities, key competitors, etc. Pitch your topic with ease and precision using this sfa dashboard to track performance ppt powerpoint presentation icon example file pdf. This layout presents information on sales pipeline, sales pipeline by sales rep, key competitors, forecast by month, key opportunities. It is also available for immediate download and adjustment. So, changes can be made in the color, design, graphics or any other component to create a unique layout.
Saas Cloud Security Analysis With KPI Dashboard Ppt PowerPoint Presentation Icon Slides PDF
The following slide highlights the assessment of Software as a security to meet safety standards. It includes key elements such as critical incidents, risk analysis, number of open tasks etc. Pitch your topic with ease and precision using this Saas Cloud Security Analysis With KPI Dashboard Ppt PowerPoint Presentation Icon Slides PDF. This layout presents information on Quarterly Incident Severity, Incident Risk Analysis, Critical Incidents. It is also available for immediate download and adjustment. So, changes can be made in the color, design, graphics or any other component to create a unique layout.
Market Insights Research Results With KPI Dashboard Ppt PowerPoint Presentation Icon File Formats PDF
The given below slide highlights the KPAs of market research associated with customer satisfaction. It includes net promoter score, customer effort score, monthly NPS and CES trend etc.Pitch your topic with ease and precision using this Market Insights Research Results With KPI Dashboard Ppt PowerPoint Presentation Icon File Formats PDF. This layout presents information on Satisfaction Score, Customer Effort, Customer Score. It is also available for immediate download and adjustment. So, changes can be made in the color, design, graphics or any other component to create a unique layout.
Promotional Investments Barriers For B2B Sales And Marketing Data Quality Icons PDF
This slide depicts top investment challenges in B2B sales and marketing data quality. It includes barriers such as cost, better ROI with others, inadequate understanding of data quality, lack of results evidenced and absence of decision makers.Pitch your topic with ease and precision using this Promotional Investments Barriers For B2B Sales And Marketing Data Quality Icons PDF. This layout presents information on Loyalty Increases, Products Instagram, Business Presence. It is also available for immediate download and adjustment. So, changes can be made in the color, design, graphics or any other component to create a unique layout.
Statistical Data On Social Platforms Data Analysis Services Offered By Marketing Agencies Icons PDF
This slide shows the statistics related to social media services provided by the marketing agencies to their clients. It includes various services such as content creation, social media monitoring, strategy building, campaign analysis etc. Pitch your topic with ease and precision using this Statistical Data On Social Platforms Data Analysis Services Offered By Marketing Agencies Icons PDF. This layout presents information on Statistical Data, Social Platforms Data, Analysis Services, Marketing Agencies. It is also available for immediate download and adjustment. So, changes can be made in the color, design, graphics or any other component to create a unique layout.
Stock Performance Dashboard For Metrics Team Management Ppt Outline Icons PDF
This slide represents the dashboard for tracking the management team member, manager, and teams ability to ensure inventory accuracy over time. It includes KPIs such as inventory, average result area scores and result areas. Pitch your topic with ease and precision using this Stock Performance Dashboard For Metrics Team Management Ppt Outline Icons PDF. This layout presents information on Result areas, Metrics Team, Needs Help. It is also available for immediate download and adjustment. So, changes can be made in the color, design, graphics or any other component to create a unique layout.
Effect Of Pandemic On Education By Global School Closures Icons PDF
The slide illustrates the impact of COVID-19 on schools worldwide to estimate the educational loss to learners. The data included is the number of learners impacted by COVID from march 25 to april 30, 2020. Pitch your topic with ease and precision using this Effect Of Pandemic On Education By Global School Closures Icons PDF. This layout presents information on Total Estimated, Localized Level Educational, Institutions Closure. It is also available for immediate download and adjustment. So, changes can be made in the color, design, graphics or any other component to create a unique layout.

Dashboard For Strategic Organization Evaluation Of Employee Performance Ppt Icon Mockup PDF
This slide displays dashboard to strategically review and analyze employee performance in the organization to determine overall efficiency of business operations. It includes KPIs such as absenteeism, overtime hours, training costs and overall labor efficiency. Pitch your topic with ease and precision using this Dashboard For Strategic Organization Evaluation Of Employee Performance Ppt Icon Mockup PDF. This layout presents information on Training Costs, Overall Labor Effectiveness, Absenteeism, Overtime Hours. It is also available for immediate download and adjustment. So, changes can be made in the color, design, graphics or any other component to create a unique layout.

Actual Time Marketing Challenges In Using Social Data Ppt PowerPoint Presentation Icon Infographics PDF
The slide inculcates a survey highlighting various barriers in real-time marketing for using social data to increase customer engagement. Various challenges included are inadequate budget, inappropriate skills, limited search analytical tools, etc. Pitch your topic with ease and precision using this Actual Time Marketing Challenges In Using Social Data Ppt PowerPoint Presentation Icon Infographics PDF. This layout presents information on Inadequate Budget, Inappropriate Skills, Limited Staff Abilities, Quick Responses. It is also available for immediate download and adjustment. So, changes can be made in the color, design, graphics or any other component to create a unique layout.
Yearly Status Report For Average Customer Effort Score Assessment Ppt Icon Layout Ideas PDF
The slide carries a summary report to assess average CES for predicting the customer behaviour and purchasing habits. Various elements included are average rating, yearly graphs and key takeaways. Pitch your topic with ease and precision using this Yearly Status Report For Average Customer Effort Score Assessment Ppt Icon Layout Ideas PDF. This layout presents information on Good Customer Experience, Easy To Purchase, Processes, Increase Churn Rate. It is also available for immediate download and adjustment. So, changes can be made in the color, design, graphics or any other component to create a unique layout.

Call Center Quality Enhancement Plan Impact Of Poor Customer Support At Call Center Diagrams PDF
This slide highlights the impacts on the company of poor customer support at BPO call center which showcases comparison of call center companies performance with Quarterly revenue. This Call Center Quality Enhancement Plan Impact Of Poor Customer Support At Call Center Diagrams PDF from Slidegeeks makes it easy to present information on your topic with precision. It provides customization options, so you can make changes to the colors, design, graphics, or any other component to create a unique layout. It is also available for immediate download, so you can begin using it right away. Slidegeeks has done good research to ensure that you have everything you need to make your presentation stand out. Make a name out there for a brilliant performance.
