AI PPT Maker
Templates
PPT Bundles
Design Services
Business PPTs
Business Plan
Management
Strategy
Introduction PPT
Roadmap
Self Introduction
Timelines
Process
Marketing
Agenda
Technology
Medical
Startup Business Plan
Cyber Security
Dashboards
SWOT
Proposals
Education
Pitch Deck
Digital Marketing
KPIs
Project Management
Product Management
Artificial Intelligence
Target Market
Communication
Supply Chain
Google Slides
Research Services
 One Pagers
All Categories
-
Home
- Customer Favorites
- Organizational Chart
Organizational Chart
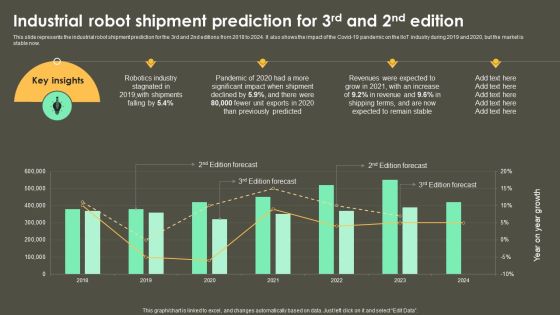
Iot Integration In Manufacturing Industrial Robot Shipment Prediction For 3Rd And 2Nd Edition Themes PDF
This slide represents the industrial robot shipment prediction for the 3rd and 2nd editions from 2018 to 2024. It also shows the impact of the Covid-19 pandemic on the IIoT industry during 2019 and 2020, but the market is stable now. This Iot Integration In Manufacturing Industrial Robot Shipment Prediction For 3Rd And 2Nd Edition Themes PDF from Slidegeeks makes it easy to present information on your topic with precision. It provides customization options, so you can make changes to the colors, design, graphics, or any other component to create a unique layout. It is also available for immediate download, so you can begin using it right away. Slidegeeks has done good research to ensure that you have everything you need to make your presentation stand out. Make a name out there for a brilliant performance.
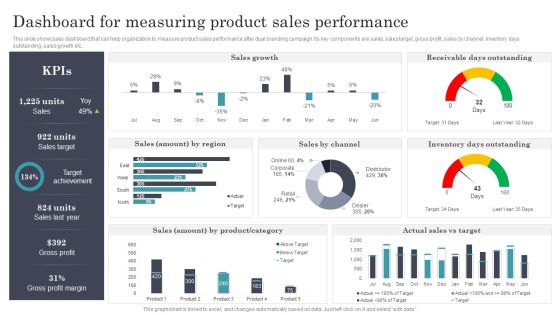
Developing Dual Branding Campaign For Brand Marketing Dashboard For Measuring Product Sales Performance Clipart PDF
This slide showcases dashboard that can help organization to measure product sales performance after dual branding campaign. Its key components are sales, sales target, gross profit, sales by channel, inventory days outstanding, sales growth etc. Create an editable Developing Dual Branding Campaign For Brand Marketing Dashboard For Measuring Product Sales Performance Clipart PDF that communicates your idea and engages your audience. Whether you are presenting a business or an educational presentation, pre designed presentation templates help save time. Developing Dual Branding Campaign For Brand Marketing Dashboard For Measuring Product Sales Performance Clipart PDF is highly customizable and very easy to edit, covering many different styles from creative to business presentations. Slidegeeks has creative team members who have crafted amazing templates. So, go and get them without any delay.

Employing Candidate Using Internal And External Mediums Of Recruitment Dashboard To Analyze Application Clipart PDF
This slide showcases dashboard that can help organization to evaluate average days taken to hire a candidate and major sources of application. It also showcases various other components which are open positions, candidates place, avg commission rate, reasons for candidate and client decline. From laying roadmaps to briefing everything in detail, our templates are perfect for you. You can set the stage with your presentation slides. All you have to do is download these easy to edit and customizable templates. Employing Candidate Using Internal And External Mediums Of Recruitment Dashboard To Analyze Application Clipart PDF will help you deliver an outstanding performance that everyone would remember and praise you for. Do download this presentation today.
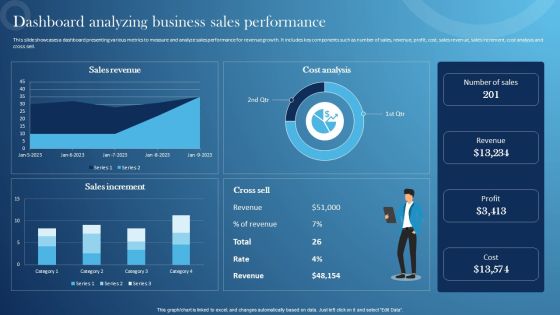
Inspecting Sales Optimization Areas Dashboard Analyzing Business Sales Performance Slides PDF
This slide showcases a dashboard presenting various metrics to measure and analyze sales performance for revenue growth. It includes key components such as number of sales, revenue, profit, cost, sales revenue, sales increment, cost analysis and cross sell. Create an editable Inspecting Sales Optimization Areas Dashboard Analyzing Business Sales Performance Slides PDF that communicates your idea and engages your audience. Whether youre presenting a business or an educational presentation, pre-designed presentation templates help save time. Inspecting Sales Optimization Areas Dashboard Analyzing Business Sales Performance Slides PDF is highly customizable and very easy to edit, covering many different styles from creative to business presentations. Slidegeeks has creative team members who have crafted amazing templates. So, go and get them without any delay.
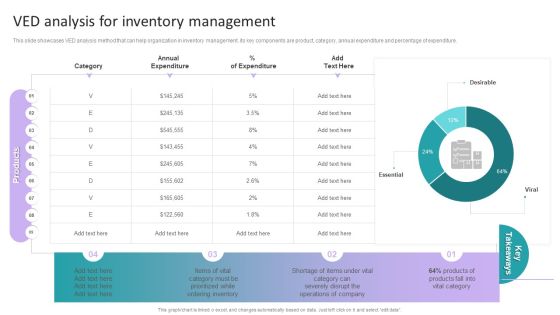
Stock Inventory Acquisition VED Analysis For Inventory Management Summary PDF
This slide showcases VED analysis method that can help organization in inventory management. its key components are product, category, annual expenditure and percentage of expenditure. Do you have to make sure that everyone on your team knows about any specific topic I yes, then you should give Stock Inventory Acquisition VED Analysis For Inventory Management Summary PDF a try. Our experts have put a lot of knowledge and effort into creating this impeccable Stock Inventory Acquisition VED Analysis For Inventory Management Summary PDF. You can use this template for your upcoming presentations, as the slides are perfect to represent even the tiniest detail. You can download these templates from the Slidegeeks website and these are easy to edit. So grab these today.
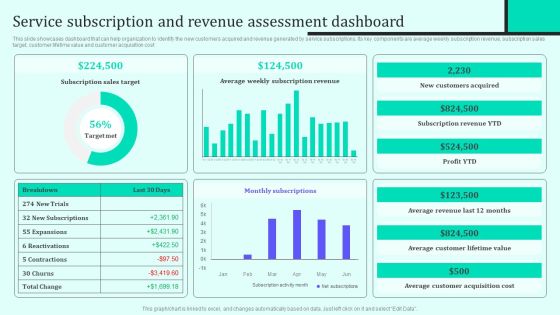
Implementing New Sales And Marketing Process For Services Service Subscription And Revenue Assessment Infographics PDF
This slide showcases dashboard that can help organization to identify the new customers acquired and revenue generated by service subscriptions. Its key components are average weekly subscription revenue, subscription sales target, customer lifetime value and customer acquisition cost. Do you have to make sure that everyone on your team knows about any specific topic I yes, then you should give Implementing New Sales And Marketing Process For Services Service Subscription And Revenue Assessment Infographics PDF a try. Our experts have put a lot of knowledge and effort into creating this impeccable Implementing New Sales And Marketing Process For Services Service Subscription And Revenue Assessment Infographics PDF. You can use this template for your upcoming presentations, as the slides are perfect to represent even the tiniest detail. You can download these templates from the Slidegeeks website and these are easy to edit. So grab these today.
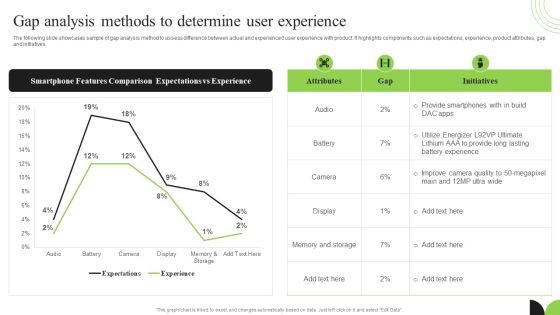
Guidebook For Executing Business Market Intelligence Gap Analysis Methods To Determine Infographics PDF
The following slide showcases sample of gap analysis method to assess difference between actual and experienced user experience with product. It highlights components such as expectations, experience, product attributes, gap and initiatives. Create an editable Guidebook For Executing Business Market Intelligence Gap Analysis Methods To Determine Infographics PDF that communicates your idea and engages your audience. Whether you are presenting a business or an educational presentation, pre designed presentation templates help save time. Guidebook For Executing Business Market Intelligence Gap Analysis Methods To Determine Infographics PDF is highly customizable and very easy to edit, covering many different styles from creative to business presentations. Slidegeeks has creative team members who have crafted amazing templates. So, go and get them without any delay.
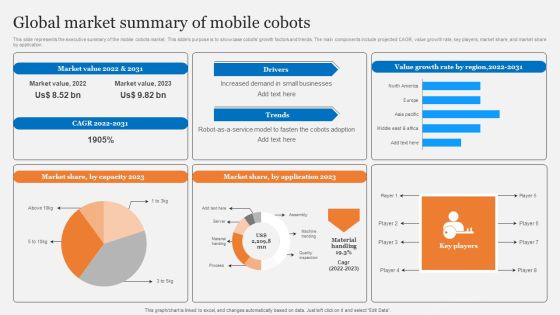
Cobots Usecases In Different Sectors Global Market Summary Of Mobile Cobots Structure PDF
This slide represents the executive summary of the mobile cobots market. This slides purpose is to showcase cobots growth factors and trends. The main components include projected CAGR, value growth rate, key players, market share, and market share by application. Do you have to make sure that everyone on your team knows about any specific topic I yes, then you should give Cobots Usecases In Different Sectors Global Market Summary Of Mobile Cobots Structure PDF a try. Our experts have put a lot of knowledge and effort into creating this impeccable Cobots Usecases In Different Sectors Global Market Summary Of Mobile Cobots Structure PDF. You can use this template for your upcoming presentations, as the slides are perfect to represent even the tiniest detail. You can download these templates from the Slidegeeks website and these are easy to edit. So grab these today.

Financial Kpi Dashboard To Evaluate Fundraising Impact Topics PDF
This slide showcases dashboard that can help organization to evaluate key changes in financial KPIs post fundraising. Its key components are net profit margin, revenue, gross profit margin, debt to equity and return on equity. Do you have to make sure that everyone on your team knows about any specific topic I yes, then you should give Financial Kpi Dashboard To Evaluate Fundraising Impact Topics PDF a try. Our experts have put a lot of knowledge and effort into creating this impeccable Financial Kpi Dashboard To Evaluate Fundraising Impact Topics PDF. You can use this template for your upcoming presentations, as the slides are perfect to represent even the tiniest detail. You can download these templates from the Slidegeeks website and these are easy to edit. So grab these today.

Coffee Cafe Company Profile Annual Business Revenue Showing Yearly Growth Sample PDF
Mentioned slide provided information about ten years company annual revenue growth and decline which further provided insights into business growth. It includes key component such as revenue in USD doller billion, and years. Create an editable Coffee Cafe Company Profile Annual Business Revenue Showing Yearly Growth Sample PDF that communicates your idea and engages your audience. Whether youre presenting a business or an educational presentation, pre designed presentation templates help save time. Coffee Cafe Company Profile Annual Business Revenue Showing Yearly Growth Sample PDF is highly customizable and very easy to edit, covering many different styles from creative to business presentations. Slidegeeks has creative team members who have crafted amazing templates. So, go and get them without any delay.
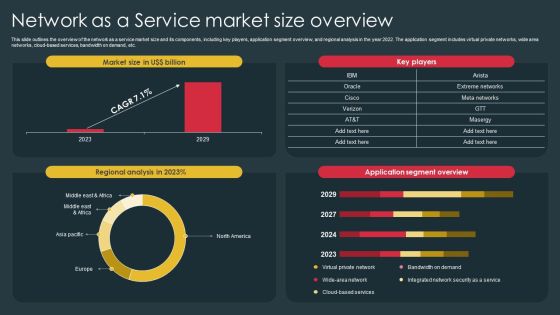
Managed Network Services Network As A Service Market Size Overview Information PDF
This slide outlines the overview of the network as a service market size and its components, including key players, application segment overview, and regional analysis in the year 2022. The application segment includes virtual private networks, wide area networks, cloud-based services, bandwidth on demand, etc. From laying roadmaps to briefing everything in detail, our templates are perfect for you. You can set the stage with your presentation slides. All you have to do is download these easy to edit and customizable templates. Managed Network Services Network As A Service Market Size Overview Information PDF will help you deliver an outstanding performance that everyone would remember and praise you for. Do download this presentation today.

Profit And Loss Account Statement Summary Of Revenue Cost And Expenses Portrait PDF
The slides provide a glimpse of the projected profit and loss statement to visualize the platforms financial performance for the next five years. The key components are total revenue from operations, gross profit, EBITDA, etc. Do you have to make sure that everyone on your team knows about any specific topic I yes, then you should give Profit And Loss Account Statement Summary Of Revenue Cost And Expenses Portrait PDF a try. Our experts have put a lot of knowledge and effort into creating this impeccable Profit And Loss Account Statement Summary Of Revenue Cost And Expenses Portrait PDF. You can use this template for your upcoming presentations, as the slides are perfect to represent even the tiniest detail. You can download these templates from the Slidegeeks website and these are easy to edit. So grab these today.
Monthly Sales Performance Tracking And Monitoring Dashboard Sample PDF
This slide showcases a dashboard presenting various metrics to measure and analyze sales performance for revenue growth. It includes key components such as number of sales, revenue, profit, cost, sales revenue, sales increment, cost analysis and cross sell. Do you have to make sure that everyone on your team knows about any specific topic I yes, then you should give Monthly Sales Performance Tracking And Monitoring Dashboard Sample PDF a try. Our experts have put a lot of knowledge and effort into creating this impeccable Monthly Sales Performance Tracking And Monitoring Dashboard Sample PDF. You can use this template for your upcoming presentations, as the slides are perfect to represent even the tiniest detail. You can download these templates from the Slidegeeks website and these are easy to edit. So grab these today.

Texting Platforms Dashboard Indicating SMS Marketing Metrics Designs PDF
This slide showcase messaging platforms dashboard indicating sms marketing metrics which can be referred by businesses to check the activity of their current texting campaign. It contains information about consumers, plan, send, campaigns, growth, reports, outgoing and incoming.Pitch your topic with ease and precision using this texting platforms dashboard indicating sms marketing metrics designs pdf This layout presents information on texting platforms dashboard indicating sms marketing metrics It is also available for immediate download and adjustment. So, changes can be made in the color, design, graphics or any other component to create a unique layout.
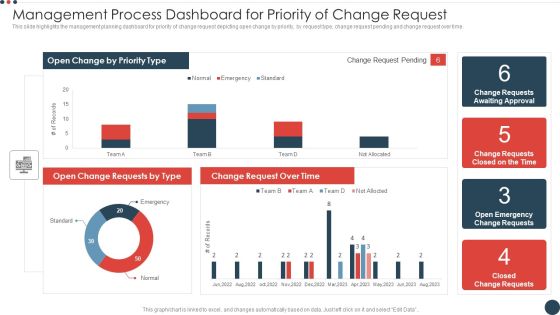
Management Process Dashboard For Priority Of Change Request Demonstration PDF
This slide highlights the management planning dashboard for priority of change request depicting open change by priority, by request type, change request pending and change request over time. Pitch your topic with ease and precision using this management process dashboard for priority of change request demonstration pdf. This layout presents information on management process dashboard for priority of change request. It is also available for immediate download and adjustment. So, changes can be made in the color, design, graphics or any other component to create a unique layout.

Monitoring Monthly Change Implementation Management Process Summary PDF
This slide highlights the monthly change management plan monitoring by showing open change request due next week and due next 30 days, assigned open request and change request by status. Pitch your topic with ease and precision using this monitoring monthly change implementation management process summary pdf. This layout presents information on monitoring monthly change implementation management process. It is also available for immediate download and adjustment. So, changes can be made in the color, design, graphics or any other component to create a unique layout.
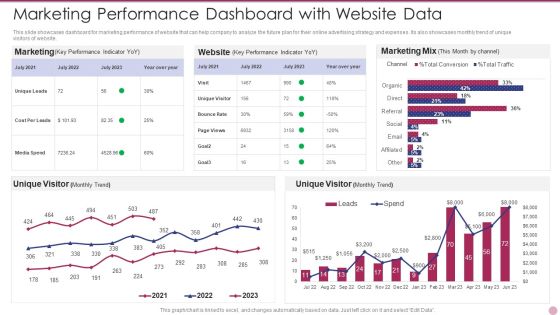
Marketing Performance Dashboard With Website Data Elements PDF
This slide showcases dashboard for marketing performance of website that can help company to analyze the future plan for their online advertising strategy and expenses. Its also showcases monthly trend of unique visitors of website. Pitch your topic with ease and precision using this Marketing Performance Dashboard With Website Data Elements PDF. This layout presents information on Marketing Performance Dashboard With Website Data. It is also available for immediate download and adjustment. So, changes can be made in the color, design, graphics or any other component to create a unique layout.

Cyber Intelligence Risk Assessment Dashboard With Heat Map Portrait PDF
This slide exhibits risk rating breakdown and heat map for analyzing current cyber security measures effectiveness. It covers top 5 vulnerabilities and clients under scrutiny. Pitch your topic with ease and precision using this Cyber Intelligence Risk Assessment Dashboard With Heat Map Portrait PDF This layout presents information on Risk Rating Breakdown, Action Plan Breakdown, Risk Possibility It is also available for immediate download and adjustment. So, changes can be made in the color, design, graphics or any other component to create a unique layout.
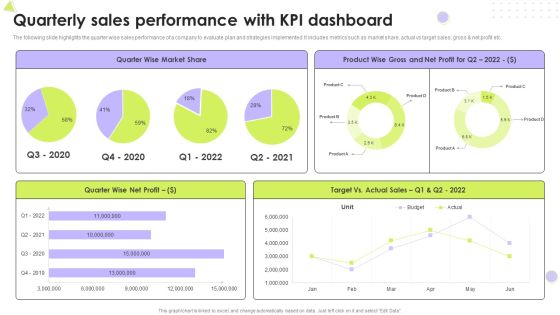
Quarterly Sales Performance With Kpi Dashboard Introduction PDF
The following slide highlights the quarter wise sales performance of a company to evaluate plan and strategies implemented. It includes metrics such as market share, actual vs target sales, gross and net profit etc. Pitch your topic with ease and precision using this Quarterly Sales Performance With Kpi Dashboard Introduction PDF. This layout presents information on Market Share, Net Profit, Target. It is also available for immediate download and adjustment. So, changes can be made in the color, design, graphics or any other component to create a unique layout.
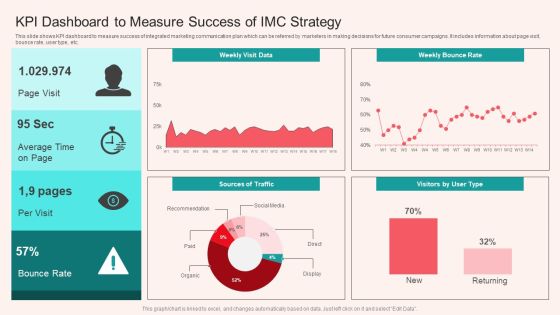
KPI Dashboard To Measure Success Of IMC Strategy Microsoft PDF
This slide shows KPI dashboard to measure success of integrated marketing communication plan which can be referred by marketers in making decisions for future consumer campaigns. It includes information about page visit, bounce rate, user type, etc. Pitch your topic with ease and precision using this KPI Dashboard To Measure Success Of IMC Strategy Microsoft PDF. This layout presents information on Average, Bounce Rate. It is also available for immediate download and adjustment. So, changes can be made in the color, design, graphics or any other component to create a unique layout.
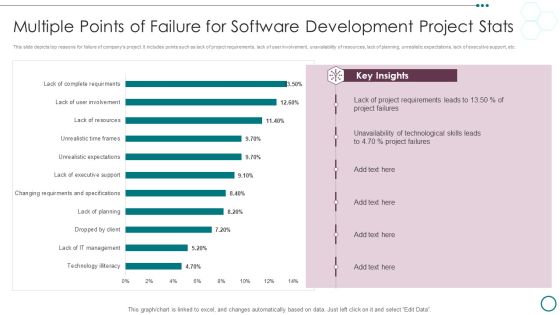
Multiple Points Of Failure For Software Development Project Stats Ppt PowerPoint Presentation Infographics Slides PDF
This slide depicts top reasons for failure of companys project. It includes points such as lack of project requirements, lack of user involvement, unavailability of resources, lack of planning, unrealistic expectations, lack of executive support, etc.Pitch your topic with ease and precision using this Multiple Points Of Failure For Software Development Project Stats Ppt PowerPoint Presentation Infographics Slides PDF. This layout presents information on Project Requirements, Unavailability Technological, Project Failures. It is also available for immediate download and adjustment. So, changes can be made in the color, design, graphics or any other component to create a unique layout.

Project Metrics Dashboard For Software Development Designs PDF
This slide shows the project management dashboard for developing software which focuses on health status such as time, cost, workload, risks, issues and changes with comparison of actual and planned expenses with budget. It also shows the risks, issues ad changes. Pitch your topic with ease and precision using this Project Metrics Dashboard For Software Development Designs PDF. This layout presents information on Risks, Budget, Cost. It is also available for immediate download and adjustment. So, changes can be made in the color, design, graphics or any other component to create a unique layout.
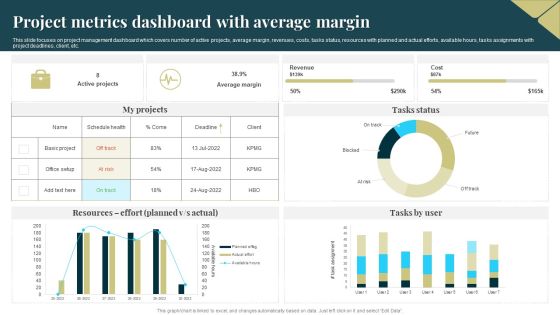
Project Metrics Dashboard With Average Margin Sample PDF
This slide focuses on project management dashboard which covers number of active projects, average margin, revenues, costs, tasks status, resources with planned and actual efforts, available hours, tasks assignments with project deadlines, client, etc. Pitch your topic with ease and precision using this Project Metrics Dashboard With Average Margin Sample PDF. This layout presents information on Average Margin, Revenue, Cost. It is also available for immediate download and adjustment. So, changes can be made in the color, design, graphics or any other component to create a unique layout.

Project Metrics Dashboard With Stages Download PDF
This slide shows the project management dashboard which includes start and end date if project, its duration, status of the project, key project links and project stages with metrics such as proposal, kick off, discovery, actions, optimization , etc. Pitch your topic with ease and precision using this Project Metrics Dashboard With Stages Download PDF. This layout presents information on Economic, Project Plan, Execution. It is also available for immediate download and adjustment. So, changes can be made in the color, design, graphics or any other component to create a unique layout.
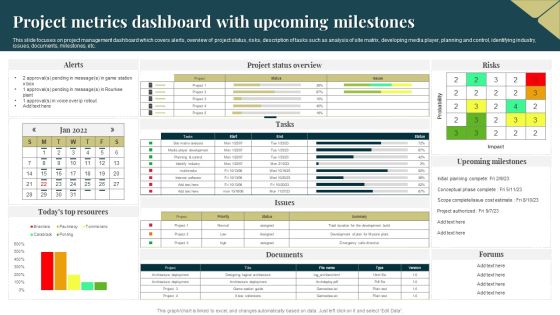
Project Metrics Dashboard With Upcoming Milestones Demonstration PDF
This slide focuses on project management dashboard which covers alerts, overview of project status, risks, description of tasks such as analysis of site matrix, developing media player, planning and control, identifying industry, issues, documents, milestones, etc. Pitch your topic with ease and precision using this Project Metrics Dashboard With Upcoming Milestones Demonstration PDF. This layout presents information on Probability, Project, Risks. It is also available for immediate download and adjustment. So, changes can be made in the color, design, graphics or any other component to create a unique layout.
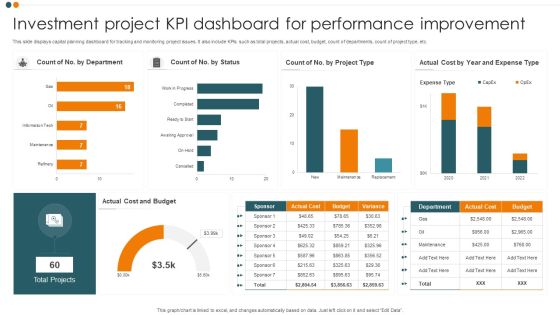
Investment Project KPI Dashboard For Performance Improvement Guidelines PDF
This slide displays capital planning dashboard for tracking and monitoring project issues. It also include KPIs such as total projects, actual cost, budget, count of departments, count of project type, etc. Pitch your topic with ease and precision using this Investment Project KPI Dashboard For Performance Improvement Guidelines PDF. This layout presents information on Cost And Budget, Total Projects, Expense Type. It is also available for immediate download and adjustment. So, changes can be made in the color, design, graphics or any other component to create a unique layout.

Investment Project Performance Analysis KPI Dashboard Professional PDF
This slide showcases KPI dashboard for project planning and resource allocation. It also include metrics such as invested amount, return amount, NPV, return to investor, annualized IRR, ROI, payback period, etc. Pitch your topic with ease and precision using this Investment Project Performance Analysis KPI Dashboard Professional PDF. This layout presents information on Project Cash Flows, Project Performance, Innovation Lab. It is also available for immediate download and adjustment. So, changes can be made in the color, design, graphics or any other component to create a unique layout.

Project KPI Dashboard To Monitor Financial Evaluation Background PDF
This slide signifies the construction project management projection plan. It covers information regarding to the estimate ID, Task, effort hours, resource quantity, performance factor and duration evaluation. Pitch your topic with ease and precision using this Project KPI Dashboard To Monitor Financial Evaluation Background PDF. This layout presents information on Actual Expenses, Payable Account, Budget Allocated. It is also available for immediate download and adjustment. So, changes can be made in the color, design, graphics or any other component to create a unique layout.

Five Element Disaster Threat Recovery Status Ppt Outline Inspiration PDF
The below slide presents the disaster risk recovery plan status to have quick insight of vulnerabilities. It includes elements such as systems, services, staff, supplier, sites along with the disruptions and corrective actions. Pitch your topic with ease and precision using this Five Element Disaster Threat Recovery Status Ppt Outline Inspiration PDF. This layout presents information on Health Status, Disruptions, Gaps. It is also available for immediate download and adjustment. So, changes can be made in the color, design, graphics or any other component to create a unique layout.
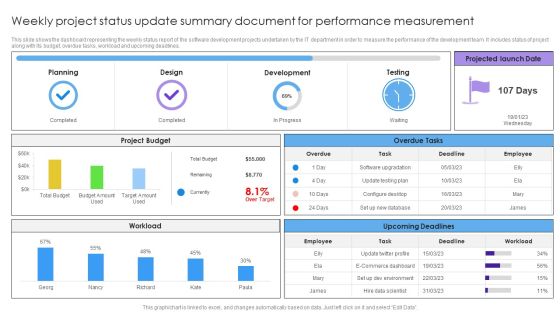
Weekly Project Status Update Summary Document For Performance Measurement Mockup PDF
This slide shows the dashboard representing the weekly status report of the software development projects undertaken by the IT department in order to measure the performance of the development team. It includes status of project along with its budget, overdue tasks, workload and upcoming deadlines. Pitch your topic with ease and precision using this Weekly Project Status Update Summary Document For Performance Measurement Mockup PDF. This layout presents information on Planning, Design, Development, Testing. It is also available for immediate download and adjustment. So, changes can be made in the color, design, graphics or any other component to create a unique layout.

Public Cloud Service Adoption For Enterprises Ppt Inspiration Graphic Images PDF
This slide depicts adoption of different cloud services in multiple enterprises. It includes services of AWS, Azure, Google Cloud, oracle infrastructure cloud, Vmare Cloud, IBM public cloud, Alibaba cloud. Pitch your topic with ease and precision using this Public Cloud Service Adoption For Enterprises Ppt Inspiration Graphic Images PDF. This layout presents information on Planning Migration, Alibaba Cloud, IBM Public Cloud. It is also available for immediate download and adjustment. So, changes can be made in the color, design, graphics or any other component to create a unique layout.

Organization Demand Administration KPI Dashboard Designs PDF
The following slide represents some kpis to plan further sales and manufacturing processes. It includes elements such as total inventory cost, anticipated surplus stock, out of stock value, slow moving inventory value etc. Pitch your topic with ease and precision using this Organization Demand Administration KPI Dashboard Designs PDF. This layout presents information on Anticipated Surplus Stock, Out Of Stock, Slow Moving Inventory. It is also available for immediate download and adjustment. So, changes can be made in the color, design, graphics or any other component to create a unique layout.
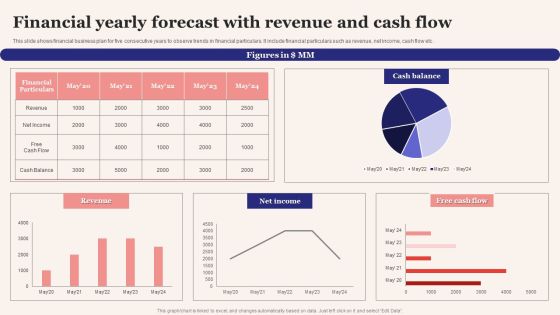
Financial Yearly Forecast With Revenue And Cash Flow Formats PDF
This slide shows financial business plan for five consecutive years to observe trends in financial particulars. It include financial particulars such as revenue, net income, cash flow etc. Pitch your topic with ease and precision using this Financial Yearly Forecast With Revenue And Cash Flow Formats PDF. This layout presents information on Financial Particulars, Cash Balance, Free Cash Flow. It is also available for immediate download and adjustment. So, changes can be made in the color, design, graphics or any other component to create a unique layout.

Quarterly SEO Metrics Of Content Review Structure PDF
The following slide depicts the key metrics to audit website content and invest in plan. It includes monthly page views along with insights such as words, shares, backlinks, average time spent on page, bounce rate etc. Pitch your topic with ease and precision using this Quarterly SEO Metrics Of Content Review Structure PDF. This layout presents information on Quarterly SEO, Metrics Of Content Review. It is also available for immediate download and adjustment. So, changes can be made in the color, design, graphics or any other component to create a unique layout.
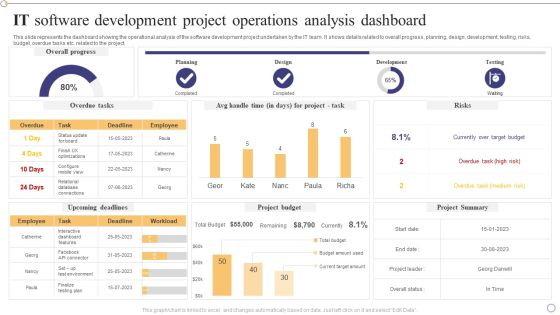
IT Software Development Project Operations Analysis Dashboard Pictures PDF
This slide represents the dashboard showing the operational analysis of the software development project undertaken by the IT team. It shows details related to overall progress, planning, design, development, testing, risks, budget, overdue tasks etc. related to the project.Pitch your topic with ease and precision using this IT Software Development Project Operations Analysis Dashboard Pictures PDF. This layout presents information on Interactive Dashboard, Currently Over Target, Overdue Task. It is also available for immediate download and adjustment. So, changes can be made in the color, design, graphics or any other component to create a unique layout.

Dashboard For Tracking Progress Of Media Relations Management Strategies Slides PDF
This slide provides dashboard showcasing impact of media relations plan which helps track campaign performance. It provides information regarding consumer engagement, bounce rate, lead generation, conversion rates and top channels used. Pitch your topic with ease and precision using this Dashboard For Tracking Progress Of Media Relations Management Strategies Slides PDF. This layout presents information on Dashboard For Tracking, Progress Of Media, Relations Management Strategies. It is also available for immediate download and adjustment. So, changes can be made in the color, design, graphics or any other component to create a unique layout.
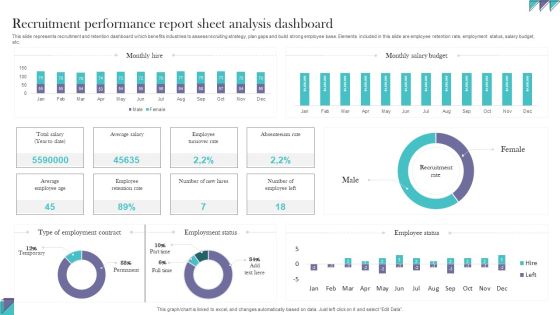
Recruitment Performance Report Sheet Analysis Dashboard Information PDF
This slide represents recruitment and retention dashboard which benefits industries to assess recruiting strategy, plan gaps and build strong employee base. Elements included in this slide are employee retention rate, employment status, salary budget, etc. Pitch your topic with ease and precision using this Recruitment Performance Report Sheet Analysis Dashboard Information PDF. This layout presents information onRecruitment Performance, Report Sheet Analysis. It is also available for immediate download and adjustment. So, changes can be made in the color, design, graphics or any other component to create a unique layout.
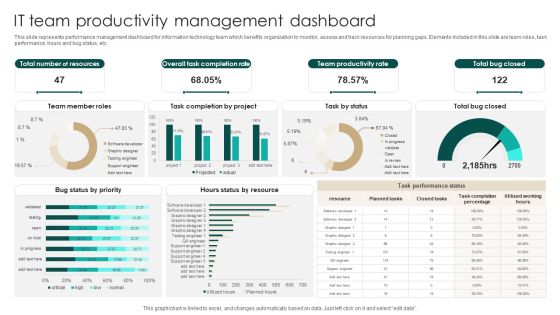
IT Team Productivity Management Dashboard Introduction PDF
This slide represents performance management dashboard for information technology team which benefits organization to monitor, assess and track resources for planning gaps. Elements included in this slide are team roles, task performance, hours and bug status, etc. Pitch your topic with ease and precision using this IT Team Productivity Management Dashboard Introduction PDF. This layout presents information on Total Number Resources, Overall Task Completion Rate, Team Productivity Rate. It is also available for immediate download and adjustment. So, changes can be made in the color, design, graphics or any other component to create a unique layout.
Tracking School Communication Strategy Performance Rules PDF
The following slide highlights tracking performance of school communication plan. It includes parameters such as parents satisfaction with guidance and resources provided by schools, parents want teachers to reduce frequency of contacting them, parents want teachers to communicate more often etc. Pitch your topic with ease and precision using this Tracking School Communication Strategy Performance Rules PDF. This layout presents information on Strongly Agree, Agree, Improved Methods. It is also available for immediate download and adjustment. So, changes can be made in the color, design, graphics or any other component to create a unique layout.

Quarterly Cost Variance Analysis With Maintenance Metrics Dashboard Information PDF
The following slide depicts a maintenance KPI dashboard to have useful insights for effective decision making. It includes key performance areas such as quarterly cost variance, scrap, quarterly run time variance analysis etc. Pitch your topic with ease and precision using this Quarterly Cost Variance Analysis With Maintenance Metrics Dashboard Information PDF. This layout presents information on Production, Budgeted Cost, Planned Run Time, Actual Run Time. It is also available for immediate download and adjustment. So, changes can be made in the color, design, graphics or any other component to create a unique layout.
Tracker For Time Based Quality Kpis In Project Management Ideas PDF
This slide displays project wise comparative analysis on the basis of planned and actual time it takes for completion. It includes details such as number of tasks and work completed, average number of hours, start and end dates, etc. Pitch your topic with ease and precision using this Tracker For Time Based Quality Kpis In Project Management Ideas PDF. This layout presents information on Time, Work Completed, Avg Number, Hours Per Task. It is also available for immediate download and adjustment. So, changes can be made in the color, design, graphics or any other component to create a unique layout.
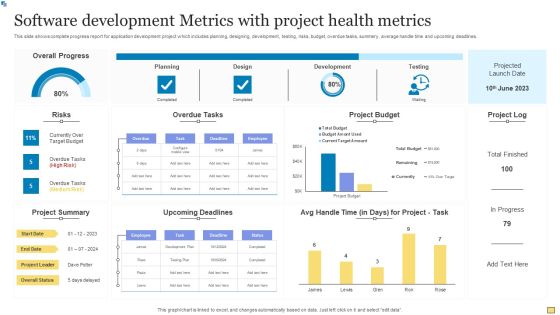
Software Development Metrics With Project Health Metrics Graphics PDF
This slide shows complete progress report for application development project which includes planning, designing, development, testing, risks, budget, overdue tasks, summery, average handle time and upcoming deadlines. Pitch your topic with ease and precision using this Software Development Metrics With Project Health Metrics Graphics PDF. This layout presents information on Overall Progress, Overdue Tasks, Project Budget. It is also available for immediate download and adjustment. So, changes can be made in the color, design, graphics or any other component to create a unique layout.

Hotel Property Administration Software Dashboard Guidelines PDF
This slide showcases HPMS dashboard. The purpose of this dashboard is to access plan and performance. It includes key elements such as current in house, expected arrivals, expected departures, current status and room status. Pitch your topic with ease and precision using this Hotel Property Administration Software Dashboard Guidelines PDF. This layout presents information on Current Status, Room Status, Exchange Rates. It is also available for immediate download and adjustment. So, changes can be made in the color, design, graphics or any other component to create a unique layout.

Continuous Process Improvement KPI Dashboard For IT Industry Clipart PDF
Following slide depicts the IT industry KPI dashboard which will assist in generating more of profit by improving strategic plan according to changing environment with clients preferences .The KPI mentioned in a slide are such as risk analysis, outstanding task , upcoming task, budget analysis, etc. Pitch your topic with ease and precision using this Continuous Process Improvement KPI Dashboard For IT Industry Clipart PDF. This layout presents information on Overall Progress, Risk Analysis, Budget Analysis. It is also available for immediate download and adjustment. So, changes can be made in the color, design, graphics or any other component to create a unique layout.

Lean Operational Excellence Strategy Dashboard To Track And Monitor Project Performance Slides PDF
This slide showcases dashboard which tracks project stages and monitors budget spends and other KPIs. Key project stages included here are overdue tasks, upcoming deadlines, project completion stage, workload factors, etc. Pitch your topic with ease and precision using this Lean Operational Excellence Strategy Dashboard To Track And Monitor Project Performance Slides PDF. This layout presents information on Planning, Design, Development. It is also available for immediate download and adjustment. So, changes can be made in the color, design, graphics or any other component to create a unique layout.

Lean Operational Excellence Strategy Manufacturing Dashboard To Check Production System Efficiency Pictures PDF
This slide showcases manufacturing dashboard to track KPIs defined under lean and kaizen process improvement plans. Key performance metrics included here are TEEP, OEE, loading time, production quality, losses by hours, losses by categories etc. Pitch your topic with ease and precision using this Lean Operational Excellence Strategy Manufacturing Dashboard To Check Production System Efficiency Pictures PDF. This layout presents information on Loading, Availability, Performance. It is also available for immediate download and adjustment. So, changes can be made in the color, design, graphics or any other component to create a unique layout.

Market Competitor Cost Analysis Dashboard Graphics PDF
The slide showcases a dashboard for analyzing own and competitors product pricing strategies to formulate effective valuation plan. It includes key elements such as low priced, equally priced, high priced, overpriced products, competitors current price, etc. Pitch your topic with ease and precision using this Market Competitor Cost Analysis Dashboard Graphics PDF. This layout presents information on Average, Product Model, Cost Analysis Dashboard. It is also available for immediate download and adjustment. So, changes can be made in the color, design, graphics or any other component to create a unique layout.

Budget Strategy For Annual Campaign Marketing Guidelines PDF
This slide exhibits budget plan to analyze expense incurred every month for the whole year . It includes campaigns such as brand promotion, Facebook participation, event invites, business culture etc. Pitch your topic with ease and precision using this Budget Strategy For Annual Campaign Marketing Guidelines PDF. This layout presents information on Budget Expense, Key Insights, Marketing. It is also available for immediate download and adjustment. So, changes can be made in the color, design, graphics or any other component to create a unique layout.

Monitor Project Budget Cost And Expense Dashboard Brochure PDF
Following slides shows mmonitoring project costs and expenses in the dashboard which will assist in planning and maintain budgeted according to requirement. It includes KPI such as task status, cost incurred ,workload , etc. Pitch your topic with ease and precision using this Monitor Project Budget Cost And Expense Dashboard Brochure PDF. This layout presents information on Expense Dashboard, Monitor Project Budget Cost. It is also available for immediate download and adjustment. So, changes can be made in the color, design, graphics or any other component to create a unique layout.
Employee Training Status KPI Dashboard With Budget Summary PDF
This slide consists of a dashboard to track employee annual training status in order to update the plan for next year. It includes elements such as training number, total hours, budget, trainee numbers, training types, etc. Pitch your topic with ease and precision using this Employee Training Status KPI Dashboard With Budget Summary PDF. This layout presents information on Employee Training Status, KPI Dashboard With Budget. It is also available for immediate download and adjustment. So, changes can be made in the color, design, graphics or any other component to create a unique layout.

Dashboard For Dual Branding Campaign Performance Dual Branding Campaign For Product Promotion Portrait PDF
This slide showcases dashboard that can help organization to measure performance after launching dual branding campaign. Its key components are sales comparison, revenue by client, revenue by source and new customers by source.Slidegeeks is here to make your presentations a breeze with Dashboard For Dual Branding Campaign Performance Dual Branding Campaign For Product Promotion Portrait PDF With our easy-to-use and customizable templates, you can focus on delivering your ideas rather than worrying about formatting. With a variety of designs to choose from, you are sure to find one that suits your needs. And with animations and unique photos, illustrations, and fonts, you can make your presentation pop. So whether you are giving a sales pitch or presenting to the board, make sure to check out Slidegeeks first.

International Business Extension Dashboard To Analyse Sales Post Global Expansion Guidelines PDF
This slide showcase dashboard that can help organization track sales after global expansion. Its key components are sales target, target achievement, sales by channel, inventory days outstanding, sales growth, gross profit, gross profit margin etc. Are you in need of a template that can accommodate all of your creative concepts This one is crafted professionally and can be altered to fit any style. Use it with Google Slides or PowerPoint. Include striking photographs, symbols, depictions, and other visuals. Fill, move around, or remove text boxes as desired. Test out color palettes and font mixtures. Edit and save your work, or work with colleagues. Download International Business Extension Dashboard To Analyse Sales Post Global Expansion Guidelines PDF and observe how to make your presentation outstanding. Give an impeccable presentation to your group and make your presentation unforgettable.

International Business Extension Dashboard To Track Revenue After Global Expansion Introduction PDF
This slide showcase dashboard that can help organization track revenue after global expansion. Its key components are average revenue per customer, customer acquisition cost, customer lifetime value and new customers acquired. Crafting an eye-catching presentation has never been more straightforward. Let your presentation shine with this tasteful yet straightforward International Business Extension Dashboard To Track Revenue After Global Expansion Introduction PDF template. It offers a minimalistic and classy look that is great for making a statement. The colors have been employed intelligently to add a bit of playfulness while still remaining professional. Construct the ideal International Business Extension Dashboard To Track Revenue After Global Expansion Introduction PDF that effortlessly grabs the attention of your audience Begin now and be certain to wow your customers.

Enhancing Customer Outreach Service Subscription And Revenue Assessment Summary PDF
This slide showcases dashboard that can help organization to identify the new customers acquired and revenue generated by service subscriptions. Its key components are average weekly subscription revenue, subscription sales target, customer lifetime value and customer acquisition cost. This modern and well-arranged Enhancing Customer Outreach Service Subscription And Revenue Assessment Summary PDF provides lots of creative possibilities. It is very simple to customize and edit with the Powerpoint Software. Just drag and drop your pictures into the shapes. All facets of this template can be edited with Powerpoint, no extra software is necessary. Add your own material, put your images in the places assigned for them, adjust the colors, and then you can show your slides to the world, with an animated slide included.

Assessing International Market Dashboard To Analyse Sales Post Global Expansion Elements PDF
This slide showcase dashboard that can help organization track sales after global expansion. Its key components are sales target, target achievement, sales by channel, inventory days outstanding, sales growth, gross profit, gross profit margin etc. Are you in need of a template that can accommodate all of your creative concepts This one is crafted professionally and can be altered to fit any style. Use it with Google Slides or PowerPoint. Include striking photographs, symbols, depictions, and other visuals. Fill, move around, or remove text boxes as desired. Test out color palettes and font mixtures. Edit and save your work, or work with colleagues. Download Assessing International Market Dashboard To Analyse Sales Post Global Expansion Elements PDF and observe how to make your presentation outstanding. Give an impeccable presentation to your group and make your presentation unforgettable.

Employing Candidate Using Internal And External Mediums Of Recruitment Dashboard To Identify Open Positions Microsoft PDF
This slide showcases dashboard that can help organization to identify open positions in organization after conducting recruitment and offer acceptance ratio of candidates. It also showcases various other components which are shorlisted candidates, hired candidates, time to hire, cost to hire, applications details. Present like a pro with Employing Candidate Using Internal And External Mediums Of Recruitment Dashboard To Identify Open Positions Microsoft PDF Create beautiful presentations together with your team, using our easy to use presentation slides. Share your ideas in real time and make changes on the fly by downloading our templates. So whether you are in the office, on the go, or in a remote location, you can stay in sync with your team and present your ideas with confidence. With Slidegeeks presentation got a whole lot easier. Grab these presentations today.

Assessing Debt And Equity Fundraising Alternatives For Business Growth Financial KPI Dashboard To Evaluate Infographics PDF
This slide showcases dashboard that can help organization to evaluate key changes in financial kpis post fundraising. Its key components are net profit margin, revenue, gross profit margin, debt to equity and return on equity. This Assessing Debt And Equity Fundraising Alternatives For Business Growth Financial KPI Dashboard To Evaluate Infographics PDF is perfect for any presentation, be it in front of clients or colleagues. It is a versatile and stylish solution for organizing your meetings. TheAssessing Debt And Equity Fundraising Alternatives For Business Growth Financial KPI Dashboard To Evaluate Infographics PDF features a modern design for your presentation meetings. The adjustable and customizable slides provide unlimited possibilities for acing up your presentation. Slidegeeks has done all the homework before launching the product for you. So, do not wait, grab the presentation templates today
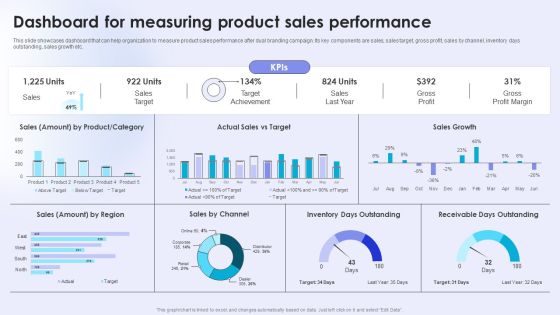
Dual Branding Campaign To Boost Sales Of Product Or Services Dashboard For Measuring Product Sales Elements PDF
This slide showcases dashboard that can help organization to measure product sales performance after dual branding campaign. Its key components are sales, sales target, gross profit, sales by channel, inventory days outstanding, sales growth etc. The Dual Branding Campaign To Boost Sales Of Product Or Services Dashboard For Measuring Product Sales Elements PDF is a compilation of the most recent design trends as a series of slides. It is suitable for any subject or industry presentation, containing attractive visuals and photo spots for businesses to clearly express their messages. This template contains a variety of slides for the user to input data, such as structures to contrast two elements, bullet points, and slides for written information. Slidegeeks is prepared to create an impression.

Enterprise Risk Management Market Analysis Report Introduction To ERM Clipart PDF
This slide represents the report to analyze the market growth rate and market size of enterprise risk management market. It includes details related to market size, key players, regional analysis and components segment overview of enterprise risk management market.Get a simple yet stunning designed Enterprise Risk Management Market Analysis Report Introduction To ERM Clipart PDF. It is the best one to establish the tone in your meetings. It is an excellent way to make your presentations highly effective. So, download this PPT today from Slidegeeks and see the positive impacts. Our easy-to-edit Enterprise Risk Management Market Analysis Report Introduction To ERM Clipart PDF can be your go-to option for all upcoming conferences and meetings. So, what are you waiting for Grab this template today.

Developing Recruitment Dashboard To Analyze Application Sources And Days To Hire Clipart PDF
This slide showcases dashboard that can help organization to evaluate average days taken to hire a candidate and major sources of application. It also showcases various other components which are open positions, candidates place, avg commission rate, reasons for candidate and client decline. Get a simple yet stunning designed Developing Recruitment Dashboard To Analyze Application Sources And Days To Hire Clipart PDF. It is the best one to establish the tone in your meetings. It is an excellent way to make your presentations highly effective. So, download this PPT today from Slidegeeks and see the positive impacts. Our easy-to-edit Developing Recruitment Dashboard To Analyze Application Sources And Days To Hire Clipart PDF can be your go-to option for all upcoming conferences and meetings. So, what are you waiting for Grab this template today.
