Organizational Change
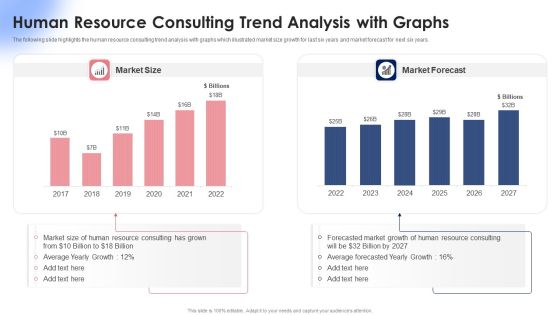
Human Resource Consulting Trend Analysis With Graphs Ppt Summary Clipart Images PDF
The following slide highlights the human resource consulting trend analysis with graphs which illustrated market size growth for last six years and market forecast for next six years. Pitch your topic with ease and precision using this Human Resource Consulting Trend Analysis With Graphs Ppt Summary Clipart Images PDF. This layout presents information on Market Size, Market Forecast, 2017 To 2022. It is also available for immediate download and adjustment. So, changes can be made in the color, design, graphics or any other component to create a unique layout.

Enterprise Quarterly Income And Expenditure Performance Chart Graphics PDF
This slide depicts total income and expenses incurred annually. It represents the value of the income to expenses for each pair of bars, by quarter and variance is the profit earned. Pitch your topic with ease and precision using this Enterprise Quarterly Income And Expenditure Performance Chart Graphics PDF. This layout presents information on Expenses Surpassed Income, Sales, Huge Profit. It is also available for immediate download and adjustment. So, changes can be made in the color, design, graphics or any other component to create a unique layout.

Trend Of Quarterly Funding For Start Up Project Performance Chart Graphics PDF
This slide depicts investment made in different start up projects for 2 years. It also includes the investment amount, funding quarters in graphical form with a trend line and insights. Pitch your topic with ease and precision using this Trend Of Quarterly Funding For Start Up Project Performance Chart Graphics PDF. This layout presents information on Good Management, Efficient Team, Investment Decreased. It is also available for immediate download and adjustment. So, changes can be made in the color, design, graphics or any other component to create a unique layout.

Quarterly Non Profit Marketing Strategy For Fundraising Campaign Performance Chart Diagrams PDF
This slide depicts different strategies applied annually to gain investment for non profit organizations. It includes direct mail, event, e-mail, social media and content marketing tactics. Pitch your topic with ease and precision using this Quarterly Non Profit Marketing Strategy For Fundraising Campaign Performance Chart Diagrams PDF. This layout presents information on Marketing Strategies, Event Marketing, Social Media. It is also available for immediate download and adjustment. So, changes can be made in the color, design, graphics or any other component to create a unique layout.

Fundraising Business Event Plan Gantt Chart Microsoft PDF
This slide covers requisites for planning and hosting a fundraising event. It includes action plan from determining fundraising objectives, establishing budget, identifying resources, organize volunteers, etc. along with person responsible. Pitch your topic with ease and precision using this Fundraising Business Event Plan Gantt Chart Microsoft PDF. This layout presents information on Establish A Budget, Fund Management, Identify Required Resources. It is also available for immediate download and adjustment. So, changes can be made in the color, design, graphics or any other component to create a unique layout.

Data Migration Project Process With Estimated Time And Cost Demonstration PDF
This slow showcases process that can help organization to formulate the migration project design and perform data security checks. Its key steps are planning, data preparation, migration design, testing and go live. Pitch your topic with ease and precision using this Data Migration Project Process With Estimated Time And Cost Demonstration PDF. This layout presents information on Planning, Data Preparation, Migration Design. It is also available for immediate download and adjustment. So, changes can be made in the color, design, graphics or any other component to create a unique layout.

Market Demand And Sale Examination For Retail Industry Information PDF
This slide covers estimation of demands and sales revenue generation for different industries under retail sector. It includes details such as multiple retail industries, estimated retail sales, potential retail inventory, market demand estimation.Pitch your topic with ease and precision using this Market Demand And Sale Examination For Retail Industry Information PDF. This layout presents information on Personal Service, Potential Retail, Market Demand . It is also available for immediate download and adjustment. So, changes can be made in the color, design, graphics or any other component to create a unique layout.

Sales Incentive Compensation Programs Plan Chart Template PDF
This slide represents sales incentive compensation policy plan chart illustrating on target earning, mix pay, base salary, annual target incentive etc. for employees of the organization. Pitch your topic with ease and precision using this Sales Incentive Compensation Programs Plan Chart Template PDF. This layout presents information on Sale Commission Cap, Performance Time Frame, Annual Target Incentive. It is also available for immediate download and adjustment. So, changes can be made in the color, design, graphics or any other component to create a unique layout.

CRM Performance Metrics Dashboard Showing Sales In Real Estate Customer Information PDF
This slide represents the dashboard showing the sales performance of a real estate company. It includes details related top 5 agents US sales, sales vs target per agent, top 5 banks-sold units, sales by top 5 agencies. Pitch your topic with ease and precision using this CRM Performance Metrics Dashboard Showing Sales In Real Estate Customer Information PDF. This layout presents information on Us Sales, Sold Units, Target Per Agent. It is also available for immediate download and adjustment. So, changes can be made in the color, design, graphics or any other component to create a unique layout.

Five Benefits Of Real Estate Customer Relationship Management Brochure PDF
This slide represents the five advantages of CRM softwares for real estate companies. It includes five key benefits of CRM for real estate companies such as fast response to consumer enquiries, increases efficiency and productivity, retain more customers, integrate with multiple channels and ensure zero leakage. Pitch your topic with ease and precision using this Five Benefits Of Real Estate Customer Relationship Management Brochure PDF. This layout presents information on Increase Efficiency And Productivity, Retain More Customers, Integrate With Multiple Channels. It is also available for immediate download and adjustment. So, changes can be made in the color, design, graphics or any other component to create a unique layout.
Pipeline Tracking And Management By Real Estate Customer Relationship Management Brochure PDF
This slide represents the report prepared with the help of CRM software for real estate company to track and manage companys sales pipeline. It includes details related to region wise conversion, lead source analysis, accounts analytics etc. Pitch your topic with ease and precision using this Pipeline Tracking And Management By Real Estate Customer Relationship Management Brochure PDF. This layout presents information on Conversion Rate, Lead Source Analysis, Wise Conversion. It is also available for immediate download and adjustment. So, changes can be made in the color, design, graphics or any other component to create a unique layout.

Strategies For Customer Relationship Management Real Estate Customer Relationship Management Icons PDF
This slide represents the seven strategies for real estate companies to manage relationships with consumers with the help of CRM software. It includes four strategies for customer relationships management such as organize consumer data, customer segmentation, offer personalized services and gain valuable insights. Pitch your topic with ease and precision using this Strategies For Customer Relationship Management Real Estate Customer Relationship Management Icons PDF. This layout presents information on Customer Segmentation, Organize Customer Data, Offer Personalized Services. It is also available for immediate download and adjustment. So, changes can be made in the color, design, graphics or any other component to create a unique layout.

New Service Development Procedure Model Professional PDF
Mentioned slide showcases a comprehensive model of service development process. The model consist of various stages such as innovation and idea generation, concept planning, service development, business concept and service implementation. Pitch your topic with ease and precision using this New Service Development Procedure Model Professional PDF. This layout presents information on Lifecycle Innovation, Interaction With Customer, Value Testing. It is also available for immediate download and adjustment. So, changes can be made in the color, design, graphics or any other component to create a unique layout.

Marketing And Operations Dashboard For Distribution Company Guidelines PDF
This slide covers sales and operations dashboard for distribution company. It involves details such as total sales by location, gross margin, monthly sales trends, average revenue and sales by major customers. Pitch your topic with ease and precision using this Marketing And Operations Dashboard For Distribution Company Guidelines PDF. This layout presents information on Gross Margin, Actual Vs Budget, Product. It is also available for immediate download and adjustment. So, changes can be made in the color, design, graphics or any other component to create a unique layout.
Marketing And Operations Dashboard For Performance Management Icons PDF
This slide covers sales and operation dashboard for performance management. It involves details such as number of new buyers, sales revenue, average revenue per unit etc. Pitch your topic with ease and precision using this Marketing And Operations Dashboard For Performance Management Icons PDF. This layout presents information on Average Revenue Per Unit, Customer Acquisition Cost, Customer Lifetime Value. It is also available for immediate download and adjustment. So, changes can be made in the color, design, graphics or any other component to create a unique layout.

Marketing And Operations Dashboard To Drive Effective Productivity Background PDF
This slide covers sales and operations dashboard to drive effective productivity. It involves details such as number of account assigned, working accounts, engaged accounts and total account activity. Pitch your topic with ease and precision using this Marketing And Operations Dashboard To Drive Effective Productivity Background PDF. This layout presents information on Total Account Activity, Number Of Working Account, Engaged Account. It is also available for immediate download and adjustment. So, changes can be made in the color, design, graphics or any other component to create a unique layout.

3 Year Content And Digital Promotional Plan Introduction PDF
This slide showcases marketing plan that can help organization to promote and position the product in the market. It can also help business in running public relation events to create awareness about product in initial stages.Pitch your topic with ease and precision using this 3 Year Content And Digital Promotional Plan Introduction PDF. This layout presents information on Digital Marketing, Speaking Engagements, Build Content. It is also available for immediate download and adjustment. So, changes can be made in the color, design, graphics or any other component to create a unique layout.

3 Year Digital Promotional And Product Launch Plan Inspiration PDF
This slide showcases plan that can help organization to formulate online marketing strategies during and after the launch of product in market. It also showcases marketing plan for a period of 3 years.Pitch your topic with ease and precision using this 3 Year Digital Promotional And Product Launch Plan Inspiration PDF. This layout presents information on Launch Activities, Activities During, Activities Launch. It is also available for immediate download and adjustment. So, changes can be made in the color, design, graphics or any other component to create a unique layout.

3 Year Gantt Chart For Product Promotion And Marketing Plan Demonstration PDF
This slide showcases 3 year gantt chart that can help organization plan and schedule marketing activities. It can also help to keep track of timeline of each promotional activities and take actions in case of delay.Pitch your topic with ease and precision using this 3 Year Gantt Chart For Product Promotion And Marketing Plan Demonstration PDF. This layout presents information on Radio Advertising, Responsible, Comments. It is also available for immediate download and adjustment. So, changes can be made in the color, design, graphics or any other component to create a unique layout.
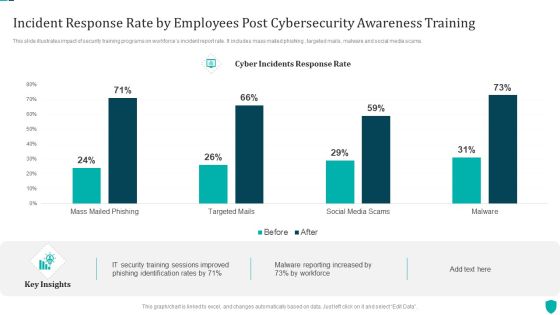
Incident Response Rate By Employees Post Cybersecurity Awareness Training Demonstration PDF
This slide illustrates impact of security training programs on workforces incident report rate. It includes mass mailed phishing , targeted mails, malware and social media scams.Pitch your topic with ease and precision using this Incident Response Rate By Employees Post Cybersecurity Awareness Training Demonstration PDF. This layout presents information on Training Sessions, Phishing Identification, Malware Reporting. It is also available for immediate download and adjustment. So, changes can be made in the color, design, graphics or any other component to create a unique layout.
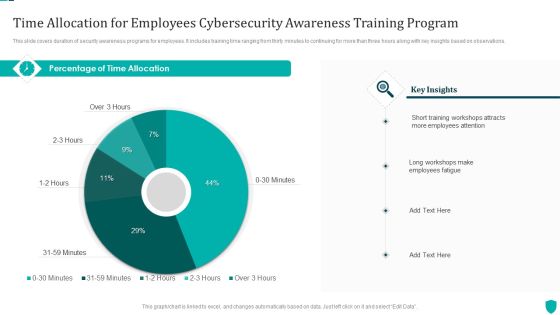
Time Allocation For Employees Cybersecurity Awareness Training Program Themes PDF
This slide covers duration of security awareness programs for employees. It includes training time ranging from thirty minutes to continuing for more than three hours along with key insights based on observations.Pitch your topic with ease and precision using this Time Allocation For Employees Cybersecurity Awareness Training Program Themes PDF. This layout presents information on Training Workshops, Employees Attention, Employees Fatigue. It is also available for immediate download and adjustment. So, changes can be made in the color, design, graphics or any other component to create a unique layout.

Autonomation Chart Depicting Multiple Jidoka Strategy Methods For Businesses Slides PDF
This slide represents Autonomation Chart depicting Multiple Jidoka Methods for Businesses. It includes details like type, methods, micro, small, medium, large, quality, material flow, plan and machine tools.Pitch your topic with ease and precision using this Autonomation Chart Depicting Multiple Jidoka Strategy Methods For Businesses Slides PDF. This layout presents information on Quality Management, Function Deployment, Automated Machinery. It is also available for immediate download and adjustment. So, changes can be made in the color, design, graphics or any other component to create a unique layout.

Traditional Versus Agile Human Resource Transformation Operating Model Background PDF
This slide depicts the HR Operating Model with both traditional and agile approach. It broadly comprises elements such as organization and governance, capabilities, services and processes, people and skills, performance management etc. Pitch your topic with ease and precision using this Traditional Versus Agile Human Resource Transformation Operating Model Background PDF. This layout presents information on Traditional Model, Agile Model, Performance Management. It is also available for immediate download and adjustment. So, changes can be made in the color, design, graphics or any other component to create a unique layout.

Financial Forecast And Essential Metrics Dashboard Ppt File Show PDF
This slide elaborates about the multiple sources through which one can project about the growth and current status of the company. It includes lead conversion rate, monthly revenue , short term assets , net and gross profit margins, etc. Pitch your topic with ease and precision using this Financial Forecast And Essential Metrics Dashboard Ppt File Show PDF. This layout presents information on Monthly Revenue Growth, Short Term Assets, Overall Financial Performance, Net Profit Margin. It is also available for immediate download and adjustment. So, changes can be made in the color, design, graphics or any other component to create a unique layout.
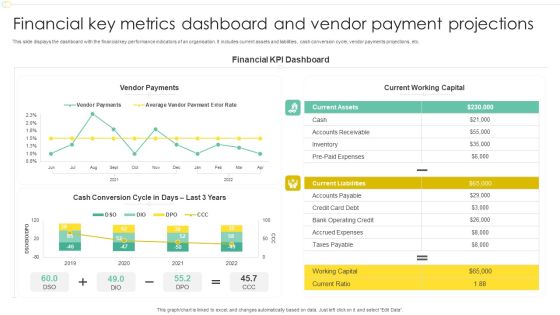
Financial Key Metrics Dashboard And Vendor Payment Projections Professional PDF
This slide displays the dashboard with the financial key performance indicators of an organisation. It includes current assets and liabilities, cash conversion cycle, vendor payments projections, etc. Pitch your topic with ease and precision using this Financial Key Metrics Dashboard And Vendor Payment Projections Professional PDF. This layout presents information on Financial KPI Dashboard, Current Working Capital, Vendor Payments. It is also available for immediate download and adjustment. So, changes can be made in the color, design, graphics or any other component to create a unique layout.
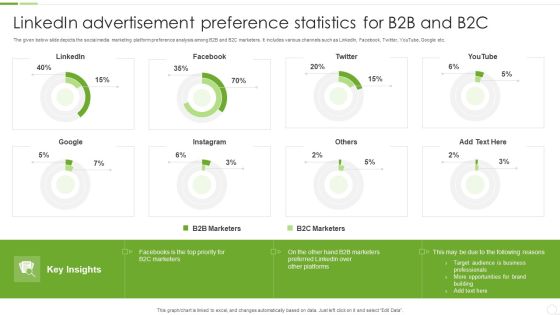
Linkedin Advertisement Preference Statistics For B2B And B2C Ppt Visual Aids Professional PDF
The given below slide depicts the social media marketing platform preference analysis among B2B and B2C marketers. It includes various channels such as LinkedIn, Facebook, Twitter, YouTube, Google etc. Pitch your topic with ease and precision using this Linkedin Advertisement Preference Statistics For B2B And B2C Ppt Visual Aids Professional PDF. This layout presents information on B2B Marketers, B2C Marketers, Target Audience. It is also available for immediate download and adjustment. So, changes can be made in the color, design, graphics or any other component to create a unique layout.

Minimum Cloud Security Standards For Saas And Paas Ppt PowerPoint Presentation Gallery Skills PDF
The following slide depicts the minimum security standards to protect software and platform as a service SaaS and PaaS. It includes elements such as encryption, authentication, security and privacy etc. along with high, medium and low risk level. Pitch your topic with ease and precision using this Minimum Cloud Security Standards For Saas And Paas Ppt PowerPoint Presentation Gallery Skills PDF. This layout presents information on Required Actions, Encryption, Security And Privacy. It is also available for immediate download and adjustment. So, changes can be made in the color, design, graphics or any other component to create a unique layout.
Saas Cloud Security Analysis With KPI Dashboard Ppt PowerPoint Presentation Icon Slides PDF
The following slide highlights the assessment of Software as a security to meet safety standards. It includes key elements such as critical incidents, risk analysis, number of open tasks etc. Pitch your topic with ease and precision using this Saas Cloud Security Analysis With KPI Dashboard Ppt PowerPoint Presentation Icon Slides PDF. This layout presents information on Quarterly Incident Severity, Incident Risk Analysis, Critical Incidents. It is also available for immediate download and adjustment. So, changes can be made in the color, design, graphics or any other component to create a unique layout.

Yearly Saas Cloud Security Expenditure Analysis Ppt PowerPoint Presentation File Deck PDF
The following slide depicts the annual spending of organizations on SaaS security services to prevent data breaches. It constitutes of graph representing the varying expenditure based of the size of the company. Pitch your topic with ease and precision using this Yearly Saas Cloud Security Expenditure Analysis Ppt PowerPoint Presentation File Deck PDF. This layout presents information on Saas Investment, Employees. It is also available for immediate download and adjustment. So, changes can be made in the color, design, graphics or any other component to create a unique layout.

Comparison Grid For Automobile Product Characteristics Assessment Summary PDF
Following slide showcases product features comparison matrix that can help individual to visually compare and analyse the features and functionalities of available automobiles. Its showcases comparison of 4 cars and also pricing for the same. Pitch your topic with ease and precision using this Comparison Grid For Automobile Product Characteristics Assessment Summary PDF. This layout presents information on Climate Control, Panoramic Sunroof, Keyless Entry. It is also available for immediate download and adjustment. So, changes can be made in the color, design, graphics or any other component to create a unique layout.

Led Tv Characteristics Comparison Grid With Product Pricing Designs PDF
Following slide outlines product features comparison matrix that can help to do comparative assessment and select LED TV based upon different features available. It showcases comparison of 4 products and also pricing for the same. Pitch your topic with ease and precision using this Led Tv Characteristics Comparison Grid With Product Pricing Designs PDF. This layout presents information on State Light Technology, Environment Friendly, Product. It is also available for immediate download and adjustment. So, changes can be made in the color, design, graphics or any other component to create a unique layout.

Smartphone Characteristics Comparison Grid With Cost Pictures PDF
Following slide showcases product features comparison matrix that can help individual to visually compare and analyse the features of different smartphones. It showcases comparison of 4 products and also pricing for the same. Pitch your topic with ease and precision using this Smartphone Characteristics Comparison Grid With Cost Pictures PDF. This layout presents information on Crystal Clear Display, Infrared Remote Control, Gorilla Glass Display. It is also available for immediate download and adjustment. So, changes can be made in the color, design, graphics or any other component to create a unique layout.

Key Governance Roles For Information Technology Project Administration Ppt PowerPoint Presentation Styles Background PDF
This slide focuses on key governance roles and responsibilities for managing project which covers governing body, sponsor, manager and key stakeholders. Pitch your topic with ease and precision using this Key Governance Roles For Information Technology Project Administration Ppt PowerPoint Presentation Styles Background PDF. This layout presents information on Project Governing Body, Project Governing Body, Project Sponsor. It is also available for immediate download and adjustment. So, changes can be made in the color, design, graphics or any other component to create a unique layout.

On Job Employee Training Software Comparative Matrix Ppt PowerPoint Presentation Gallery Samples PDF
The slide showcases analysis learning based management systems which helps in training employees and to keep track of their performances. It includes Grovo, Mindflash and Schoox. Pitch your topic with ease and precision using this On Job Employee Training Software Comparative Matrix Ppt PowerPoint Presentation Gallery Samples PDF. This layout presents information on SOFTWARE, Mindflash, Comparative Matrix. It is also available for immediate download and adjustment. So, changes can be made in the color, design, graphics or any other component to create a unique layout.

Company Inward Marketing Strategy Key Barriers Statistics Icons PDF
This slide covers top challenges of inbound marketing strategy that reduces its effectiveness. It includes generation of traffic, proving ROI for marketing activities, securing budget, technology update, website management, hiring talent and training team.Pitch your topic with ease and precision using this Company Inward Marketing Strategy Key Barriers Statistics Icons PDF. This layout presents information on Difficult To Search, Insufficient Traffic, Setting Budget. It is also available for immediate download and adjustment. So, changes can be made in the color, design, graphics or any other component to create a unique layout.

Agile Release Planning Sprint Process Management Approach Ppt Layouts Infographics PDF
This slide showcase sprints in the product lifecycle that focuses on release goal and its feature as unplanned, assigned and initialized. It includes task, sprint, status and goals. Pitch your topic with ease and precision using this Agile Release Planning Sprint Process Management Approach Ppt Layouts Infographics PDF. This layout presents information on Adding Customization Feature, Password Remembrance Feature, Planned. It is also available for immediate download and adjustment. So, changes can be made in the color, design, graphics or any other component to create a unique layout.

Training Plan For Managed Cyber Security Solutions Service Ppt Summary Guide PDF
The following slide outlines a comprehensive training plan for managed security service and awareness for employees. It provides information about the training subject, trainer name, training hours, status and learning outcome. Pitch your topic with ease and precision using this Training Plan For Managed Cyber Security Solutions Service Ppt Summary Guide PDF. This layout presents information on Training Plan, Managed Cyber Security, Solutions Service. It is also available for immediate download and adjustment. So, changes can be made in the color, design, graphics or any other component to create a unique layout.

Business Plan For Managed Cyber Security Solutions Service Ppt Infographic Template Topics PDF
This slide outlines the business plan for managed security service which includes services such as antivirus, anti-malware, anti-spam etc. it also provides information about the total cost of services, status of purchase, security goal, etc. Pitch your topic with ease and precision using this Business Plan For Managed Cyber Security Solutions Service Ppt Infographic Template Topics PDF. This layout presents information on Revenue, Security Goal, IT Security Budget. It is also available for immediate download and adjustment. So, changes can be made in the color, design, graphics or any other component to create a unique layout.

Comparison Of Managed Cyber Security Solutions Service Packages Ppt Ideas Mockup PDF
This slide shows comparison of different managed security service packages like silver, gold, platinum and diamond offered by service providers to the companies. It provides information about malware protection, security awareness, ransomware prevention etc. Pitch your topic with ease and precision using this Comparison Of Managed Cyber Security Solutions Service Packages Ppt Ideas Mockup PDF. This layout presents information on Email Security, Phishing Awareness, Security Awareness. It is also available for immediate download and adjustment. So, changes can be made in the color, design, graphics or any other component to create a unique layout.

Four Dimensions Of Managed Cyber Security Solutions Service Ppt Pictures Model PDF
The following slide outlines the key dimensions of managed security service such as security information and event management, online staff augmentation, network security architecture and threat detection and alerts. Pitch your topic with ease and precision using this Four Dimensions Of Managed Cyber Security Solutions Service Ppt Pictures Model PDF. This layout presents information on Security Information, Event Management, Staff Augmentation. It is also available for immediate download and adjustment. So, changes can be made in the color, design, graphics or any other component to create a unique layout.

Safety Enhancement Strategy With Objective Goals And Plans Elements PDF
This slide covers the overall plan made for the improvement of workers safety who are working on site or in an office. It also includes the objectives and goals of the plan with the completion date and the responsible person for the same. Pitch your topic with ease and precision using this Safety Enhancement Strategy With Objective Goals And Plans Elements PDF. This layout presents information on Improvement Team, Upward Communication, Management Creditability. It is also available for immediate download and adjustment. So, changes can be made in the color, design, graphics or any other component to create a unique layout.

Business Excellence For Customer Growth And To Enhance Customer Relationships Ppt Infographic Template Styles PDF
This slide covers key drivers to improve customer interactions. It includes parameters such as identifying customer needs, market revenue share growth, supply chain performance, technological improvements, etc. Pitch your topic with ease and precision using this Business Excellence For Customer Growth And To Enhance Customer Relationships Ppt Infographic Template Styles PDF. This layout presents information on Business Excellence, Customer Growth, Customer Relationships. It is also available for immediate download and adjustment. So, changes can be made in the color, design, graphics or any other component to create a unique layout.

Statistics Showing Growth Rate Of Managed Cyber Security Solutions Service Market Ppt Show Inspiration PDF
This slide exhibits key statistics highlighting overview of managed security service market with expected market growth rate from 2020 to 2030 along with key insights. Pitch your topic with ease and precision using this Statistics Showing Growth Rate Of Managed Cyber Security Solutions Service Market Ppt Show Inspiration PDF. This layout presents information on Statistics Showing Growth, Cyber Security, Solutions Service Market. It is also available for immediate download and adjustment. So, changes can be made in the color, design, graphics or any other component to create a unique layout.

Expenditure Estimation Based On Project Size Ppt Outline Graphics Example PDF
The following slide highlights the cost estimation based on project size illustrating key headings which includes project size, range, installed cost, management cost, control cost and total cost, where project size is classified into small project, medium project and large project Pitch your topic with ease and precision using this Expenditure Estimation Based On Project Size Ppt Outline Graphics Example PDF. This layout presents information on Small Project, Management Cost, Control Cost. It is also available for immediate download and adjustment. So, changes can be made in the color, design, graphics or any other component to create a unique layout.

Project Expenditure Estimation For Multiple Activities Ppt Ideas Graphics Tutorials PDF
The following slide highlights the project cost estimation for multiple activities illustrating key headings which includes activity, labor, worker, hourly cost, estimated time, materials, quantity, price, planned budget, actual expenses and variance Pitch your topic with ease and precision using this Project Expenditure Estimation For Multiple Activities Ppt Ideas Graphics Tutorials PDF. This layout presents information on Labor, Activity, Planned Budget. It is also available for immediate download and adjustment. So, changes can be made in the color, design, graphics or any other component to create a unique layout.

Workplace Policy Deployment Approach Process Chain For Target Group Structure PDF
This slide covers chain of policy implementation among target groups for decision making process. It includes steps for decision making , preparation, deployment, end user response. Pitch your topic with ease and precision using this Workplace Policy Deployment Approach Process Chain For Target Group Structure PDF. This layout presents information on Decision, Preparation, Deployment, Everyday Practice. It is also available for immediate download and adjustment. So, changes can be made in the color, design, graphics or any other component to create a unique layout.

Recognition Program To Boost Workforce Morale Ppt Gallery Information PDF
This slide shows statistical data of recognition programs to engage and motivate employees. It includes monetary program, awards, employee of the month, service anniversaries and verbal appreciation. Pitch your topic with ease and precision using this Recognition Program To Boost Workforce Morale Ppt Gallery Information PDF. This layout presents information on Monetary Program, Awards And Trophies, Employee Month, Service Anniversaries. It is also available for immediate download and adjustment. So, changes can be made in the color, design, graphics or any other component to create a unique layout.

Launching Viral Promotional Campaign With Projected Budget Infographics PDF
This slide show budget plan which can be used by marketing manager to launch viral marketing campaign. It includes information about campaign duration, platform, budget and target region details. Pitch your topic with ease and precision using this Launching Viral Promotional Campaign With Projected Budget Infographics PDF. This layout presents information on Campaign, Duration, Platform, Budget, Target Region. It is also available for immediate download and adjustment. So, changes can be made in the color, design, graphics or any other component to create a unique layout.

Workforce Department Performance Graph Ppt Model Graphics Pictures PDF
This slide shows performance graph of HR department. Information covered in this slide is related to total hirings and turnover in the last four years. Pitch your topic with ease and precision using this Workforce Department Performance Graph Ppt Model Graphics Pictures PDF. This layout presents information on New Hiring, Continuous Increase, Employee Turnover, 2019 To 2022. It is also available for immediate download and adjustment. So, changes can be made in the color, design, graphics or any other component to create a unique layout.
Stock Requirement Plan With Delivery Performance Ppt PowerPoint Presentation Icon Deck PDF
The following slide highlights the material requirement planning with delivery performance illustrating top clients by revenue details, top clients by revenue, delivery performance and shipments. Pitch your topic with ease and precision using this Stock Requirement Plan With Delivery Performance Ppt PowerPoint Presentation Icon Deck PDF. This layout presents information on Delivery Performance, Shipments, Top Clients Revenue. It is also available for immediate download and adjustment. So, changes can be made in the color, design, graphics or any other component to create a unique layout.

Employee Survey Results For Flexible Work Advantages Ppt Infographic Template Guidelines PDF
This slide shows the percentage wise results of survey conducted for employees regarding the advantages of flexible working culture. It includes main categories of adjustable work schedule, no travelling, family time and other advantages such as work life balance and focusing on physical health etc. Pitch your topic with ease and precision using this Employee Survey Results For Flexible Work Advantages Ppt Infographic Template Guidelines PDF. This layout presents information on Key Insights, Family Time, Adjustable Work Schedule, No Travelling. It is also available for immediate download and adjustment. So, changes can be made in the color, design, graphics or any other component to create a unique layout.

Remuneration Strategy For Multiple Sales Position Ppt Icon Background Designs PDF
The following slide highlights the commission scheme for multiple sales position. It illustrates positions, base pay, commission and target pay, where positions includes sales development representative, account executive, customer success manger and area manager. Pitch your topic with ease and precision using this Remuneration Strategy For Multiple Sales Position Ppt Icon Background Designs PDF. This layout presents information on Amount Executive, Reporting, Commission Scheme. It is also available for immediate download and adjustment. So, changes can be made in the color, design, graphics or any other component to create a unique layout.

Food Processing Corporate Skills And Abilities Assessment Survey Ppt Summary Layout PDF
This slide outlines the skill assessment of employees working in a food processing firm to evaluate some important job skills that their employees lack or should improve. The criteria include employee skills, experience, rating along with survey modes. Pitch your topic with ease and precision using this Food Processing Corporate Skills And Abilities Assessment Survey Ppt Summary Layout PDF. This layout presents information on Employee Skills, Experience, Survey Modes. It is also available for immediate download and adjustment. So, changes can be made in the color, design, graphics or any other component to create a unique layout.

Parameters Affecting Employee Professional Journey Map In Workplace Download PDF
This slide covers different factors that impact employee experience in an organization. It includes work nature, development opportunities, colleagues, company culture, hitting targets, getting raise, promotion and management. Pitch your topic with ease and precision using this Parameters Affecting Employee Professional Journey Map In Workplace Download PDF. This layout presents information on Management, Promotion, Getting Raise, Hitting Targets. It is also available for immediate download and adjustment. So, changes can be made in the color, design, graphics or any other component to create a unique layout.
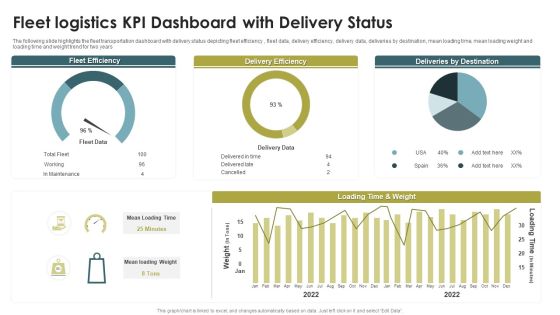
Fleet Logistics KPI Dashboard With Delivery Status Ppt Model Guide PDF
The following slide highlights the fleet transportation dashboard with delivery status depicting fleet efficiency , fleet data, delivery efficiency, delivery data, deliveries by destination, mean loading time, mean loading weight and loading time and weight trend for two years. Pitch your topic with ease and precision using this Fleet Logistics KPI Dashboard With Delivery Status Ppt Model Guide PDF. This layout presents information on Fleet Efficiency, Delivery Efficiency, Deliveries By Destination. It is also available for immediate download and adjustment. So, changes can be made in the color, design, graphics or any other component to create a unique layout.
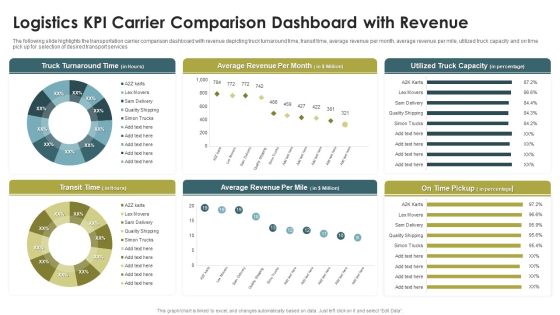
Logistics KPI Carrier Comparison Dashboard With Revenue Ppt Infographics Portfolio PDF
The following slide highlights the transportation carrier comparison dashboard with revenue depicting truck turnaround time, transit time, average revenue per month, average revenue per mile, utilized truck capacity and on time pick up for selection of desired transport services. Pitch your topic with ease and precision using this Logistics KPI Carrier Comparison Dashboard With Revenue Ppt Infographics Portfolio PDF. This layout presents information on Truck Turnaround Time, Average Revenue, Per Month, Transit Time. It is also available for immediate download and adjustment. So, changes can be made in the color, design, graphics or any other component to create a unique layout.

Logistics KPI Status Dashboard With Monthly KPI Ppt Infographic Template Layout PDF
The following slide highlights the transportation status dashboard with monthly KPI illustrating order status with customer, order date and delivery date. It shows financial performance for four quarters as well as todays order, inventory and monthly KPI with Inventory, shipping cost for past 30 days. Pitch your topic with ease and precision using this Logistics KPI Status Dashboard With Monthly KPI Ppt Infographic Template Layout PDF. This layout presents information on Order Status, Today Order, Inventory, Monthly KPI. It is also available for immediate download and adjustment. So, changes can be made in the color, design, graphics or any other component to create a unique layout.

Dashboard For Logistics KPI Management System Of Logistics Company Infographics PDF
The following slide highlights the dashboard for transportation management system of logistics company illustrating shipment status of 30 days, shipment by carrier, on time shipment, average shipment cost, carrier efficiency and shipment count. Pitch your topic with ease and precision using this Dashboard For Logistics KPI Management System Of Logistics Company Infographics PDF. This layout presents information on Shipment Status, Shipment By Carrier, On Time Shipment. It is also available for immediate download and adjustment. So, changes can be made in the color, design, graphics or any other component to create a unique layout.

Logistics KPI Carrier Management Dashboard For Ecommerce Company Microsoft PDF
The following slide highlights the transportation carrier management dashboard for Ecommerce company depicting vehicle status, yearly cost, maintenance cost, cost breakdown, vehicle life span, empty miles and insurance by vehicle type. Pitch your topic with ease and precision using this Logistics KPI Carrier Management Dashboard For Ecommerce Company Microsoft PDF. This layout presents information on Mini Trucks, 13 Trailers, Empty Miles, Vehicle Life Span. It is also available for immediate download and adjustment. So, changes can be made in the color, design, graphics or any other component to create a unique layout.

Four Categories Of Production In Manufacturing Plant Ppt Summary Show PDF
The following slide highlights the four categories of production in manufacturing plant illustrating key types which are unit production, batch production mass production and continuous production. Pitch your topic with ease and precision using this Four Categories Of Production In Manufacturing Plant Ppt Summary Show PDF. This layout presents information on Unit Production, Mass Production, Continuous Production, Batch Production. It is also available for immediate download and adjustment. So, changes can be made in the color, design, graphics or any other component to create a unique layout.
 Home
Home