Organizational Change
Project Stakeholder Influence Leadership Analysis Matrix Ppt PowerPoint Presentation Icon Demonstration PDF
The following slide showcases project stakeholder matrix that highlights the roles of key personnel. The matrix includes impact and influence over the project, stakeholder contribution and strategy.Pitch your topic with ease and precision using this Project Stakeholder Influence Leadership Analysis Matrix Ppt PowerPoint Presentation Icon Demonstration PDF. This layout presents information on Strategy Engaging, Stakeholder, Stakeholder Contribute. It is also available for immediate download and adjustment. So, changes can be made in the color, design, graphics or any other component to create a unique layout.
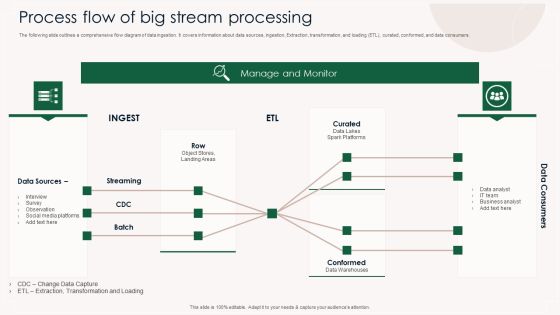
Process Flow Of Big Stream Processing Ppt PowerPoint Presentation Gallery Ideas PDF
The following slide outlines a comprehensive flow diagram of data ingestion. It covers information about data sources, ingestion, Extraction, transformation, and loading ETL, curated, conformed, and data consumers. Pitch your topic with ease and precision using this Process Flow Of Big Stream Processing Ppt PowerPoint Presentation Gallery Ideas PDF. This layout presents information on Manage And Monitor, Data Consumers, Data Sources, Streaming. It is also available for immediate download and adjustment. So, changes can be made in the color, design, graphics or any other component to create a unique layout.
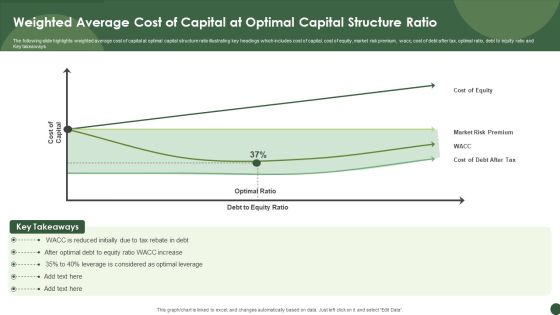
Weighted Average Cost Of Capital At Optimal Capital Structure Ratio Sample PDF
The following slide highlights weighted average cost of capital at optimal capital structure ratio illustrating key headings which includes cost of capital, cost of equity, market risk premium, wacc, cost of debt after tax, optimal ratio, debt to equity ratio and Key takeaways.Pitch your topic with ease and precision using this Weighted Average Cost Of Capital At Optimal Capital Structure Ratio Sample PDF. This layout presents information on Reduced Initially, Leverage Considered, Optimal Leverage. It is also available for immediate download and adjustment. So, changes can be made in the color, design, graphics or any other component to create a unique layout.
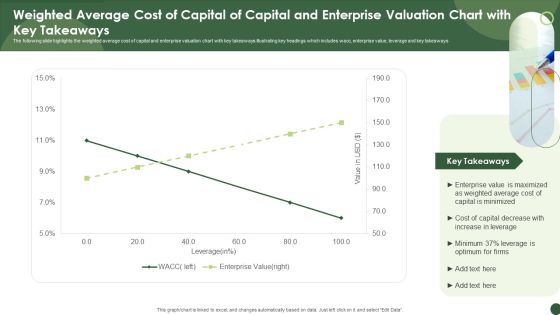
Weighted Average Cost Of Capital Of Capital And Enterprise Valuation Chart With Key Takeaways Inspiration PDF
The following slide highlights the weighted average cost of capital and enterprise valuation chart with key takeaways illustrating key headings which includes wacc, enterprise value, leverage and key takeaways. Pitch your topic with ease and precision using this Weighted Average Cost Of Capital Of Capital And Enterprise Valuation Chart With Key Takeaways Inspiration PDF. This layout presents information on Enterprise Value, Weighted Average, Capital Is Minimized. It is also available for immediate download and adjustment. So, changes can be made in the color, design, graphics or any other component to create a unique layout.

Assessment Form For Choosing Best Supplier Demonstration PDF
This slide shows evaluation form for choosing best vendor. It evaluates vendors on the basis of timeliness of deliveries, quality of service provides, credit rating, expertise of sales staff, competitiveness of price etc.Pitch your topic with ease and precision using this Assessment Form For Choosing Best Supplier Demonstration PDF. This layout presents information on Vendor Evaluation, Expertise Of Sales, Competitiveness. It is also available for immediate download and adjustment. So, changes can be made in the color, design, graphics or any other component to create a unique layout.
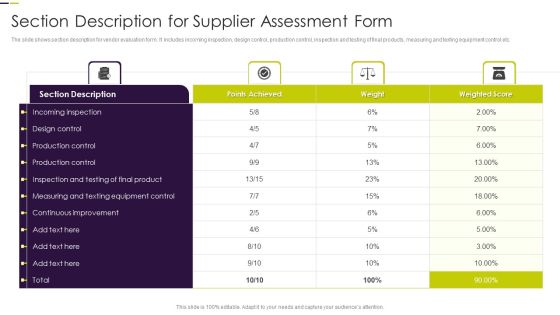
Section Description For Supplier Assessment Form Guidelines PDF
The slide shows section description for vendor evaluation form. It includes incoming inspection, design control, production control, inspection and testing of final products, measuring and texting equipment control etc. Pitch your topic with ease and precision using this Section Description For Supplier Assessment Form Guidelines PDF. This layout presents information on Incoming Inspection, Production Control, Production Control. It is also available for immediate download and adjustment. So, changes can be made in the color, design, graphics or any other component to create a unique layout.
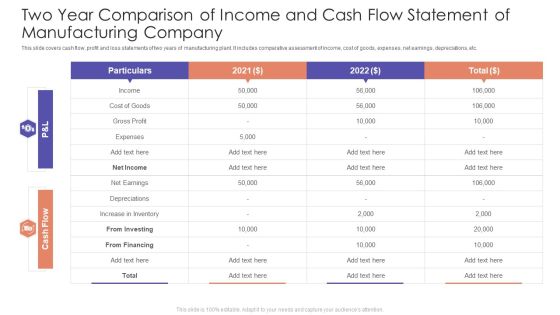
Two Year Comparison Of Income And Cash Flow Statement Of Manufacturing Company Demonstration PDF
This slide covers cash flow, profit and loss statements of two years of manufacturing plant. It includes comparative assessment of income, cost of goods, expenses, net earnings, depreciations, etc. Pitch your topic with ease and precision using this Two Year Comparison Of Income And Cash Flow Statement Of Manufacturing Company Demonstration PDF. This layout presents information on Cost Goods, Income, Cash Flow, Net Income. It is also available for immediate download and adjustment. So, changes can be made in the color, design, graphics or any other component to create a unique layout.
Impact Of Various Bankruptcy Ratios On A Firm Icons PDF
The following slide showcases companys insolvency ratios and whether it can cover its long term debt. Key ratios covered are debt to equity, debt to asset and equity ratio. Pitch your topic with ease and precision using this Impact Of Various Bankruptcy Ratios On A Firm Icons PDF. This layout presents information on Equity Ratio, Financial. It is also available for immediate download and adjustment. So, changes can be made in the color, design, graphics or any other component to create a unique layout.

Organization Bankruptcy Worksheet With Assets And Liabilities Demonstration PDF
This slide showcases worksheet to determine firms degree of bankruptcy as it related to debt cancellation. It further includes liabilities and amount owed, assets and their fair market value. Pitch your topic with ease and precision using this Organization Bankruptcy Worksheet With Assets And Liabilities Demonstration PDF. This layout presents information on Accrued Mortgage Interest, Stocks And Bonds, Market Value. It is also available for immediate download and adjustment. So, changes can be made in the color, design, graphics or any other component to create a unique layout.

Customized Marketing Impact On Conversion Rates Ppt PowerPoint Presentation Gallery Slideshow PDF
This slide highlights the comparative analysis on conversion rates from the use customized marketing. The platform includes search engine marketing, website, email and social media. Pitch your topic with ease and precision using this Customized Marketing Impact On Conversion Rates Ppt PowerPoint Presentation Gallery Slideshow PDF. This layout presents information on Search Engine Marketing, Social Media, Mobile Apps. It is also available for immediate download and adjustment. So, changes can be made in the color, design, graphics or any other component to create a unique layout.

Customized Vs Mass Marketing Comparison With Line Chart Ppt PowerPoint Presentation File Ideas PDF
This slide signifies the customized vs mass marketing with line chart. It includes comparison based on strategies that are being implemented for growth in customer engagement. Pitch your topic with ease and precision using this Customized Vs Mass Marketing Comparison With Line Chart Ppt PowerPoint Presentation File Ideas PDF. This layout presents information on Customized Marketing, Mass Marketing, 2016 To 2022. It is also available for immediate download and adjustment. So, changes can be made in the color, design, graphics or any other component to create a unique layout.
Gross Profit Margin Dashboard With Revenue Vs Expenses Icons PDF
This slide showcases dashboard that can help organization to evaluate the revenue generated and expenses incurred in conducting operations. It also showcases gross profit and margin of last financial year. Pitch your topic with ease and precision using this Gross Profit Margin Dashboard With Revenue Vs Expenses Icons PDF. This layout presents information on Gross Profit Margin, EBITDA Margin, Net Profit Margin. It is also available for immediate download and adjustment. So, changes can be made in the color, design, graphics or any other component to create a unique layout.

Yearly Net Income Statement Graph With Revenue And Operating Profit Margin Download PDF
This slide showcases chart that can help organization compare and analyze the operating profits generated by organization in different financial years. It also showcases yearly comparison of net income, revenue and operating profit margin. Pitch your topic with ease and precision using this Yearly Net Income Statement Graph With Revenue And Operating Profit Margin Download PDF. This layout presents information on Revenue, Net Income, Operating Profit Margin. It is also available for immediate download and adjustment. So, changes can be made in the color, design, graphics or any other component to create a unique layout.

Data Governance Maturity Model Framework Ppt PowerPoint Presentation Gallery Layout PDF
This slide depicts data governance maturity model framework that defines the roles, responsibilities, policies, and procedures of initiatives taken up. The framework lists core initiatives and programmes which are controlled by an overall data management system. Pitch your topic with ease and precision using this Data Governance Maturity Model Framework Ppt PowerPoint Presentation Gallery Layout PDF. This layout presents information on Core Initiatives, Core Programmes, Data Access Management. It is also available for immediate download and adjustment. So, changes can be made in the color, design, graphics or any other component to create a unique layout.

Fashion Marketing And Advertisement Analysis Dashboard Ppt PowerPoint Presentation Gallery Topics PDF
This slide defines the dashboard for fashion marketing and Advertisement revenue analysis . It includes information related to the revenue, sales, brands and gender breakdown. Pitch your topic with ease and precision using this Fashion Marketing And Advertisement Analysis Dashboard Ppt PowerPoint Presentation Gallery Topics PDF. This layout presents information on Total Revenue, Total Brands, Total Sales. It is also available for immediate download and adjustment. So, changes can be made in the color, design, graphics or any other component to create a unique layout.

Employee Orientation Training Provided By Human Resource Training Administration Structure PDF
Mentioned slide outlines employee orientation training schedule which can be referred by Human Resource Administration. Information covered in this slide is related to multiple topics such as introduction, welcome video, payroll policy, mission and vision statement of company etc. Pitch your topic with ease and precision using this Employee Orientation Training Provided By Human Resource Training Administration Structure PDF. This layout presents information on Introduction, Department Introductions, Term Insurance. It is also available for immediate download and adjustment. So, changes can be made in the color, design, graphics or any other component to create a unique layout.

Human Resource Training Administration Plan With Learning Outcome Brochure PDF
Following slide depicts a comprehensive Human Resource Training Administration plan. The template covers detailed information about training subject, mode of training, status and learning outcome. Pitch your topic with ease and precision using this Human Resource Training Administration Plan With Learning Outcome Brochure PDF. This layout presents information on Learning Outcome, Project Management Fundamentals, Time Management. It is also available for immediate download and adjustment. So, changes can be made in the color, design, graphics or any other component to create a unique layout.
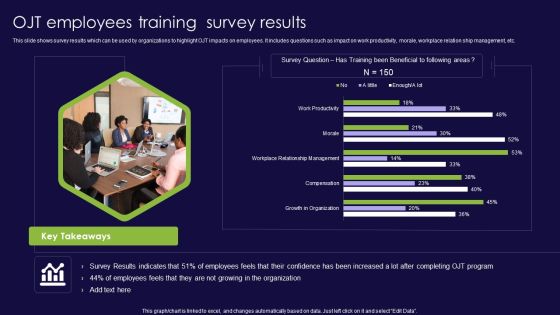
OJT Employees Training Survey Results Ppt PowerPoint Presentation File Master Slide PDF
This slide shows survey results which can be used by organizations to highlight OJT impacts on employees. It includes questions such as impact on work productivity, morale, workplace relation ship management, etc. Pitch your topic with ease and precision using this OJT Employees Training Survey Results Ppt PowerPoint Presentation File Master Slide PDF. This layout presents information on Growth Organization, Compensation, Workplace Relationship Management. It is also available for immediate download and adjustment. So, changes can be made in the color, design, graphics or any other component to create a unique layout.

Cost Scrum Kpis Chart And Key Statistics Ppt Layouts Example Introduction PDF
This slide illustrates graphical representation of cost scrum metrics. It provides Projected Hours per story and actual hours per story point and other key statistics. Pitch your topic with ease and precision using this Cost Scrum Kpis Chart And Key Statistics Ppt Layouts Example Introduction PDF. This layout presents information on Projected Hours, Cost Per Story, Metrics, Actual Cost. It is also available for immediate download and adjustment. So, changes can be made in the color, design, graphics or any other component to create a unique layout.
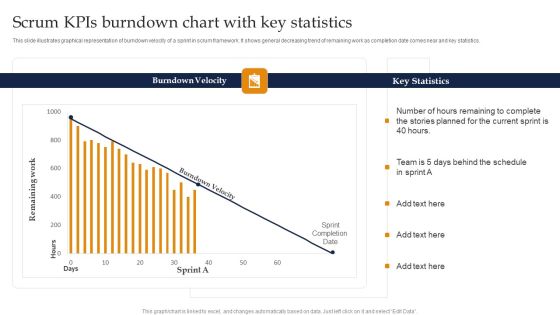
Scrum Kpis Burndown Chart With Key Statistics Ppt Pictures Visual Aids PDF
This slide illustrates graphical representation of burndown velocity of a sprint in scrum framework. It shows general decreasing trend of remaining work as completion date comes near and key statistics. Pitch your topic with ease and precision using this Scrum Kpis Burndown Chart With Key Statistics Ppt Pictures Visual Aids PDF. This layout presents information on Burndown Velocity, Key Statistics, Current Sprint. It is also available for immediate download and adjustment. So, changes can be made in the color, design, graphics or any other component to create a unique layout.

Business Performance Review Dashboard With Customer Acquisition Cost Diagrams PDF
The following slide highlights KPI dashboard which can be used for quarterly business review QBR. It provides detailed information about actual revenue vs target, number of new customers, average revenue per customer, customer acquisition cost CAC etc. Pitch your topic with ease and precision using this Business Performance Review Dashboard With Customer Acquisition Cost Diagrams PDF. This layout presents information on Revenue, Customer Acquisition Cost, Current Quarter. It is also available for immediate download and adjustment. So, changes can be made in the color, design, graphics or any other component to create a unique layout.

Business Performance Review Report Highlighting Results Of Marketing Campaign Icons PDF
The following slide highlights a quarterly business review QBR report which can be used by the manager to review marketing campaign results. The QBR report covers information about strategic objectives, KPIs, target and result in various quarters. Pitch your topic with ease and precision using this Business Performance Review Report Highlighting Results Of Marketing Campaign Icons PDF. This layout presents information on Strategic Objectives, Engage Community, Increase Revenue. It is also available for immediate download and adjustment. So, changes can be made in the color, design, graphics or any other component to create a unique layout.

Business Performance Review Report Showing Key Business Statistics Formats PDF
The following slide highlights comprehensive quarterly business review QBR report exhibiting the major statistics of the business. It provides information about total revenue, total products sold, cost, profit, total number of partners and total number of employees joined in the current quarter. Pitch your topic with ease and precision using this Business Performance Review Report Showing Key Business Statistics Formats PDF. This layout presents information on Product Shipped, Cost, Profit. It is also available for immediate download and adjustment. So, changes can be made in the color, design, graphics or any other component to create a unique layout.

Business Performance Review Report To Evaluate Performance Of Sales Rep Infographics PDF
The following slide highlights quarterly business review QBR report which can be used by firm to evaluate the efficiency of sales rep. information covered in this slide is related to total sales by employees in different quarters, number of calls made. Pitch your topic with ease and precision using this Business Performance Review Report To Evaluate Performance Of Sales Rep Infographics PDF. This layout presents information on Revenue Sales, Tim Paine, Number Colds Calls. It is also available for immediate download and adjustment. So, changes can be made in the color, design, graphics or any other component to create a unique layout.

Framework For Conducting Business Performance Review Process Information PDF
The following slide highlights a framework which can be used for conducting quarterly business review QBR. The framework provides information about goals, time-frame, key steps, actionable points and time required. Pitch your topic with ease and precision using this Framework For Conducting Business Performance Review Process Information PDF. This layout presents information on Time Frame, Team, Actionable Points. It is also available for immediate download and adjustment. So, changes can be made in the color, design, graphics or any other component to create a unique layout.

Stakeholder Evaluation Plan Assessment Matrix With Risks And Impact Structure PDF
This slide illustrates stakeholder management and analysis to gather their support and minimizes risks associated with them. It includes stakeholders, stakes in project, impact, requirements, risks etc. Pitch your topic with ease and precision using this Stakeholder Evaluation Plan Assessment Matrix With Risks And Impact Structure PDF. This layout presents information on Requirement, Risks, HR Director. It is also available for immediate download and adjustment. So, changes can be made in the color, design, graphics or any other component to create a unique layout.

Stakeholder Evaluation Plan Decision Matrix With Support Quotient Mockup PDF
This slide illustrates ratings table of stakeholder to evaluate their influence and buy in capacity. It includes stakeholder role, type, interest, power, current support, flexibility etc. Pitch your topic with ease and precision using this Stakeholder Evaluation Plan Decision Matrix With Support Quotient Mockup PDF. This layout presents information on Stakeholder Role, Executive Influencer, Technical Influencer. It is also available for immediate download and adjustment. So, changes can be made in the color, design, graphics or any other component to create a unique layout.

Commercial Marketing KPI With Monthly And Daily Lead Breakdown Ideas PDF
This template slide covers about lead generated by organization on daily and monthly basis by different region. Further, it covers about customer engagement by different social media channels. Pitch your topic with ease and precision using this Commercial Marketing KPI With Monthly And Daily Lead Breakdown Ideas PDF. This layout presents information on Conversion Metrics, Quality Trial, Lead Breakdown. It is also available for immediate download and adjustment. So, changes can be made in the color, design, graphics or any other component to create a unique layout.

Ecommerce Marketing Activities KPI Dashboard To Analyse Performance Guidelines PDF
This slide covers ecommerce marketing KPI dashboard to track performance. It involves details such as ecommerce revenue generated, number of new customers, repeat buying rate, attribute revenue and conversion rate and attributed revenue and conversion rate by marketing channel.Pitch your topic with ease and precision using this Ecommerce Marketing Activities KPI Dashboard To Analyse Performance Guidelines PDF. This layout presents information on Revenue Generated, Ecommerce Revenue, Generate Conversion. It is also available for immediate download and adjustment. So, changes can be made in the color, design, graphics or any other component to create a unique layout.

Online Marketing Activities KPI Dashboard To Improve Sales Ideas PDF
This slide covers online marketing dashboard to improve sales. It involves details such as web performance, conversion funnel, revenue this month, traffic sources and number of followers on social media.Pitch your topic with ease and precision using this Online Marketing Activities KPI Dashboard To Improve Sales Ideas PDF. This layout presents information on Email Performance, Web Performance, Cost Conversion. It is also available for immediate download and adjustment. So, changes can be made in the color, design, graphics or any other component to create a unique layout.
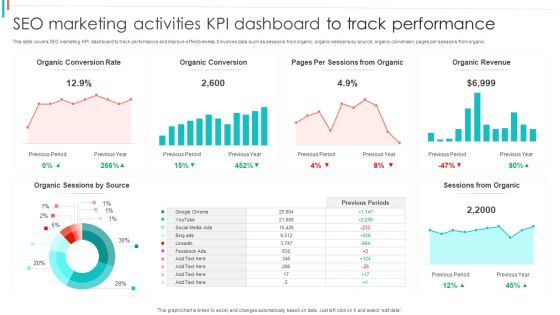
SEO Marketing Activities KPI Dashboard To Track Performance Brochure PDF
This slide covers SEO marketing KPI dashboard to track performance and improve effectiveness. It involves data such as sessions from organic, organic sessions by source, organic conversion, pages per sessions from organic.Pitch your topic with ease and precision using this SEO Marketing Activities KPI Dashboard To Track Performance Brochure PDF. This layout presents information on Organic Conversion, Sessions Organic, Organic Revenue. It is also available for immediate download and adjustment. So, changes can be made in the color, design, graphics or any other component to create a unique layout.

Research Stages Process With Methodology And Outcome Ideas PDF
This slide contains the research phases that is undertaken by the organisation for their benefit so that they can retain more number of buyers. It also includes methodology primary or secondary, process and their outcomes. Pitch your topic with ease and precision using this Research Stages Process With Methodology And Outcome Ideas PDF. This layout presents information on Primary Research, Secondary Research, Marketing Administration. It is also available for immediate download and adjustment. So, changes can be made in the color, design, graphics or any other component to create a unique layout.
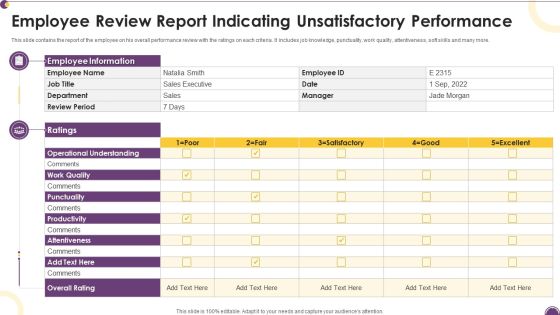
Employee Review Report Indicating Unsatisfactory Performance Themes PDF
This slide contains the report of the employee on his overall performance review with the ratings on each criteria. It includes job knowledge, punctuality, work quality, attentiveness, soft skills and many more.Pitch your topic with ease and precision using this Employee Review Report Indicating Unsatisfactory Performance Themes PDF. This layout presents information on Operational Understanding, Employee Information, Punctuality. It is also available for immediate download and adjustment. So, changes can be made in the color, design, graphics or any other component to create a unique layout.

Financial Unsatisfactory Performance Dashboard With Accounting Ratios Diagrams PDF
This slide contains the information of the financial sector of the company to know where it stands and what needs to be done to improve the performance.It includes multiple ratios ROA, ROE, working capital ration and debt-equity ratio. Pitch your topic with ease and precision using this Financial Unsatisfactory Performance Dashboard With Accounting Ratios Diagrams PDF. This layout presents information on Return Assets, Working Capital, Return Equity. It is also available for immediate download and adjustment. So, changes can be made in the color, design, graphics or any other component to create a unique layout.
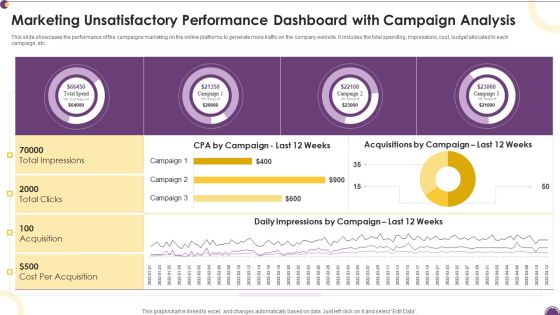
Marketing Unsatisfactory Performance Dashboard With Campaign Analysis Information PDF
This slide showcases the performance of the campaigns marketing on the online platforms to generate more traffic on the company website. It includes the total spending, impressions, cost, budget allocated to each campaign, etc.Pitch your topic with ease and precision using this Marketing Unsatisfactory Performance Dashboard With Campaign Analysis Information PDF. This layout presents information on Cost Acquisition, Total Clicks, Total Impressions. It is also available for immediate download and adjustment. So, changes can be made in the color, design, graphics or any other component to create a unique layout.

B2B Market Segmentation Dashboard Microsoft PDF
This slide illustrates the market segmentation dashboard for B2B which can benefit them to improve the focus and boost the revenue of the organization. It includes segmentation based in company size and different industries under B2B market. Pitch your topic with ease and precision using this B2B Market Segmentation Dashboard Microsoft PDF. This layout presents information on Industries, Market Segmentation, Service. It is also available for immediate download and adjustment. So, changes can be made in the color, design, graphics or any other component to create a unique layout.

Project Management Governance Framework With Cobit Mapping Inspiration PDF
This slide illustrates Project Management Framework with control objectives for information and related technologies COBIT Mapping which can be beneficial for project managers to ascertain various project task statuses. It contains details about project strategy, project design, project transition, project operation and continuous project improvement Pitch your topic with ease and precision using this Project Management Governance Framework With Cobit Mapping Inspiration PDF. This layout presents information on Implement, Acquire, Project Resource Capacity. It is also available for immediate download and adjustment. So, changes can be made in the color, design, graphics or any other component to create a unique layout.

Product KPI Key Attributes Scorecard Based On Customer Feedback Report Ideas PDF
This slide covers scorecard for various product attributes based on customer surveys. It includes packaging, resource sustainability, product performance, design , quality, quantity, etc. Pitch your topic with ease and precision using this Product KPI Key Attributes Scorecard Based On Customer Feedback Report Ideas PDF. This layout presents information on Product Design, Product Performance, Resource Sustainability. It is also available for immediate download and adjustment. So, changes can be made in the color, design, graphics or any other component to create a unique layout.

Company Staff Work Schedule Report Sheet Elements PDF
This slide covers companys all employees allocated work schedule details. It includes the date, ID, employee name, work codes, start time, end time and total hours worked details. Pitch your topic with ease and precision using this Company Staff Work Schedule Report Sheet Elements PDF. This layout presents information on Company Staff Work, Schedule Report Sheet. It is also available for immediate download and adjustment. So, changes can be made in the color, design, graphics or any other component to create a unique layout.
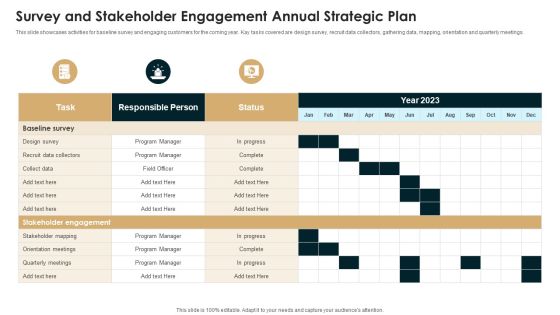
Survey And Stakeholder Engagement Annual Strategic Plan Microsoft PDF
This slide showcases activities for baseline survey and engaging customers for the coming year. Kay tasks covered are design survey, recruit data collectors, gathering data, mapping, orientation and quarterly meetings. Pitch your topic with ease and precision using this Survey And Stakeholder Engagement Annual Strategic Plan Microsoft PDF. This layout presents information on Recruit Data, Design Survey, Strategic Plan. It is also available for immediate download and adjustment. So, changes can be made in the color, design, graphics or any other component to create a unique layout.

Comparative Assessment Of Waterfall Project Management Tools Structure PDF
This slide shows the comparative assessment of waterfall project management tools on the basis of features such as complete designing, real time tracking, measurable progress, flexibility and adaptability. Pitch your topic with ease and precision using this Comparative Assessment Of Waterfall Project Management Tools Structure PDF. This layout presents information on Complete Designing, Flexibility And Adaptability, Measurable Progress. It is also available for immediate download and adjustment. So, changes can be made in the color, design, graphics or any other component to create a unique layout.
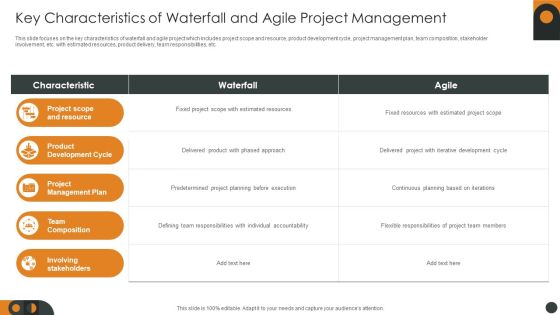
Key Characteristics Of Waterfall And Agile Project Management Themes PDF
This slide focuses on the key characteristics of waterfall and agile project which includes project scope and resource, product development cycle, project management plan, team composition, stakeholder involvement, etc. with estimated resources, product delivery, team responsibilities, etc. Pitch your topic with ease and precision using this Key Characteristics Of Waterfall And Agile Project Management Themes PDF. This layout presents information on Project Management Plan, Team Composition, Product Development Cycle. It is also available for immediate download and adjustment. So, changes can be made in the color, design, graphics or any other component to create a unique layout.
Waterfall Project Management Timeline For Software Development Icons PDF
This slide shows the waterfall project timeline for software development which includes five phases such as research, discovery, designing, development, testing, revision and deployment with defining scope, user research, reviewing design, etc. Pitch your topic with ease and precision using this Waterfall Project Management Timeline For Software Development Icons PDF. This layout presents information on Design Phase, Development Phase, Deployment Phase. It is also available for immediate download and adjustment. So, changes can be made in the color, design, graphics or any other component to create a unique layout.
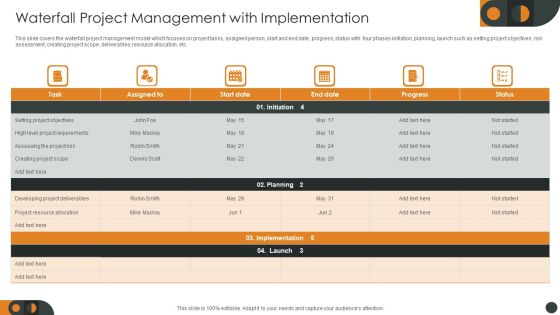
Waterfall Project Management With Implementation Graphics PDF
This slide covers the waterfall project management model which focuses on project tasks, assigned person, start and end date, progress, status with four phases initiation, planning, launch such as setting project objectives, risk assessment, creating project scope, deliverables, resource allocation, etc. Pitch your topic with ease and precision using this Waterfall Project Management With Implementation Graphics PDF. This layout presents information on Project Requirements, Project Resource Allocation, Developing Project Deliverables. It is also available for immediate download and adjustment. So, changes can be made in the color, design, graphics or any other component to create a unique layout.
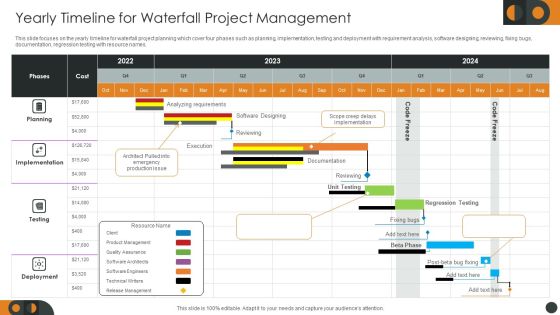
Yearly Timeline For Waterfall Project Management Clipart PDF
This slide focuses on the yearly timeline for waterfall project planning which cover four phases such as planning, implementation, testing and deployment with requirement analysis, software designing, reviewing, fixing bugs, documentation, regression testing with resource names. Pitch your topic with ease and precision using this Yearly Timeline For Waterfall Project Management Clipart PDF. This layout presents information on Planning, Implementation, Deployment. It is also available for immediate download and adjustment. So, changes can be made in the color, design, graphics or any other component to create a unique layout.

Four Commerce Marketing Electronic Initiative To Expand Beauty Business Topics PDF
This slide displays the initiatives that could be taken by the ecommerce beauty business for expansion. It includes create a community, add testimonials, press difference, unleash content marketing potential, etc. Pitch your topic with ease and precision using this Four Commerce Marketing Electronic Initiative To Expand Beauty Business Topics PDF. This layout presents information on Content Marketing, Potential, Product. It is also available for immediate download and adjustment. So, changes can be made in the color, design, graphics or any other component to create a unique layout.

Client Coverage Through Marketing Methods Ppt Inspiration Maker PDF
This slide displays the percentages of the amount of customers that are acquired by using these marketing methods. It includes influencer marketing, social media, guest blogging, paid distribution, etc. Pitch your topic with ease and precision using this Client Coverage Through Marketing Methods Ppt Inspiration Maker PDF. This layout presents information on Influencer Marketing, Paid Distribution, Social Media. It is also available for immediate download and adjustment. So, changes can be made in the color, design, graphics or any other component to create a unique layout.

Key Client Coverage Marketing Statistics Ppt Inspiration Design Inspiration PDF
This slide covers the stats for covering the customers for the betterment of the business and its speedily growth. It shows distribution channels used and region wise capturing of customers. Pitch your topic with ease and precision using this Key Client Coverage Marketing Statistics Ppt Inspiration Design Inspiration PDF. This layout presents information on Customer Penetration, Traditional, Indirect, Direct. It is also available for immediate download and adjustment. So, changes can be made in the color, design, graphics or any other component to create a unique layout.
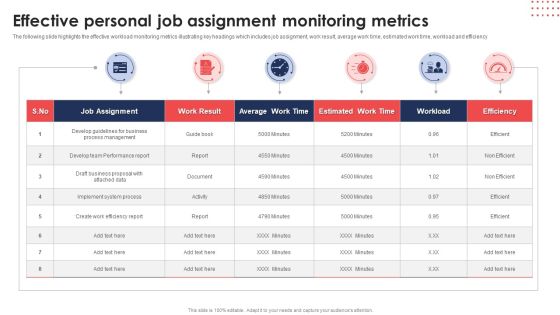
Effective Personal Job Assignment Monitoring Metrics Ppt Portfolio Samples PDF
The following slide highlights the effective workload monitoring metrics illustrating key headings which includes job assignment, work result, average work time, estimated work time, workload and efficiency. Pitch your topic with ease and precision using this Effective Personal Job Assignment Monitoring Metrics Ppt Portfolio Samples PDF. This layout presents information on Job Assignment, Work Result, Average Work Time. It is also available for immediate download and adjustment. So, changes can be made in the color, design, graphics or any other component to create a unique layout.
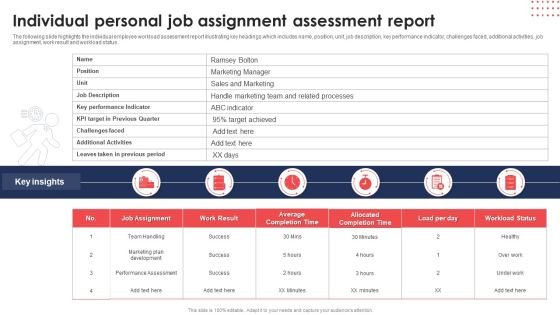
Individual Personal Job Assignment Assessment Report Ppt Model Brochure PDF
The following slide highlights the individual employee workload assessment report illustrating key headings which includes name, position, unit, job description, key performance indicator, challenges faced, additional activities, job assignment, work result and workload status. Pitch your topic with ease and precision using this Individual Personal Job Assignment Assessment Report Ppt Model Brochure PDF. This layout presents information on Job Assignment, Average Completion Time, Load Per Day. It is also available for immediate download and adjustment. So, changes can be made in the color, design, graphics or any other component to create a unique layout.

Personal Job Assessment Report With Action Ppt Professional Gallery PDF
The following slide highlights the employee workload assessment report with action illustrating key headings which includes name, job position, skill score, effort score, action needed and workload. Pitch your topic with ease and precision using this Personal Job Assessment Report With Action Ppt Professional Gallery PDF. This layout presents information on Skill Score, Effort Score, Action Needed. It is also available for immediate download and adjustment. So, changes can be made in the color, design, graphics or any other component to create a unique layout.
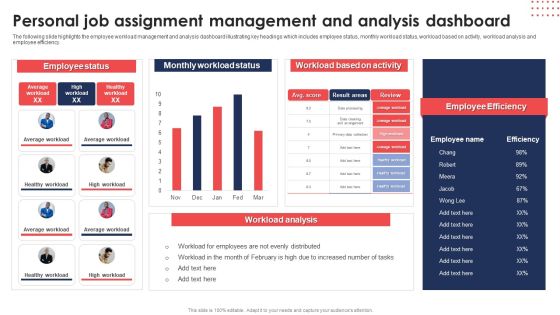
Personal Job Assignment Management And Analysis Dashboard Diagrams PDF
The following slide highlights the employee workload management and analysis dashboard illustrating key headings which includes employee status, monthly workload status, workload based on activity, workload analysis and employee efficiency. Pitch your topic with ease and precision using thisPersonal Job Assignment Management And Analysis Dashboard Diagrams PDF. This layout presents information on Employee Status, Monthly Workload Status, Workload Based Activity. It is also available for immediate download and adjustment. So, changes can be made in the color, design, graphics or any other component to create a unique layout.

Product Launch Time Relationship With Cost And Revenue Ppt Graphics PDF
The following slide highlights the time to market relationship with cost and revenue illustrating graphical representation of shorter time to market and longer time to market impact on cost, revenue and market establishment. Pitch your topic with ease and precision using this Product Launch Time Relationship With Cost And Revenue Ppt Graphics PDF. This layout presents information on Product Launch, Market Cost, Establish Market. It is also available for immediate download and adjustment. So, changes can be made in the color, design, graphics or any other component to create a unique layout.
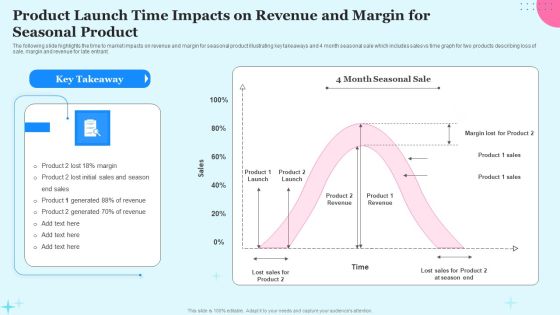
Product Launch Time Impacts On Revenue And Margin For Seasonal Product Brochure PDF
The following slide highlights the time to market impacts on revenue and margin for seasonal product illustrating key takeaways and 4 month seasonal sale which includes sales vs time graph for two products describing loss of sale, margin and revenue for late entrant. Pitch your topic with ease and precision using this Product Launch Time Impacts On Revenue And Margin For Seasonal Product Brochure PDF. This layout presents information on Product 1 Sales, Lost Sales, Time. It is also available for immediate download and adjustment. So, changes can be made in the color, design, graphics or any other component to create a unique layout.

Business Project Staff Costs Management Ppt PowerPoint Presentation Gallery Design Templates PDF
This slide contains the management of costs incurred by the project management team while working on a business project. It includes labor rate, estimated time, materials cost, planned and actual budget. Pitch your topic with ease and precision using this Business Project Staff Costs Management Ppt PowerPoint Presentation Gallery Design Templates PDF. This layout presents information on Project Budget Tasks, Estimated Time, Materials. It is also available for immediate download and adjustment. So, changes can be made in the color, design, graphics or any other component to create a unique layout.
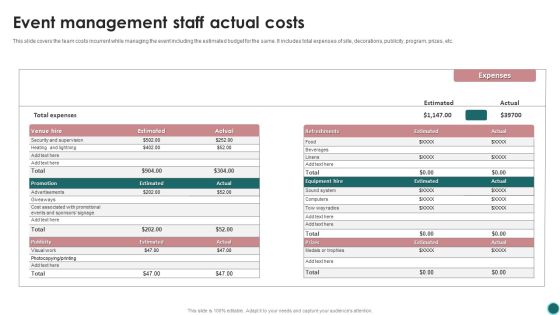
Event Management Staff Actual Costs Ppt PowerPoint Presentation File Background Images PDF
This slide covers the team costs incurrent while managing the event including the estimated budget for the same. It includes total expenses of site, decorations, publicity, program, prizes, etc. Pitch your topic with ease and precision using this Event Management Staff Actual Costs Ppt PowerPoint Presentation File Background Images PDF. This layout presents information on Total Expenses, Estimated, Actual, Expenses. It is also available for immediate download and adjustment. So, changes can be made in the color, design, graphics or any other component to create a unique layout.
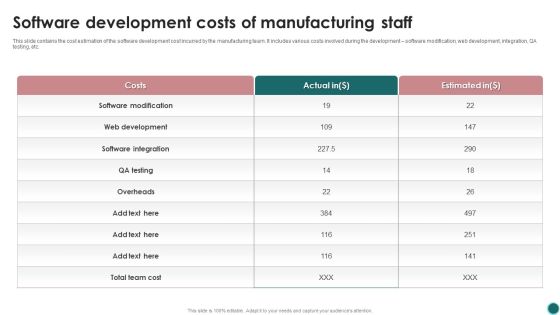
Software Development Costs Of Manufacturing Staff Ppt PowerPoint Presentation Gallery Backgrounds PDF
This slide contains the cost estimation of the software development cost incurred by the manufacturing team. It includes various costs involved during the development software modification, web development, integration, QA testing, etc. Pitch your topic with ease and precision using this Software Development Costs Of Manufacturing Staff Ppt PowerPoint Presentation Gallery Backgrounds PDF. This layout presents information on Web Development, Cost, Software Integration. It is also available for immediate download and adjustment. So, changes can be made in the color, design, graphics or any other component to create a unique layout.

Conference Plan For Project Management Event Background PDF
This slide showcases project management conference plan that can help to ensure smooth functioning of event and define clear set of objectives for each participant. It also outlines time duration to keep track of each activity. Pitch your topic with ease and precision using this Conference Plan For Project Management Event Background PDF. This layout presents information on Networking, Project Management, Technology. It is also available for immediate download and adjustment. So, changes can be made in the color, design, graphics or any other component to create a unique layout.

Departmental Goals Status And Assignment Progress Table Ppt File Example PDF
This slide illustrates tabular representation of status of each team members assignment. It includes team, member, task assigned and target due date and progress etc. Pitch your topic with ease and precision using this Departmental Goals Status And Assignment Progress Table Ppt File Example PDF. This layout presents information on Development Team, Sales Team, Testing Team. It is also available for immediate download and adjustment. So, changes can be made in the color, design, graphics or any other component to create a unique layout.
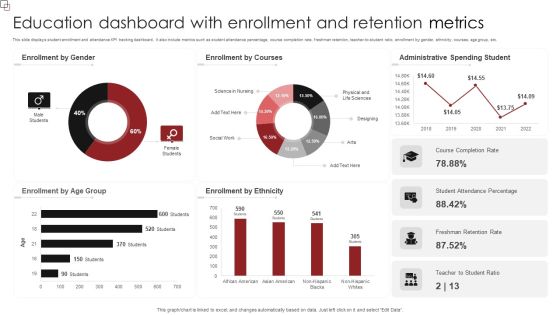
Education Dashboard With Enrollment And Retention Metrics Sample PDF
This slide displays student enrollment and attendance KPI tracking dashboard. It also include metrics such as student attendance percentage, course completion rate, freshman retention, teacher-to-student ratio, enrollment by gender, ethnicity, courses, age group, etc. Pitch your topic with ease and precision using this Education Dashboard With Enrollment And Retention Metrics Sample PDF. This layout presents information on Enrollment Gender, Enrollment Courses, Administrative Spending Student. It is also available for immediate download and adjustment. So, changes can be made in the color, design, graphics or any other component to create a unique layout.
 Home
Home