Order Management Dashboard

Customer Buying Journey With Big Data Powerpoint Slide
This is a customer buying journey with big data powerpoint slide. This is a five stage process. The stages in this process are customer analytics, operational analytics, fraud and compliance, edw optimization, new product innovation.
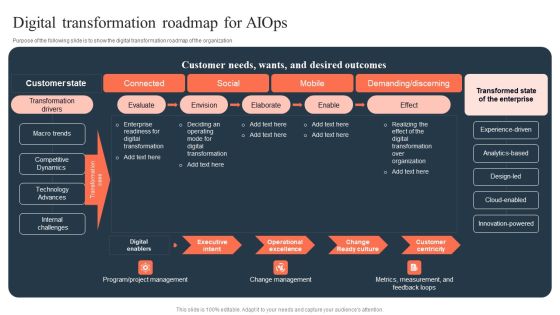
Ml And Big Data In Information Technology Processes Digital Transformation Roadmap For Aiops Graphics PDF
Purpose of the following slide is to show the digital transformation roadmap of the organization This modern and well arranged Ml And Big Data In Information Technology Processes Digital Transformation Roadmap For Aiops Graphics PDF provides lots of creative possibilities. It is very simple to customize and edit with the Powerpoint Software. Just drag and drop your pictures into the shapes. All facets of this template can be edited with Powerpoint no extra software is necessary. Add your own material, put your images in the places assigned for them, adjust the colors, and then you can show your slides to the world, with an animated slide included.

Objective Of Big Data Ppt PowerPoint Presentation Template
This is a objective of big data ppt powerpoint presentation template. This is a five stage process. The stages in this process are analyzing customer behavior, combining multiple data sources, improving customer service, generate additional revenue, be more responsive to the market.

4 Diverging Steps Of A Logical Sequence Circular Arrow Diagram PowerPoint Templates
We present our 4 diverging steps of a logical sequence Circular Arrow Diagram PowerPoint templates.Download our Success PowerPoint Templates because the choices you make today will determine the future growth of your enterprise. Download our Business PowerPoint Templates because you have churned your mind and come upwith solutions. Use our Arrows PowerPoint Templates because getting it done may not be enough. Download and present our Flow Charts PowerPoint Templates because in this Slide Various threads are joining up and being stitched together providing necessary strength Now you have to take the last leap. Download our Shapes PowerPoint Templates because you have it all down to a nicety, slice by slice, layer by layer.Use these PowerPoint slides for presentations relating to Arrow, Brochure, Business, Chart, Circle, Cyclic, Data, Diagram, Financial, Goal, Graph, Illustration, Info, Information, Investment, Manage, Marketing, Model, Option, Part, Pie, Presentation, Process, Result, Sphere, Statistics, Stock, Strategy, Template, Wheel. The prominent colors used in the PowerPoint template are Black, Gray, White. People tell us our 4 diverging steps of a logical sequence Circular Arrow Diagram PowerPoint templates provide you with a vast range of viable options. Select the appropriate ones and just fill in your text. Customers tell us our Chart PowerPoint templates and PPT Slides are Luxuriant. People tell us our 4 diverging steps of a logical sequence Circular Arrow Diagram PowerPoint templates are Versatile. Professionals tell us our Data PowerPoint templates and PPT Slides are Wistful. Customers tell us our 4 diverging steps of a logical sequence Circular Arrow Diagram PowerPoint templates look good visually. Use our Data PowerPoint templates and PPT Slides are Romantic.

Detection Data Decision And Delivery In Real Time Marketing Ppt Portfolio Graphic Tips PDF
The following slide showcases four Ds of real time marketing to determine its working and ensure comprehensive data analysis. It includes elements such as detection, data, decision, deliver, time based actions etc. Do you know about Slidesgeeks Detection Data Decision And Delivery In Real Time Marketing Ppt Portfolio Graphic Tips PDF These are perfect for delivering any kind od presentation. Using it, create PowerPoint presentations that communicate your ideas and engage audiences. Save time and effort by using our pre-designed presentation templates that are perfect for a wide range of topic. Our vast selection of designs covers a range of styles, from creative to business, and are all highly customizable and easy to edit. Download as a PowerPoint template or use them as Google Slides themes.

Comprehensive Guide On Customer Data Based Marketing Table Of Contents Ppt Inspiration Templates PDF
Boost your pitch with our creative Comprehensive Guide On Customer Data Based Marketing Table Of Contents Ppt Inspiration Templates PDF. Deliver an awe inspiring pitch that will mesmerize everyone. Using these presentation templates you will surely catch everyones attention. You can browse the ppts collection on our website. We have researchers who are experts at creating the right content for the templates. So you do not have to invest time in any additional work. Just grab the template now and use them.

Ml And Big Data In Information Technology Processes Our Organizations Aiops Platform Demonstration PDF
The purpose of the following slide is to show the entire AIOps platform of the organization as it shows the AIOps model which shows the pattern delivery, anomaly and causality detected. Present like a pro with Ml And Big Data In Information Technology Processes Our Organizations Aiops Platform Demonstration PDF Create beautiful presentations together with your team, using our easy to use presentation slides. Share your ideas in real time and make changes on the fly by downloading our templates. So whether you are in the office, on the go, or in a remote location, you can stay in sync with your team and present your ideas with confidence. With Slidegeeks presentation got a whole lot easier. Grab these presentations today.
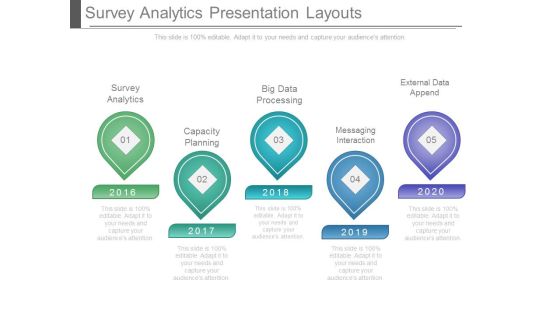
Survey Analytics Presentation Layouts
This is a survey analytics presentation layouts. This is a five stage process. The stages in this process are survey analytics, capacity planning, big data processing, messaging interaction, external data append.

Data Lineage Methods Introduction To Data Lineage Summary PDF
This slide represents the introduction to data lineage, including its overview and the type of queries it answers such as sources of data, location of its transformation, and destination. It also shows the three main components of the data lineage process such as metadata, process and system. Crafting an eye-catching presentation has never been more straightforward. Let your presentation shine with this tasteful yet straightforward Data Lineage Methods Introduction To Data Lineage Summary PDF template. It offers a minimalistic and classy look that is great for making a statement. The colors have been employed intelligently to add a bit of playfulness while still remaining professional. Construct the ideal Data Lineage Methods Introduction To Data Lineage Summary PDF that effortlessly grabs the attention of your audience Begin now and be certain to wow your customers

4 Diverging Steps Of Logical Sequence Circular Arrow Diagram PowerPoint Templates
We present our 4 diverging steps of logical sequence Circular Arrow Diagram PowerPoint templates.Present our Success PowerPoint Templates because the choices you make today will determine the future growth of your enterprise. Use our Business PowerPoint Templates because the NASA Space programme took mankind to the moon and so much more. Like them you too can look far beyond normal boundaries. Show them that in your mind the sky is certainly not the limit. Download and present our Arrows PowerPoint Templates because you have the moves to sway the market. Use our Flow Charts PowerPoint Templates because it helps you to clearly delegate the different tasks along with their necessary resources and responsibilities. Use our Shapes PowerPoint Templates because you know the path so show the way.Use these PowerPoint slides for presentations relating to Arrow, Brochure, Business, Chart, Circle, Cyclic, Data, Diagram, Financial, Goal, Graph, Illustration, Info, Information, Investment, Manage, Marketing, Model, Option, Part, Pie, Presentation, Process, Result, Sphere, Statistics, Stock, Strategy, Template, Wheel. The prominent colors used in the PowerPoint template are Yellow, Gray, White. People tell us our 4 diverging steps of logical sequence Circular Arrow Diagram PowerPoint templates are Luxuriant. Customers tell us our Financial PowerPoint templates and PPT Slides are Awesome. People tell us our 4 diverging steps of logical sequence Circular Arrow Diagram PowerPoint templates are Handsome. Professionals tell us our Financial PowerPoint templates and PPT Slides are Exuberant. Customers tell us our 4 diverging steps of logical sequence Circular Arrow Diagram PowerPoint templates are Adorable. Use our Data PowerPoint templates and PPT Slides will make the presenter successul in his career/life.

Comprehensive Guide To Build Marketing Strategy Different Types Of Marketing Process Control Infographics PDF
This slide presents various types of marketing controls to evaluate existing promotional efforts and identify improvement areas. It showcases types such as annual plan control, profitability control, efficiency control and strategic control. From laying roadmaps to briefing everything in detail, our templates are perfect for you. You can set the stage with your presentation slides. All you have to do is download these easy to edit and customizable templates. Comprehensive Guide To Build Marketing Strategy Different Types Of Marketing Process Control Infographics PDF will help you deliver an outstanding performance that everyone would remember and praise you for. Do download this presentation today.

Data Driven Insurance Sales Procedure Boosting Revenue Sample PDF
The following slide highlights insurance sales cycle based on data for predictive analysis and real-time insights. It boost company sales. It includes components such as integrate front and back office, customer centric sales and improve renewal rates. Persuade your audience using this Data Driven Insurance Sales Procedure Boosting Revenue Sample PDF. This PPT design covers three stages, thus making it a great tool to use. It also caters to a variety of topics including Customer Centric Sales, Improve Renewal Rates, Revenue. Download this PPT design now to present a convincing pitch that not only emphasizes the topic but also showcases your presentation skills

Operation Cost Ppt PowerPoint Presentation Background Designs
This is a operation cost ppt powerpoint presentation background designs. This is a three stage process. The stages in this process are operational equipment, raw material, salary, food beverage, other equipments.
Overview To Organizational Culture Introduction Enhancing Organization Productivity By Implementing Icons PDF
This slide covers overview to organizational culture and s contribution to enhance effectiveness. It involves four types of organization culture i.e. clan culture, adhocracy, market and hierarchy culture. The Overview To Organizational Culture Introduction Enhancing Organization Productivity By Implementing Icons PDF is a compilation of the most recent design trends as a series of slides. It is suitable for any subject or industry presentation, containing attractive visuals and photo spots for businesses to clearly express their messages. This template contains a variety of slides for the user to input data, such as structures to contrast two elements, bullet points, and slides for written information. Slidegeeks is prepared to create an impression.

Market Survey Process And Budget Evaluation Inspiration PDF
This slide showcases various steps for conducting a market research to gain insights for better decision making. It also includes timeline, task categories, budget, number of questions, distribution channel, responses received, average time taken to fill questionnaire, etc. Showcasing this set of slides titled Market Survey Process And Budget Evaluation Inspiration PDF. The topics addressed in these templates are Database, Report Publishing, Data Collection, Data Analysis. All the content presented in this PPT design is completely editable. Download it and make adjustments in color, background, font etc. as per your unique business setting.

Promotion Playbook For Content Development Web Performance Measurement Metrics Diagrams PDF
Mentioned slide shows the major key performance indicators used by organizations to measure their website performance. Metrics covered are related to organic traffic, inbound leads, bounce rate.Deliver an awe inspiring pitch with this creative Promotion Playbook For Content Development Web Performance Measurement Metrics Diagrams PDF bundle. Topics like Performance Indicators, Monthly Inbound, Bounce Maintained can be discussed with this completely editable template. It is available for immediate download depending on the needs and requirements of the user.

Business Cycle Diagram Colorful Slide Of Five Text Circles PowerPoint Slides
We present our business cycle diagram colorful slide of five text circles PowerPoint Slides.Use our Circle Charts PowerPoint Templates because You are an avid believer in ethical practices. Highlight the benefits that accrue with our PowerPoint Templates and Slides. Use our Ring Charts PowerPoint Templates because It will mark the footprints of your journey. Illustrate how they will lead you to your desired destination. Present our Process and Flows PowerPoint Templates because you can Set pulses racing with our PowerPoint Templates and Slides. They will raise the expectations of your team. Download and present our Business PowerPoint Templates because It will mark the footprints of your journey. Illustrate how they will lead you to your desired destination. Download our Shapes PowerPoint Templates because You aspire to touch the sky with glory. Let our PowerPoint Templates and Slides provide the fuel for your ascent.Use these PowerPoint slides for presentations relating to Boxes, brochure, business, button, catalog, chart, circle, company, cross, data, design, diagram, direction, document, financial, four, glossy, goals, graph, junction, management, market, marketing, model, multicolored, multiple, navigation, network, options, plan, presentation, process, purple, results, shiny, sphere, . The prominent colors used in the PowerPoint template are Pink, Gray, White. Professionals tell us our business cycle diagram colorful slide of five text circles PowerPoint Slides will help you be quick off the draw. Just enter your specific text and see your points hit home. Presenters tell us our chart PowerPoint templates and PPT Slides look good visually. The feedback we get is that our business cycle diagram colorful slide of five text circles PowerPoint Slides will make you look like a winner. Use our chart PowerPoint templates and PPT Slides are aesthetically designed to attract attention. We guarantee that they will grab all the eyeballs you need. You can be sure our business cycle diagram colorful slide of five text circles PowerPoint Slides are specially created by a professional team with vast experience. They diligently strive to come up with the right vehicle for your brilliant Ideas. Customers tell us our button PowerPoint templates and PPT Slides will make the presenter successul in his career/life.

Evaluate Performance By Monitoring Call Center Kpis Ppt PowerPoint Presentation File Diagrams PDF
This slide highlights call center key performance indicators which can be used to evaluate organization and employee performance which includes service level, response time, abandonment rate, quality monitoring scores, customer satisfaction and first call resolution. Present like a pro with Evaluate Performance By Monitoring Call Center Kpis Ppt PowerPoint Presentation File Diagrams PDF Create beautiful presentations together with your team, using our easy to use presentation slides. Share your ideas in real time and make changes on the fly by downloading our templates. So whether you are in the office, on the go, or in a remote location, you can stay in sync with your team and present your ideas with confidence. With Slidegeeks presentation got a whole lot easier. Grab these presentations today.

Data Lineage Implementation Introduction To Data Lineage Rules PDF
This slide represents the introduction to data lineage, including its overview and the type of queries it answers such as sources of data, location of its transformation, and destination. It also shows the three main components of the data lineage process such as metadata, process and system. This Data Lineage Implementation Introduction To Data Lineage Rules PDF from Slidegeeks makes it easy to present information on your topic with precision. It provides customization options, so you can make changes to the colors, design, graphics, or any other component to create a unique layout. It is also available for immediate download, so you can begin using it right away. Slidegeeks has done good research to ensure that you have everything you need to make your presentation stand out. Make a name out there for a brilliant performance.

Customer Support Center Evaluate Performance By Monitoring Call Center Kpis Professional PDF
This slide highlights call center key performance indicators which can be used to evaluate organization and employee performance which includes service level, response time, abandonment rate, quality monitoring scores, customer satisfaction and first call resolution. Find highly impressive Customer Support Center Evaluate Performance By Monitoring Call Center Kpis Professional PDF on Slidegeeks to deliver a meaningful presentation. You can save an ample amount of time using these presentation templates. No need to worry to prepare everything from scratch because Slidegeeks experts have already done a huge research and work for you. You need to download Customer Support Center Evaluate Performance By Monitoring Call Center Kpis Professional PDF for your upcoming presentation. All the presentation templates are 100 percent editable and you can change the color and personalize the content accordingly. Download now

Integrating Iiot To Improve Operational Efficiency Data Flow In Factory Processes Brochure PDF
This slide covers flow of information through different machines and equipment using iiot applications in a block diagram. It includes components such as equipment, OT devices, networks, and protocols involved in the i iot data flow and arrangement is placed in a hierarchical structure. Showcasing this set of slides titled Integrating Iiot To Improve Operational Efficiency Data Flow In Factory Processes Brochure PDF. The topics addressed in these templates are Enterprise Resource Planning, Asset Registry, Micro Controller. All the content presented in this PPT design is completely editable. Download it and make adjustments in color, background, font etc. as per your unique business setting.
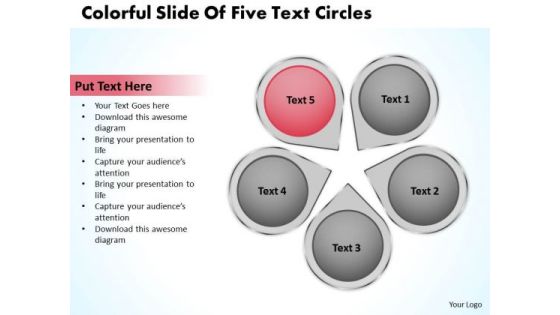
PowerPoint Graphics Business Colorful Slide Of Five Text Circles Slides
We present our powerpoint graphics business colorful slide of five text circles Slides.Use our Ring Charts PowerPoint Templates because Our PowerPoint Templates and Slides will let you meet your Deadlines. Use our Circle Charts PowerPoint Templates because Our PowerPoint Templates and Slides will let you Clearly mark the path for others to follow. Use our Process and Flows PowerPoint Templates because It can Conjure up grand ideas with our magical PowerPoint Templates and Slides. Leave everyone awestruck by the end of your presentation. Download our Shapes PowerPoint Templates because Our PowerPoint Templates and Slides will let you Hit the target. Go the full distance with ease and elan. Present our Business PowerPoint Templates because Our PowerPoint Templates and Slides will effectively help you save your valuable time. They are readymade to fit into any presentation structure. Use these PowerPoint slides for presentations relating to Boxes, brochure, business, button, catalog, chart, circle, company, cross, data, design, diagram, direction, document, financial, four, glossy, goals, graph, junction, management, market, marketing, model, multicolored, multiple, navigation, network, options, plan, presentation, process, purple, results, shiny, sphere, statistics. The prominent colors used in the PowerPoint template are Red, White, Black. Professionals tell us our powerpoint graphics business colorful slide of five text circles Slides look good visually. Presenters tell us our catalog PowerPoint templates and PPT Slides are topically designed to provide an attractive backdrop to any subject. The feedback we get is that our powerpoint graphics business colorful slide of five text circles Slides look good visually. Use our company PowerPoint templates and PPT Slides are readymade to fit into any presentation structure. You can be sure our powerpoint graphics business colorful slide of five text circles Slides are specially created by a professional team with vast experience. They diligently strive to come up with the right vehicle for your brilliant Ideas. Customers tell us our company PowerPoint templates and PPT Slides will generate and maintain the level of interest you desire. They will create the impression you want to imprint on your audience.
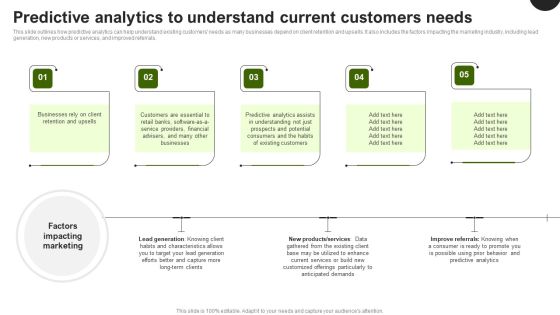
Predictive Analytics In The Age Of Big Data Predictive Analytics To Understand Current Customers Professional PDF
This slide outlines how predictive analytics can help understand existing customers needs as many businesses depend on client retention and upsells. It also includes the factors impacting the marketing industry, including lead generation, new products or services, and improved referrals. Here you can discover an assortment of the finest PowerPoint and Google Slides templates. With these templates, you can create presentations for a variety of purposes while simultaneously providing your audience with an eye catching visual experience. Download Predictive Analytics In The Age Of Big Data Predictive Analytics To Understand Current Customers Professional PDF to deliver an impeccable presentation. These templates will make your job of preparing presentations much quicker, yet still, maintain a high level of quality. Slidegeeks has experienced researchers who prepare these templates and write high quality content for you. Later on, you can personalize the content by editing the Predictive Analytics In The Age Of Big Data Predictive Analytics To Understand Current Customers Professional PDF.

Optimize Brand Valuation Key People Associated With Product Branding Team Mockup PDF
This slide provides information regarding key people associated with product branding team in terms of director of product marketing, director of brand and communications, director of product owner or manager, etc. The Optimize Brand Valuation Key People Associated With Product Branding Team Mockup PDF is a compilation of the most recent design trends as a series of slides. It is suitable for any subject or industry presentation, containing attractive visuals and photo spots for businesses to clearly express their messages. This template contains a variety of slides for the user to input data, such as structures to contrast two elements, bullet points, and slides for written information. Slidegeeks is prepared to create an impression.

Umbrella Branding Measures To Boost Brand Awareness Key People Associated With Product Branding Team Clipart PDF
This slide provides information regarding key people associated with product branding team in terms of director of product marketing, director of brand and communications, director of product owner manager, etc. The Umbrella Branding Measures To Boost Brand Awareness Key People Associated With Product Branding Team Clipart PDF is a compilation of the most recent design trends as a series of slides. It is suitable for any subject or industry presentation, containing attractive visuals and photo spots for businesses to clearly express their messages. This template contains a variety of slides for the user to input data, such as structures to contrast two elements, bullet points, and slides for written information. Slidegeeks is prepared to create an impression.
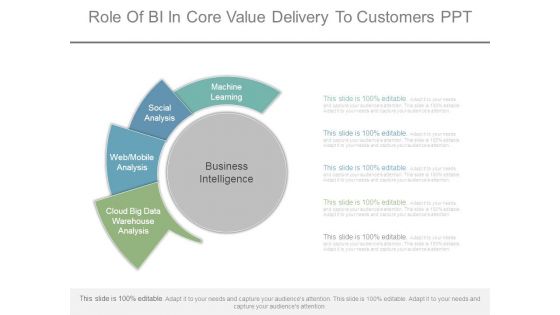
Role Of Bi In Core Value Delivery To Customers Ppt
This is a role of bi in core value delivery to customers ppt. This is a five stage process. The stages in this process are business intelligence, machine learning, social analysis, web mobile analysis, cloud big data warehouse analysis.

Data Analysis Process Diagram 9 Stages Ppt 8 Business Continuation Plan PowerPoint Slides
We present our data analysis process diagram 9 stages ppt 8 business continuation plan PowerPoint Slides.Use our Flow Charts PowerPoint Templates because It can Leverage your style with our PowerPoint Templates and Slides. Charm your audience with your ability. Use our Process and Flows PowerPoint Templates because You can Channelise the thoughts of your team with our PowerPoint Templates and Slides. Urge them to focus on the goals you have set. Download our Shapes PowerPoint Templates because Timeline crunches are a fact of life. Meet all deadlines using our PowerPoint Templates and Slides. Present our Business PowerPoint Templates because They will Put the wind in your sails. Skim smoothly over the choppy waters of the market. Present our Triangles PowerPoint Templates because Our PowerPoint Templates and Slides are endowed to endure. Ideas conveyed through them will pass the test of time.Use these PowerPoint slides for presentations relating to Saturation, strip, saturated, line, spectrum, pantone, bright, diagram, circle, sampler, guide, element, paint, scale,shape, ten, multicolored, palette, illustration, spectral, guidance, chart, collection, abstraction, selection, choice, visible, variation, painter, contrast, ,gradient, pattern, chooser, analyzer. The prominent colors used in the PowerPoint template are Blue, Gray, Black.

Website Cloud Data Transformation Process Flow Elements PDF
This slide shows website data migration process flow with key indicators. It provides information about customization, design, extensions, copy settings, starting migration, release, testing, etc. Showcasing this set of slides titled Website Cloud Data Transformation Process Flow Elements PDF. The topics addressed in these templates are Prep Work, Start Migration, Stop Admin Tasks. All the content presented in this PPT design is completely editable. Download it and make adjustments in color, background, font etc. as per your unique business setting.

Implementing Adaptive Work Arrangements Top Growth Drivers Of Flexible Working Formats PDF
The following slide outlines the various growth drivers due to which many corporates are switching to a hybrid model. The key drivers are technological advancement, environmental pressure, and cost savings. The Implementing Adaptive Work Arrangements Top Growth Drivers Of Flexible Working Formats PDF is a compilation of the most recent design trends as a series of slides. It is suitable for any subject or industry presentation, containing attractive visuals and photo spots for businesses to clearly express their messages. This template contains a variety of slides for the user to input data, such as structures to contrast two elements, bullet points, and slides for written information. Slidegeeks is prepared to create an impression.

Data Evaluation Analysis Process Ppt PowerPoint Presentation Complete Deck
Improve your presentation delivery using this data evaluation analysis process ppt powerpoint presentation complete deck. Support your business vision and objectives using this well-structured PPT deck. This template offers a great starting point for delivering beautifully designed presentations on the topic of your choice. Comprising twelve this professionally designed template is all you need to host discussion and meetings with collaborators. Each slide is self-explanatory and equipped with high-quality graphics that can be adjusted to your needs. Therefore, you will face no difficulty in portraying your desired content using this PPT slideshow. This PowerPoint slideshow contains every important element that you need for a great pitch. It is not only editable but also available for immediate download and utilization. The color, font size, background, shapes everything can be modified to create your unique presentation layout. Therefore, download it now.

Five Years Public Wellbeing Roadmap With Data Collection And Analysis Topics
Presenting the five years public wellbeing roadmap with data collection and analysis topics. The template includes a roadmap that can be used to initiate a strategic plan. Not only this, the PowerPoint slideshow is completely editable and you can effortlessly modify the font size, font type, and shapes according to your needs. This PPT slide can be easily reached in standard screen and widescreen aspect ratios. The set is also available in various formats like PDF, PNG, and JPG. So download and use it multiple times as per your knowledge.

Half Yearly Public Wellbeing Roadmap With Data Collection And Analysis Graphics
Presenting the half yearly public wellbeing roadmap with data collection and analysis graphics. The template includes a roadmap that can be used to initiate a strategic plan. Not only this, the PowerPoint slideshow is completely editable and you can effortlessly modify the font size, font type, and shapes according to your needs. This PPT slide can be easily reached in standard screen and widescreen aspect ratios. The set is also available in various formats like PDF, PNG, and JPG. So download and use it multiple times as per your knowledge.
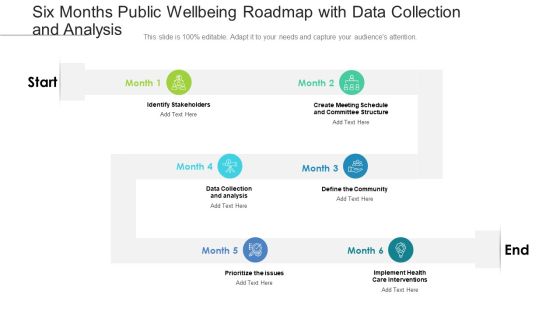
Six Months Public Wellbeing Roadmap With Data Collection And Analysis Clipart
Presenting the six months public wellbeing roadmap with data collection and analysis clipart. The template includes a roadmap that can be used to initiate a strategic plan. Not only this, the PowerPoint slideshow is completely editable and you can effortlessly modify the font size, font type, and shapes according to your needs. This PPT slide can be easily reached in standard screen and widescreen aspect ratios. The set is also available in various formats like PDF, PNG, and JPG. So download and use it multiple times as per your knowledge.
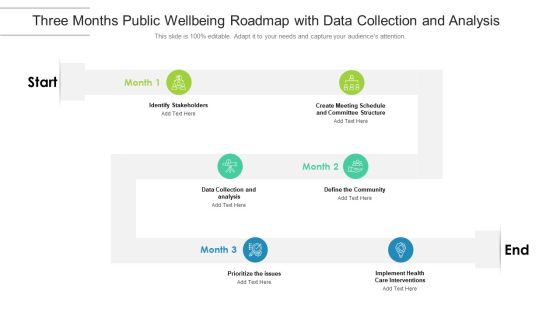
Three Months Public Wellbeing Roadmap With Data Collection And Analysis Guidelines
Presenting the three months public wellbeing roadmap with data collection and analysis guidelines. The template includes a roadmap that can be used to initiate a strategic plan. Not only this, the PowerPoint slideshow is completely editable and you can effortlessly modify the font size, font type, and shapes according to your needs. This PPT slide can be easily reached in standard screen and widescreen aspect ratios. The set is also available in various formats like PDF, PNG, and JPG. So download and use it multiple times as per your knowledge.

Key Metrics To Measure Success Of Instagram Marketing Campaign Designs PDF
The following slide outlines various key performance indicators KPIs through which marketers can evaluate success of Instagram reels, stories, and other strategies. The metrics are brand reach, impressions, post engagement rate, story views, reels engagement, etc. Find highly impressive Key Metrics To Measure Success Of Instagram Marketing Campaign Designs PDF on Slidegeeks to deliver a meaningful presentation. You can save an ample amount of time using these presentation templates. No need to worry to prepare everything from scratch because Slidegeeks experts have already done a huge research and work for you. You need to download Key Metrics To Measure Success Of Instagram Marketing Campaign Designs PDF for your upcoming presentation. All the presentation templates are 100 percent editable and you can change the color and personalize the content accordingly. Download now

Comprehensive Analysis Of Different Data Lineage Classification Five Ws Of Data Lineage System Designs PDF
This slide outlines the five Ws of the data lineage system and includes who, what, why, where and when. Each contains a list of questions that help perform data lineage and carry out valuable insights from the information. The Comprehensive Analysis Of Different Data Lineage Classification Five Ws Of Data Lineage System Designs PDF is a compilation of the most recent design trends as a series of slides. It is suitable for any subject or industry presentation, containing attractive visuals and photo spots for businesses to clearly express their messages. This template contains a variety of slides for the user to input data, such as structures to contrast two elements, bullet points, and slides for written information. Slidegeeks is prepared to create an impression.

AI And ML Driving Monetary Value For Organization Customer Data Processing Workflow Guidelines PDF
This slide illustrates customer data processing workflow. It cover three stages namely detection, prediction and generation. This is a ai and ml driving monetary value for organization customer data processing workflow guidelines pdf template with various stages. Focus and dispense information on three stages using this creative set, that comes with editable features. It contains large content boxes to add your information on topics like tangible benefits, intangible benefits. You can also showcase facts, figures, and other relevant content using this PPT layout. Grab it now.

Data Structure IT Introduction To Hierarchical Data Structuring Technique Summary PDF
Make sure to capture your audiences attention in your business displays with our gratis customizable Data Structure IT Introduction To Hierarchical Data Structuring Technique Summary PDF. These are great for business strategies, office conferences, capital raising or task suggestions. If you desire to acquire more customers for your tech business and ensure they stay satisfied, create your own sales presentation with these plain slides.
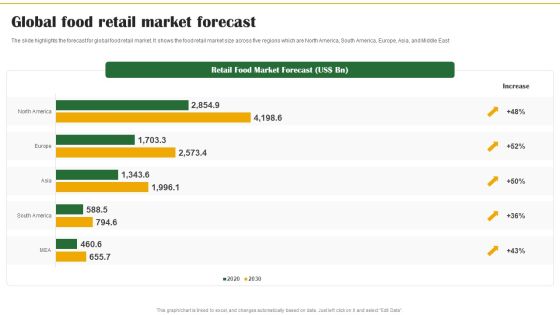
Food Organization Financial Trends Global Food Retail Market Forecast Formats PDF
The slide highlights the forecast for global food retail market. It shows the food retail market size across five regions which are North America, South America, Europe, Asia, and Middle East. Explore a selection of the finest Food Organization Financial Trends Global Food Retail Market Forecast Formats PDF here. With a plethora of professionally designed and pre-made slide templates, you can quickly and easily find the right one for your upcoming presentation. You can use our Food Organization Financial Trends Global Food Retail Market Forecast Formats PDF to effectively convey your message to a wider audience. Slidegeeks has done a lot of research before preparing these presentation templates. The content can be personalized and the slides are highly editable. Grab templates today from Slidegeeks.
Roadmap For Data Lake Implementation Data Lake Creation With Hadoop Cluster Icons PDF
This slide represents the roadmap for the data lake implementation and how information should gradually store, clean-up and presented to the users.Boost your pitch with our creative Roadmap For Data Lake Implementation Data Lake Creation With Hadoop Cluster Icons PDF. Deliver an awe-inspiring pitch that will mesmerize everyone. Using these presentation templates you will surely catch everyones attention. You can browse the ppts collection on our website. We have researchers who are experts at creating the right content for the templates. So you do not have to invest time in any additional work. Just grab the template now and use them.

Value Of Advanced Analytics To Enhance Client Support Ppt PowerPoint Presentation Portfolio Information PDF
Persuade your audience using this value of advanced analytics to enhance client support ppt powerpoint presentation portfolio information pdf. This PPT design covers four stages, thus making it a great tool to use. It also caters to a variety of topics including operations, analytics, standard reporting, raw data. Download this PPT design now to present a convincing pitch that not only emphasizes the topic but also showcases your presentation skills.

Market Research And Analysis Example Of Ppt Presentation
This is a market research and analysis example of ppt presentation. This is a seven stage process. The stages in this process are customer data, demand analysis, competitor analysis, market research and analysis, market segment definition, internal analysis, consumer development.
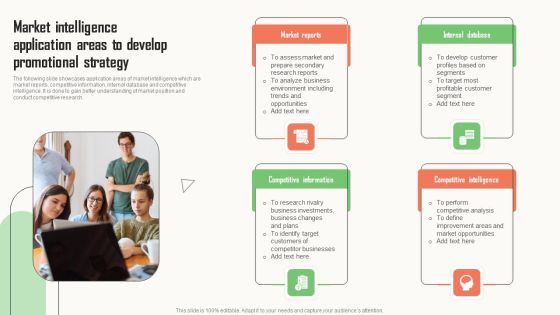
Strategic Market Insight Implementation Guide Market Intelligence Application Areas To Develop Promotional Designs PDF
The following slide showcases application areas of market intelligence which are market reports, competitive information, internal database and competitive intelligence. It is done to gain better understanding of market position and conduct competitive research. The Strategic Market Insight Implementation Guide Market Intelligence Application Areas To Develop Promotional Designs PDF is a compilation of the most recent design trends as a series of slides. It is suitable for any subject or industry presentation, containing attractive visuals and photo spots for businesses to clearly express their messages. This template contains a variety of slides for the user to input data, such as structures to contrast two elements, bullet points, and slides for written information. Slidegeeks is prepared to create an impression.

Overview Of Data Lineage By Data Tagging Technique Deploying Data Lineage IT Download PDF
This slide represents the overview of data lineage by parsing technique that reads the logic behind the automatic data processing. It also includes the tools and programming languages used by this technique such as STL logic, SQL, XML, Java and so on.This Overview Of Data Lineage By Data Tagging Technique Deploying Data Lineage IT Download PDF from Slidegeeks makes it easy to present information on your topic with precision. It provides customization options, so you can make changes to the colors, design, graphics, or any other component to create a unique layout. It is also available for immediate download, so you can begin using it right away. Slidegeeks has done good research to ensure that you have everything you need to make your presentation stand out. Make a name out there for a brilliant performance.
Determining Risks In Sales Administration Procedure Benefits Of Continuous Sales Risk Assessment Icons PDF
The following slide highlights the advantages of sales risk analysis to integrate and implement process effectively. It includes key elements such as facilitates data driven decision making, helps in gaining profitable customers, awareness to market trends, helps to better serve the customers etc. Create an editable Determining Risks In Sales Administration Procedure Benefits Of Continuous Sales Risk Assessment Icons PDF that communicates your idea and engages your audience. Whether youre presenting a business or an educational presentation, pre designed presentation templates help save time. Determining Risks In Sales Administration Procedure Benefits Of Continuous Sales Risk Assessment Icons PDF is highly customizable and very easy to edit, covering many different styles from creative to business presentations. Slidegeeks has creative team members who have crafted amazing templates. So, go and get them without any delay.

Submission Of Project Viability Report For Bank Loan Table Of Contents Elements PDF
Purpose of this slide is to address staffing strategy matrix. Here each strategy is identified as either directly applicable to a specific work type or indirectly applicable. The Submission Of Project Viability Report For Bank Loan Table Of Contents Elements PDF is a compilation of the most recent design trends as a series of slides. It is suitable for any subject or industry presentation, containing attractive visuals and photo spots for businesses to clearly express their messages. This template contains a variety of slides for the user to input data, such as structures to contrast two elements, bullet points, and slides for written information. Slidegeeks is prepared to create an impression.

Organization Future Demand And Supply Administration Formats PDF
The following slide highlights some ways to administer business future demand for reducing excess and preventing shortage of inventory. It includes activities such as analyzing historical data, evaluating future demand, coordinating viable expectations etc. Persuade your audience using this Organization Future Demand And Supply Administration Formats PDF. This PPT design covers Two stages, thus making it a great tool to use. It also caters to a variety of topics including Predict Customer Demand, Fulfil Customer Demand. Download this PPT design now to present a convincing pitch that not only emphasizes the topic but also showcases your presentation skills.

Acquisition Cost Per Customer Ppt PowerPoint Presentation Example 2015
This is a acquisition cost per customer ppt powerpoint presentation example 2015. This is a three stage process. The stages in this process are rising, steady, falling.
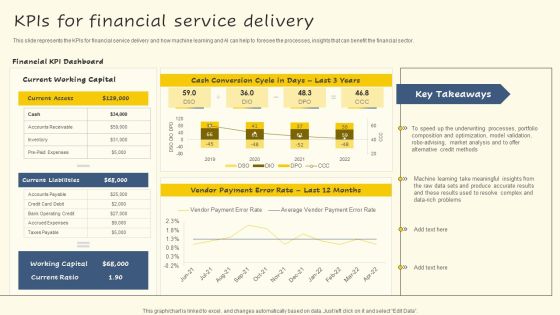
Kpis For Financial Service Delivery Background PDF
This slide represents the KPIs for financial service delivery and how machine learning and AI can help to foresee the processes, insights that can benefit the financial sector. If you are looking for a format to display your unique thoughts, then the professionally designed Kpis For Financial Service Delivery Background PDF is the one for you. You can use it as a Google Slides template or a PowerPoint template. Incorporate impressive visuals, symbols, images, and other charts. Modify or reorganize the text boxes as you desire. Experiment with shade schemes and font pairings. Alter, share or cooperate with other people on your work. Download Kpis For Financial Service Delivery Background PDF and find out how to give a successful presentation. Present a perfect display to your team and make your presentation unforgettable.

Company Budget Analysis Risks Faced By Organization In Outsourcing Marketing Activities Information PDF
The following slide provides information regarding the key risks faced by organization in outsourcing marketing activities to a digital agency. The major risks are loss of control, hidden charges, poor customer focus, exposing confidential data, poor communication and brand identity dilution. Coming up with a presentation necessitates that the majority of the effort goes into the content and the message you intend to convey. The visuals of a PowerPoint presentation can only be effective if it supplements and supports the story that is being told. Keeping this in mind our experts created Company Budget Analysis Risks Faced By Organization In Outsourcing Marketing Activities Information PDF to reduce the time that goes into designing the presentation. This way, you can concentrate on the message while our designers take care of providing you with the right template for the situation.

Big Data Analytics For Product Performance Ppt Slides
This is a big data analytics for product performance ppt slides. This is a five stage process. The stages in this process are consumer, customer, distribution, manufacturing, supplier, raw materials.

Playbook To Formulate Efficient Web Performance Measurement Metrics Diagrams PDF
Mentioned slide shows the major key performance indicators used by organizations to measure their website performance. Metrics covered are related to organic traffic, inbound leads, bounce rate. Slidegeeks has constructed Playbook To Formulate Efficient Web Performance Measurement Metrics Diagrams PDF after conducting extensive research and examination. These presentation templates are constantly being generated and modified based on user preferences and critiques from editors. Here, you will find the most attractive templates for a range of purposes while taking into account ratings and remarks from users regarding the content. This is an excellent jumping-off point to explore our content and will give new users an insight into our top-notch PowerPoint Templates.

Steps To Conduct Competitor Analysis Checklist For Data Collection To Gain Competitors Ideas PDF
The following slide showcases various information to be gathered for understanding rivalry business and perform competitor analysis. It showcases components such as employee count, founding year, investors, number of customers, merger and acquisitions, market share and business strength and weakness. This Steps To Conduct Competitor Analysis Checklist For Data Collection To Gain Competitors Ideas PDF is perfect for any presentation, be it in front of clients or colleagues. It is a versatile and stylish solution for organizing your meetings. The Steps To Conduct Competitor Analysis Checklist For Data Collection To Gain Competitors Ideas PDF features a modern design for your presentation meetings. The adjustable and customizable slides provide unlimited possibilities for acing up your presentation. Slidegeeks has done all the homework before launching the product for you. So, do not wait, grab the presentation templates today

Information Studies Roadmap To Integrate Data Science In The Organization Infographics PDF
This slide shows the roadmap to integrate data science in the business and what actions to be made at each stage after an interval of time. This is a Information Studies Roadmap To Integrate Data Science In The Organization Infographics PDF template with various stages. Focus and dispense information on four stages using this creative set, that comes with editable features. It contains large content boxes to add your information on topics like Data Acquisition, Final Data Analysis, Data Scientists. You can also showcase facts, figures, and other relevant content using this PPT layout. Grab it now.
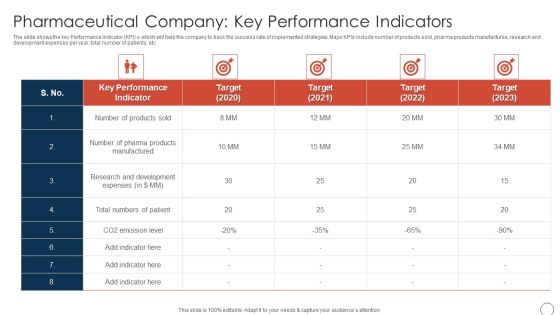
Pharmaceutical Company Key Performance Obtaining Sustainability Growing Pharmaceutical Organization Slides PDF
The slide shows the key Performance Indicator KPI s which will help the company to track the success rate of implemented strategies. Major KPIs include number of products sold, pharma products manufactures, research and development expenses per year, total number of patients, etc Deliver and pitch your topic in the best possible manner with this pharmaceutical company key performance obtaining sustainability growing pharmaceutical organization slides pdf. Use them to share invaluable insights on pharmaceutical company key performance indicators and impress your audience. This template can be altered and modified as per your expectations. So, grab it now.

Data And Customer Analysis Company Outline Capital Allocation Strategy Information PDF
This slide highlights the Nielsen company capital allocation strategy which includes investing to drive growth, strengthen balance sheet by focusing on de-levering and return capital to shareholders. Boost your pitch with our creative Data And Customer Analysis Company Outline Capital Allocation Strategy Information PDF. Deliver an awe-inspiring pitch that will mesmerize everyone. Using these presentation templates you will surely catch everyones attention. You can browse the ppts collection on our website. We have researchers who are experts at creating the right content for the templates. So you do not have to invest time in any additional work. Just grab the template now and use them.
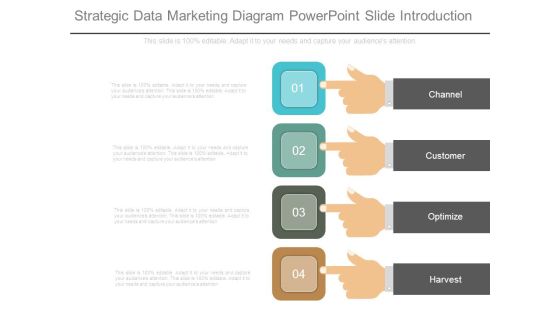
Strategic Data Marketing Diagram Powerpoint Slide Introduction
This is a strategic data marketing diagram powerpoint slide introduction. This is a four stage process. The stages in this process are channel, customer, optimize, harvest.
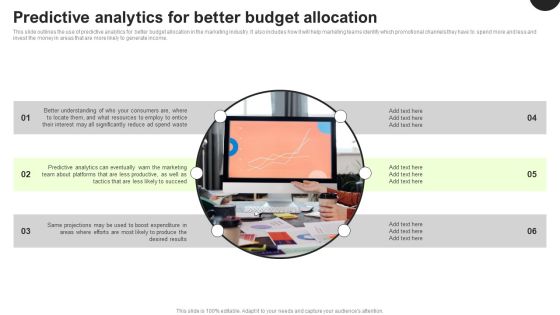
Predictive Analytics In The Age Of Big Data Predictive Analytics For Better Budget Allocation Inspiration PDF
This slide outlines the use of predictive analytics for better budget allocation in the marketing industry. It also includes how it will help marketing teams identify which promotional channels they have to spend more and less and invest the money in areas that are more likely to generate income. Make sure to capture your audiences attention in your business displays with our gratis customizable Predictive Analytics In The Age Of Big Data Predictive Analytics For Better Budget Allocation Inspiration PDF. These are great for business strategies, office conferences, capital raising or task suggestions. If you desire to acquire more customers for your tech business and ensure they stay satisfied, create your own sales presentation with these plain slides.

Key Pillars Of Sales Transformation Administration Ecosystem Summary PDF
The following slide exhibits sales transformation which focuses on remaking organization to deliver growth, profitability and strengthen customer loyalty. It presents information related to culture, metrics, etc. Persuade your audience using this Key Pillars Of Sales Transformation Administration Ecosystem Summary PDF. This PPT design covers four stages, thus making it a great tool to use. It also caters to a variety of topics including Culture And Behaviors, Strategy, Structure And Processes, Metrics And Rewards. Download this PPT design now to present a convincing pitch that not only emphasizes the topic but also showcases your presentation skills.
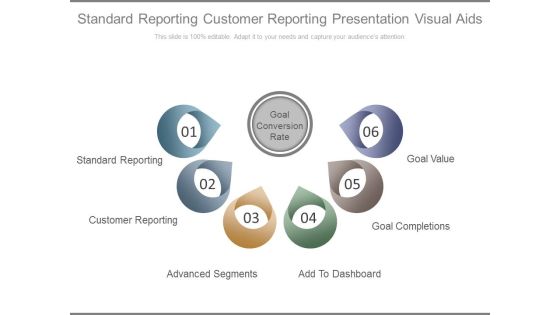
Standard Reporting Customer Reporting Presentation Visual Aids Ppt Slides
This is a standard reporting customer reporting presentation visual aids ppt slide. This is a six stage process. The stages in this process are business, marketing.

 Home
Home