Order Management Dashboard

New Business PowerPoint Presentation Process Circular Flow Network Slides
We present our new business powerpoint presentation process Circular Flow Network Slides.Download and present our Circle Charts PowerPoint Templates because the colour coding of our templates are specifically designed to highlight you points. Download and present our Arrows PowerPoint Templates because you can Trigger audience minds with your interesting ideas. Present our Business PowerPoint Templates because a lot of dissimilar elements needing to gel to strike the deal. Use our Shapes PowerPoint Templates because this slide brings grey areas to the table and explain in detail you assessment of the need for care to ensure continued smooth progress. Present our Flow Charts PowerPoint Templates because you can Raise your Company stocks at the Opening Bell.Use these PowerPoint slides for presentations relating to achievement, adding, analyzing, arrow, art, background, blank, blue, business, chart, colorful, cycle, data, design, diagram, element, flow, graph, graphic, gray, green, icon, linear, management, market, numbers, orange, percent, process, project, red, round, stock, success, up, value, wheel, white. The prominent colors used in the PowerPoint template are Blue, Red, pink. Customers tell us our new business powerpoint presentation process Circular Flow Network Slides are Enchanting. PowerPoint presentation experts tell us our business PowerPoint templates and PPT Slides are Bright. People tell us our new business powerpoint presentation process Circular Flow Network Slides are topically designed to provide an attractive backdrop to any subject. People tell us our arrow PowerPoint templates and PPT Slides are Nostalgic. Customers tell us our new business powerpoint presentation process Circular Flow Network Slides are Efficacious. People tell us our blank PowerPoint templates and PPT Slides are Endearing.

Supplier Performance Evaluation Program Kpis Ppt Infographics Slide PDF
The following slide highlights the supplier performance evaluation program metrics illustrating key headings which includes evaluation components, weightage and supplier. Where evaluation components consists of cost, quality , delivery and total score. Showcasing this set of slides titled Supplier Performance Evaluation Program Kpis Ppt Infographics Slide PDF. The topics addressed in these templates are Evaluation Components, Cost, Price Competitiveness. All the content presented in this PPT design is completely editable. Download it and make adjustments in color, background, font etc. as per your unique business setting.

Initiating Kpis And Deadline Achievement Benchmarka Building Efficient Workplace Performance Download PDF
This slide showcases introducing key performance indicators KPIs and deadline achievement benchmark. It provides information about team, goal, data collection source, reporting, assessment, target, customer satisfaction, efficiency, etc.Present like a pro with Initiating Kpis And Deadline Achievement Benchmarka Building Efficient Workplace Performance Download PDF Create beautiful presentations together with your team, using our easy-to-use presentation slides. Share your ideas in real-time and make changes on the fly by downloading our templates. So whether you are in the office, on the go, or in a remote location, you can stay in sync with your team and present your ideas with confidence. With Slidegeeks presentation got a whole lot easier. Grab these presentations today.
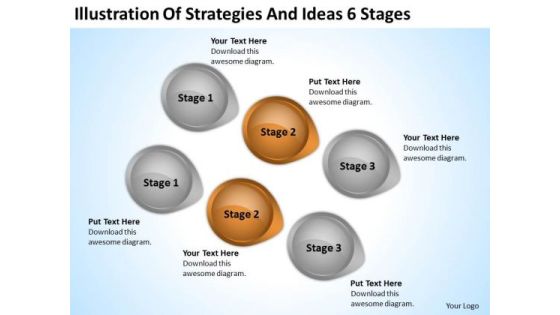
PowerPoint Arrow Shapes Illustration Of Strategies And Ideas 6 Stages Ppt Slide
We present our powerpoint arrow shapes illustration of strategies and ideas 6 stages ppt Slide.Download our Circle Charts PowerPoint Templates because You can Be the star of the show with our PowerPoint Templates and Slides. Rock the stage with your ideas. Use our Ring Charts PowerPoint Templates because Our PowerPoint Templates and Slides offer you the needful to organise your thoughts. Use them to list out your views in a logical sequence. Use our Process and Flows PowerPoint Templates because Our PowerPoint Templates and Slides are effectively colour coded to prioritise your plans They automatically highlight the sequence of events you desire. Download and present our Success PowerPoint Templates because Our PowerPoint Templates and Slides will steer your racing mind. Hit the right buttons and spur on your audience. Download our Shapes PowerPoint Templates because Our PowerPoint Templates and Slides are like the strings of a tennis racquet. Well strung to help you serve aces.Use these PowerPoint slides for presentations relating to Abstract, access, brochure, business, catalog, chart, circle,color, colorful, concept, conceptual,connection, corporate, creative, cycle,dark, design, diagram, different, vector, five, frame, graphic, group, idea,illustration, information, item,management, marketing, model,navigation, options, parts, piece, plan,presentation, report, round, shape,solution, speech, strategy, structure. The prominent colors used in the PowerPoint template are Brown, Gray, Black. PowerPoint presentation experts tell us our powerpoint arrow shapes illustration of strategies and ideas 6 stages ppt Slide will make the presenter successul in his career/life. Presenters tell us our business PowerPoint templates and PPT Slides will make the presenter successul in his career/life. Use our powerpoint arrow shapes illustration of strategies and ideas 6 stages ppt Slide are second to none. People tell us our catalog PowerPoint templates and PPT Slides provide great value for your money. Be assured of finding the best projection to highlight your words. Presenters tell us our powerpoint arrow shapes illustration of strategies and ideas 6 stages ppt Slide are readymade to fit into any presentation structure. Presenters tell us our color PowerPoint templates and PPT Slides help you meet deadlines which are an element of today's workplace. Just browse and pick the slides that appeal to your intuitive senses.
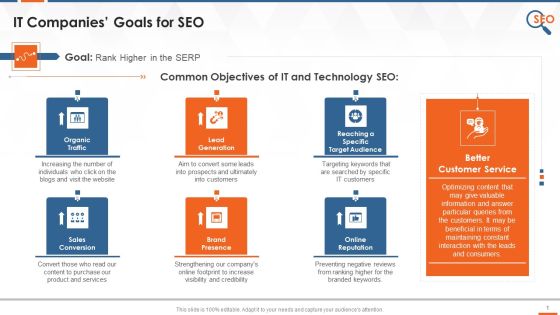
SEO Goals For IT Companies To Target Training Ppt
This slide covers the goals of IT companies for doing SEO such as increasing organic traffic, leads, sales conversion, online reputation, brand presence, defining target market, better customer service, etc.

Why Do Businesses Need SEO Training Ppt
The purpose of this slide is to highlight the significance of SEO for business organizations as it improves online visibility, increases website traffic, ensures a better conversion rate, and helps in building builds trust and credibility of potential customers.
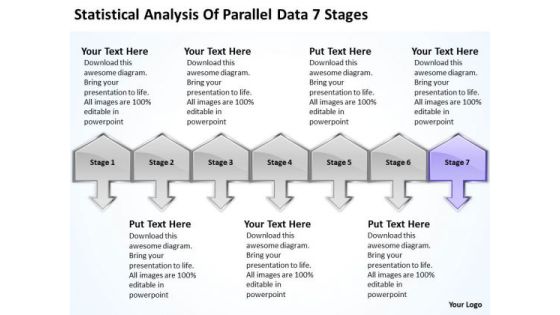
Statistical Analysis Of Parallel Data 7 Stages Ppt Help With Business Plan PowerPoint Slides
We present our statistical analysis of parallel data 7 stages ppt help with business plan PowerPoint Slides.Download and present our Communication PowerPoint Templates because You have gained great respect for your brilliant ideas. Use our PowerPoint Templates and Slides to strengthen and enhance your reputation. Present our Business PowerPoint Templates because you have developed a vision of where you want to be a few years from now. Use our Arrows PowerPoint Templates because this business powerpoint template helps expound on the logic of your detailed thought process to take your company forward. Download our Success PowerPoint Templates because iT outlines the entire thought process for the benefit of others. Tell it to the world with your characteristic aplomb. Use our Symbol PowerPoint Templates because this template helps you to bring your audiences to the table.Use these PowerPoint slides for presentations relating to 3d, Achievement, Action, Aim, Arrows, Black, Business, Color, Communication, Competition, Concept, Connection, Creative, Design, Different, Direction, Element, First, Forward, Graph, Graphic, Group, Growth, Higher, Icon, Illustration, Image, Isolated, Leader, Leadership, Line, Menu, Motion, Orange, Progress, Series, Seven, Sign, Slew, Solution, Success, Swerve, Symbol, Team, Teamwork, Turn, Up. The prominent colors used in the PowerPoint template are Purple, Gray, Black. Customers tell us our statistical analysis of parallel data 7 stages ppt help with business plan PowerPoint Slides will generate and maintain the level of interest you desire. They will create the impression you want to imprint on your audience. Use our Arrows PowerPoint templates and PPT Slides are Magnificent. PowerPoint presentation experts tell us our statistical analysis of parallel data 7 stages ppt help with business plan PowerPoint Slides will help them to explain complicated concepts. People tell us our Action PowerPoint templates and PPT Slides will make the presenter successul in his career/life. We assure you our statistical analysis of parallel data 7 stages ppt help with business plan PowerPoint Slides are Precious. People tell us our Aim PowerPoint templates and PPT Slides are Pleasant.
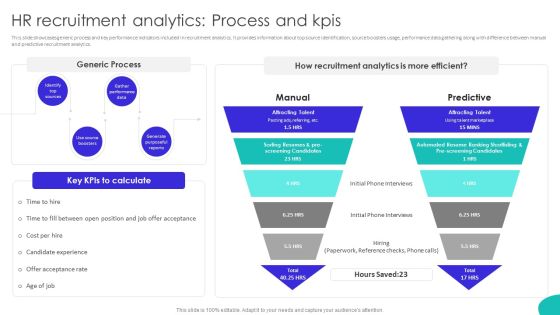
Improving Technology Based HR Recruitment Analytics Process And Kpis Designs PDF
This slide showcases generic process and key performance indicators included in recruitment analytics. It provides information about top source identification, source boosters usage, performance data gathering along with difference between manual and predictive recruitment analytics. Are you in need of a template that can accommodate all of your creative concepts This one is crafted professionally and can be altered to fit any style. Use it with Google Slides or PowerPoint. Include striking photographs, symbols, depictions, and other visuals. Fill, move around, or remove text boxes as desired. Test out color palettes and font mixtures. Edit and save your work, or work with colleagues. Download Improving Technology Based HR Recruitment Analytics Process And Kpis Designs PDF and observe how to make your presentation outstanding. Give an impeccable presentation to your group and make your presentation unforgettable.

Data And Customer Analysis Company Outline One Product Roadmap Introduction PDF
This slide highlights Nielsen ONE product rollout roadmap which showcases 3 years of development including digital product transformation, streaming panel expansion, Nielsen ONE ads. The Data And Customer Analysis Company Outline One Product Roadmap Introduction PDF is a compilation of the most recent design trends as a series of slides. It is suitable for any subject or industry presentation, containing attractive visuals and photo spots for businesses to clearly express their messages. This template contains a variety of slides for the user to input data, such as structures to contrast two elements, bullet points, and slides for written information. Slidegeeks is prepared to create an impression.
Key Performance Indicators Examples Marketing Ppt PowerPoint Presentation Ideas Clipart Cpb
Presenting this set of slides with name key performance indicators examples marketing ppt powerpoint presentation ideas clipart cpb. This is a four stage process. The stages in this process are key performance indicators examples marketing. This is a completely editable PowerPoint presentation and is available for immediate download. Download now and impress your audience.
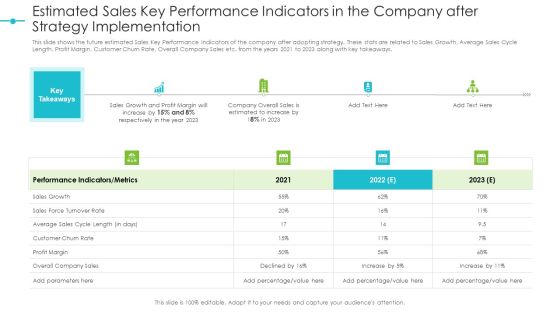
Estimated Sales Key Performance Indicators In The Company After Strategy Implementation Structure PDF
This slide shows the future estimated Sales Key Performance Indicators of the company after adopting strategy. These stats are related to Sales Growth, Average Sales Cycle Length, Profit Margin, Customer Churn Rate, Overall Company Sales etc. from the years 2021 to 2023 along with key takeaways. This is a estimated sales key performance indicators in the company after strategy implementation structure pdf template with various stages. Focus and dispense information on four stages using this creative set, that comes with editable features. It contains large content boxes to add your information on topics like performance, sales, growth, profit margin. You can also showcase facts, figures, and other relevant content using this PPT layout. Grab it now.
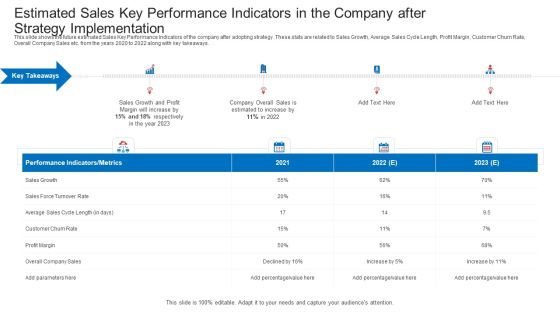
Estimated Sales Key Performance Indicators In The Company After Strategy Implementation Information PDF
This slide shows the future estimated Sales Key Performance Indicators of the company after adopting strategy. These stats are related to Sales Growth, Average Sales Cycle Length, Profit Margin, Customer Churn Rate, Overall Company Sales etc. from the years 2021 to 2023 along with key takeaways. This is a estimated sales key performance indicators in the company after strategy implementation information pdf template with various stages. Focus and dispense information on four stages using this creative set, that comes with editable features. It contains large content boxes to add your information on topics like performance, sales, growth, profit margin. You can also showcase facts, figures, and other relevant content using this PPT layout. Grab it now.

Statistical Analysis Of Parallel Data 7 Stages Fashion Business Plan PowerPoint Slides
We present our statistical analysis of parallel data 7 stages fashion business plan PowerPoint Slides.Download our Communication PowerPoint Templates because there is a key aspect to be emphasised. Present our Business PowerPoint Templates because watch the excitement levels rise as they realise their worth. Download our Arrows PowerPoint Templates because our PowerPoint templates designed for your ideas to sell. Download our Success PowerPoint Templates because your quest has taken you well onto the path of success. Download our Symbol PowerPoint Templates because they will Amplify your basic corporate concept and forefront the benefits of overlapping processes to arrive at common goals.Use these PowerPoint slides for presentations relating to 3d, Achievement, Action, Aim, Arrows, Black, Business, Color, Communication, Competition, Concept, Connection, Creative, Design, Different, Direction, Element, First, Forward, Graph, Graphic, Group, Growth, Higher, Icon, Illustration, Image, Isolated, Leader, Leadership, Line, Menu, Motion, Orange, Progress, Series, Seven, Sign, Slew, Solution, Success, Swerve, Symbol, Team, Teamwork, Turn, Up. The prominent colors used in the PowerPoint template are Blue, Gray, Black. Customers tell us our statistical analysis of parallel data 7 stages fashion business plan PowerPoint Slides are Awesome. Use our Business PowerPoint templates and PPT Slides will get their audience's attention. PowerPoint presentation experts tell us our statistical analysis of parallel data 7 stages fashion business plan PowerPoint Slides are Awesome. People tell us our Aim PowerPoint templates and PPT Slides are Sparkling. We assure you our statistical analysis of parallel data 7 stages fashion business plan PowerPoint Slides are Royal. People tell us our Black PowerPoint templates and PPT Slides are Detailed.

Information Technology Operations Administration With ML Our Organizations Aiops Platform Rules PDF
The purpose of the following slide is to show the entire AIOps platform of the organization as it shows the AIOps model which shows the pattern delivery, anomaly and causality detected. The Information Technology Operations Administration With ML Our Organizations Aiops Platform Rules PDF is a compilation of the most recent design trends as a series of slides. It is suitable for any subject or industry presentation, containing attractive visuals and photo spots for businesses to clearly express their messages. This template contains a variety of slides for the user to input data, such as structures to contrast two elements, bullet points, and slides for written information. Slidegeeks is prepared to create an impression.
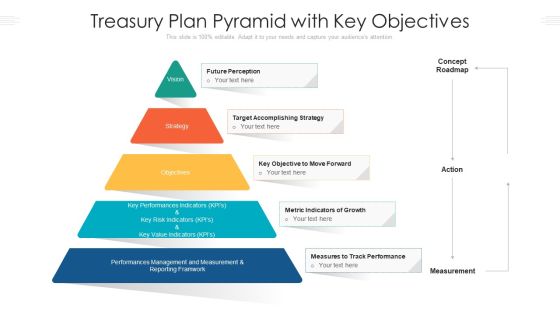
Treasury Plan Pyramid With Key Objectives Ppt PowerPoint Presentation Gallery Example Topics PDF
Presenting treasury plan pyramid with key objectives ppt powerpoint presentation gallery example topics pdf to dispense important information. This template comprises five stages. It also presents valuable insights into the topics including future perception, accomplishing strategy, metric indicators of growth, track performance. This is a completely customizable PowerPoint theme that can be put to use immediately. So, download it and address the topic impactfully.
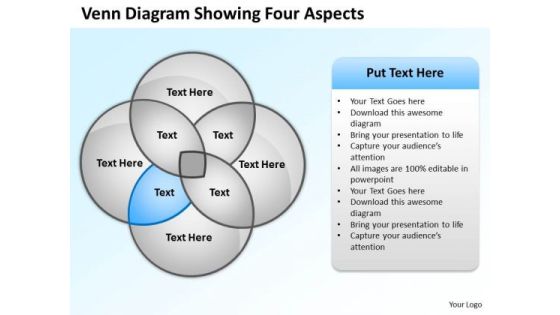
Business Organizational Chart Template Venn Diagram Showing Four Aspects PowerPoint Slides
We present our business organizational chart template venn diagram showing four aspects PowerPoint Slides.Use our Ring Charts PowerPoint Templates because Your audience will believe you are the cats whiskers. Download our Circle Charts PowerPoint Templates because You are well armed with penetrative ideas. Our PowerPoint Templates and Slides will provide the gunpowder you need. Download and present our Process and Flows PowerPoint Templates because They will Put your wonderful verbal artistry on display. Our PowerPoint Templates and Slides will provide you the necessary glam and glitter. Download and present our Flow Charts PowerPoint Templates because Our PowerPoint Templates and Slides help you meet the demand of the Market. Just browse and pick the slides that appeal to your intuitive senses. Download our Business PowerPoint Templates because Our PowerPoint Templates and Slides will let you Illuminate the road ahead to Pinpoint the important landmarks along the way.Use these PowerPoint slides for presentations relating to Business, button, catalog, chart, circle, company, cross, data, design, diagram, direction, document, financial, four, glossy, goals, graph, junction, management, market, marketing, model, multicolored, multiple, navigation, network, options, plan, presentation, process, purple, results, shiny, sphere, statistics. The prominent colors used in the PowerPoint template are Blue light, White, Gray. People tell us our business organizational chart template venn diagram showing four aspects PowerPoint Slides are effectively colour coded to prioritise your plans They automatically highlight the sequence of events you desire. PowerPoint presentation experts tell us our data PowerPoint templates and PPT Slides will impress their bosses and teams. Presenters tell us our business organizational chart template venn diagram showing four aspects PowerPoint Slides will generate and maintain the level of interest you desire. They will create the impression you want to imprint on your audience. Use our data PowerPoint templates and PPT Slides are effectively colour coded to prioritise your plans They automatically highlight the sequence of events you desire. Customers tell us our business organizational chart template venn diagram showing four aspects PowerPoint Slides are specially created by a professional team with vast experience. They diligently strive to come up with the right vehicle for your brilliant Ideas. People tell us our chart PowerPoint templates and PPT Slides are incredible easy to use.

3 Months Data Analytics Implementation Roadmap Elements
Presenting our innovatively-structured 3 months data analytics implementation roadmap elements Template. Showcase your roadmap process in different formats like PDF, PNG, and JPG by clicking the download button below. This PPT design is available in both Standard Screen and Widescreen aspect ratios. It can also be easily personalized and presented with modified font size, font type, color, and shapes to measure your progress in a clear way.

5 Year Data Analytics Implementation Roadmap Topics
Presenting our innovatively-structured 5 year data analytics implementation roadmap topics Template. Showcase your roadmap process in different formats like PDF, PNG, and JPG by clicking the download button below. This PPT design is available in both Standard Screen and Widescreen aspect ratios. It can also be easily personalized and presented with modified font size, font type, color, and shapes to measure your progress in a clear way.

6 Months Data Analytics Roadmap Diagrams
Presenting our innovatively-structured 6 months data analytics roadmap diagrams Template. Showcase your roadmap process in different formats like PDF, PNG, and JPG by clicking the download button below. This PPT design is available in both Standard Screen and Widescreen aspect ratios. It can also be easily personalized and presented with modified font size, font type, color, and shapes to measure your progress in a clear way.

Half Yearly Data Analytics Roadmap Ideas
Presenting our innovatively-structured half yearly data analytics roadmap ideas Template. Showcase your roadmap process in different formats like PDF, PNG, and JPG by clicking the download button below. This PPT design is available in both Standard Screen and Widescreen aspect ratios. It can also be easily personalized and presented with modified font size, font type, color, and shapes to measure your progress in a clear way.

Quarterly Data Analytics Implementation Roadmap Pictures
Presenting our innovatively-structured quarterly data analytics implementation roadmap pictures Template. Showcase your roadmap process in different formats like PDF, PNG, and JPG by clicking the download button below. This PPT design is available in both Standard Screen and Widescreen aspect ratios. It can also be easily personalized and presented with modified font size, font type, color, and shapes to measure your progress in a clear way.

Digital Advertising Plan For Bakery Business Word Of Mouth Marketing Overview Pictures PDF
This slide provides glimpse about summary of Word-of-Mouth WOM marketing that can help the bakery business for building brand awareness and build customer loyalty. It includes WOM marketing description, how does it work, pros, cons, etc. The Digital Advertising Plan For Bakery Business Word Of Mouth Marketing Overview Pictures PDF is a compilation of the most recent design trends as a series of slides. It is suitable for any subject or industry presentation, containing attractive visuals and photo spots for businesses to clearly express their messages. This template contains a variety of slides for the user to input data, such as structures to contrast two elements, bullet points, and slides for written information. Slidegeeks is prepared to create an impression.
Business People Vector 3d Men With Bar Graph PowerPoint Slides
We present our business people vector 3d men with bar graph PowerPoint Slides.Use our People PowerPoint Templates because Our PowerPoint Templates and Slides are a sure bet. Gauranteed to win against all odds. Download and present our Business PowerPoint Templates because Our PowerPoint Templates and Slides will bullet point your ideas. See them fall into place one by one. Download and present our Flow Charts PowerPoint Templates because Our PowerPoint Templates and Slides are created by a hardworking bunch of busybees. Always flitting around with solutions gauranteed to please. Download our Marketing PowerPoint Templates because It can Bubble and burst with your ideas. Use our Shapes PowerPoint Templates because Our PowerPoint Templates and Slides will let you Leave a lasting impression to your audiences. They possess an inherent longstanding recall factor.Use these PowerPoint slides for presentations relating to 3d, accounting, analysis, bar, business, cartoon,cash, character, chart, clipart, committee, company, concept, corporate,council, directors, display, document, economics, executive, figure, finance,financial, goal, graph, group, growth, guy, human, humanoid, man, management,market, meeting, money, office, percentage, performance, pie, presentation, report,room, statistics, table, team. The prominent colors used in the PowerPoint template are Yellow, Black, Gray. Professionals tell us our business people vector 3d men with bar graph PowerPoint Slides have awesome images to get your point across. Professionals tell us our analysis PowerPoint templates and PPT Slides will help you be quick off the draw. Just enter your specific text and see your points hit home. People tell us our business people vector 3d men with bar graph PowerPoint Slides effectively help you save your valuable time. Customers tell us our bar PowerPoint templates and PPT Slides are effectively colour coded to prioritise your plans They automatically highlight the sequence of events you desire. The feedback we get is that our business people vector 3d men with bar graph PowerPoint Slides will generate and maintain the level of interest you desire. They will create the impression you want to imprint on your audience. Use our business PowerPoint templates and PPT Slides have awesome images to get your point across.
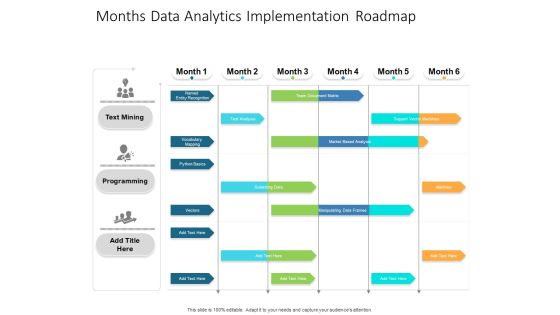
Months Data Analytics Implementation Roadmap Structure
Presenting our jaw-dropping months data analytics implementation roadmap structure. You can alternate the color, font size, font type, and shapes of this PPT layout according to your strategic process. This PPT presentation is compatible with Google Slides and is available in both standard screen and widescreen aspect ratios. You can also download this well-researched PowerPoint template design in different formats like PDF, JPG, and PNG. So utilize this visually-appealing design by clicking the download button given below.

Quarterly Roadmap For Data Analytics Technology Slides
Presenting our jaw-dropping quarterly roadmap for data analytics technology slides. You can alternate the color, font size, font type, and shapes of this PPT layout according to your strategic process. This PPT presentation is compatible with Google Slides and is available in both standard screen and widescreen aspect ratios. You can also download this well-researched PowerPoint template design in different formats like PDF, JPG, and PNG. So utilize this visually-appealing design by clicking the download button given below.

Customer Loyalty Diagram Powerpoint Slide Template
This is a customer loyalty diagram powerpoint slide template. This is a seven stage process. The stages in this process are customer loyalty, quality, customer experience, satisfaction, reward, service, customer satisfaction.

Comprehensive Customer Data Platform Guide Optimizing Promotional Initiatives Traeger Grills Cdp Execution Outcomes Sample PDF
The following slide illustrates key benefits gained by Trager Grills post customer platform adoption to attract and retain customers. It includes elements such as challenges, solutions, outcomes, data driven decision making, predictive marketing, click rate, conversion rates etc. Do you have an important presentation coming up Are you looking for something that will make your presentation stand out from the rest Look no further than Comprehensive Customer Data Platform Guide Optimizing Promotional Initiatives Traeger Grills Cdp Execution Outcomes Sample PDF. With our professional designs, you can trust that your presentation will pop and make delivering it a smooth process. And with Slidegeeks, you can trust that your presentation will be unique and memorable. So why wait Grab Comprehensive Customer Data Platform Guide Optimizing Promotional Initiatives Traeger Grills Cdp Execution Outcomes Sample PDF today and make your presentation stand out from the rest.

Half Yearly Data Analytics Implementation Roadmap Demonstration
We present our half yearly data analytics implementation roadmap demonstration. This PowerPoint layout is easy-to-edit so you can change the font size, font type, color, and shape conveniently. In addition to this, the PowerPoint layout is Google Slides compatible, so you can share it with your audience and give them access to edit it. Therefore, download and save this well-researched half yearly data analytics implementation roadmap demonstration in different formats like PDF, PNG, and JPG to smoothly execute your business plan.
List Business Key Performance Indicators Ppt PowerPoint Presentation Icon Designs Download
Presenting this set of slides with name list business key performance indicators ppt powerpoint presentation icon designs download. This is an editable Powerpoint four stages graphic that deals with topics like list business key performance indicators to help convey your message better graphically. This product is a premium product available for immediate download and is 100 percent editable in Powerpoint. Download this now and use it in your presentations to impress your audience.
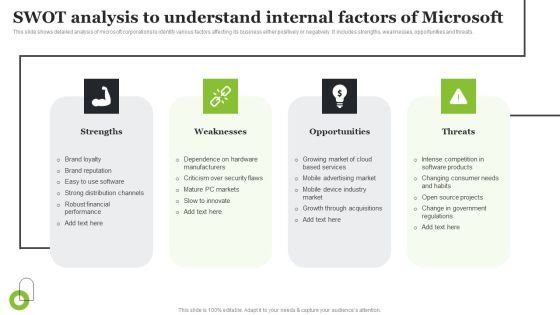
Microsoft Strategic Plan To Become Market Leader Swot Analysis To Understand Internal Factors Of Microsoft Download PDF
This slide shows detailed analysis of microsoft corporations to identify various factors affecting its business either positively or negatively. It includes strengths, weaknesses, opportunities and threats. The Microsoft Strategic Plan To Become Market Leader Swot Analysis To Understand Internal Factors Of Microsoft Download PDF is a compilation of the most recent design trends as a series of slides. It is suitable for any subject or industry presentation, containing attractive visuals and photo spots for businesses to clearly express their messages. This template contains a variety of slides for the user to input data, such as structures to contrast two elements, bullet points, and slides for written information. Slidegeeks is prepared to create an impression.
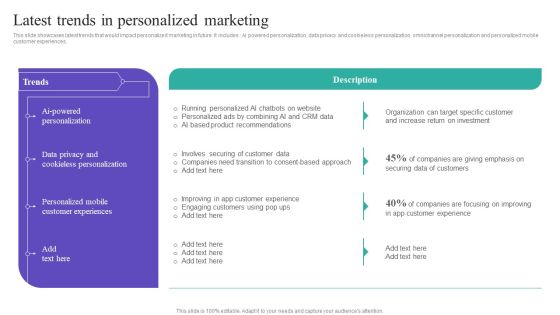
Latest Trends In Personalized Marketing Ideas PDF
This slide showcases latest trends that would impact personalized marketing in future. It includes Ai powered personalization, data privacy and cookieless personalization, omnichannel personalization and personalized mobile customer experiences. Slidegeeks is here to make your presentations a breeze with Latest Trends In Personalized Marketing Ideas PDF With our easy-to-use and customizable templates, you can focus on delivering your ideas rather than worrying about formatting. With a variety of designs to choose from, you are sure to find one that suits your needs. And with animations and unique photos, illustrations, and fonts, you can make your presentation pop. So whether you are giving a sales pitch or presenting to the board, make sure to check out Slidegeeks first

KPI To Track Physical Fitness Program Sponsorship Success Infographics PDF
Mentioned slide provides insights about various key performance metrics which can be evaluated by business to determine . It includes KPIs such as tickets sold, television viewers, social media mentions, website traffic, generated leads, email open rate and click through rate. Pitch your topic with ease and precision using this KPI To Track Physical Fitness Program Sponsorship Success Infographics PDF. This layout presents information on Social Media Mentions, Sponsorship Advertisements, Determine Potential Customer. It is also available for immediate download and adjustment. So, changes can be made in the color, design, graphics or any other component to create a unique layout.
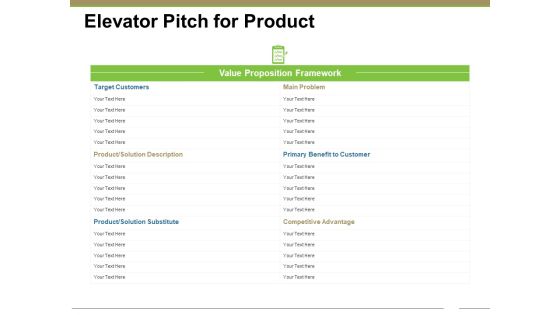
Elevator Pitch For Product Ppt PowerPoint Presentation Infographic Template Infographic Template
This is a elevator pitch for product ppt powerpoint presentation infographic template infographic template. This is a three stage process. The stages in this process are target customers, main problem, primary benefit to customer, competitive advantage, product solution description.

Business Intelligence And Big Transformation Toolkit Data Analytics Value Stream Chain Guidelines PDF
This slide illustrates the series of activities required for analyzing the data. It contains information such as data preparation, exploratory analysis, and predictive analytics etc. This is a business intelligence and big transformation toolkit data analytics value stream chain guidelines pdf template with various stages. Focus and dispense information on six stages using this creative set, that comes with editable features. It contains large content boxes to add your information on topics like data preparation, exploratory data analysis, data visualization, classification and clustering, predictive analytics. You can also showcase facts, figures, and other relevant content using this PPT layout. Grab it now.

System Deployment Project Key Performance Indicators Highlighting Current Problems Information PDF
This slide represents the key performance indicators to track the problems faced by organization and draw effective strategies to tackle the problems. It includes key performance indicators of decline in organizational sales and customer engagement rate. Coming up with a presentation necessitates that the majority of the effort goes into the content and the message you intend to convey. The visuals of a PowerPoint presentation can only be effective if it supplements and supports the story that is being told. Keeping this in mind our experts created System Deployment Project Key Performance Indicators Highlighting Current Problems Information PDF to reduce the time that goes into designing the presentation. This way, you can concentrate on the message while our designers take care of providing you with the right template for the situation.
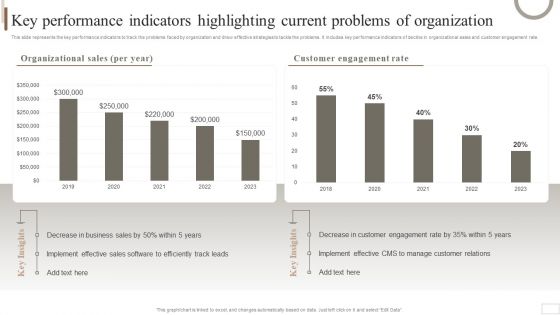
Strategic Plan For Enterprise Key Performance Indicators Highlighting Current Problems Diagrams PDF
This slide represents the key performance indicators to track the problems faced by organization and draw effective strategies to tackle the problems. It includes key performance indicators of decline in organizational sales and customer engagement rate. Coming up with a presentation necessitates that the majority of the effort goes into the content and the message you intend to convey. The visuals of a PowerPoint presentation can only be effective if it supplements and supports the story that is being told. Keeping this in mind our experts created Strategic Plan For Enterprise Key Performance Indicators Highlighting Current Problems Diagrams PDF to reduce the time that goes into designing the presentation. This way, you can concentrate on the message while our designers take care of providing you with the right template for the situation.
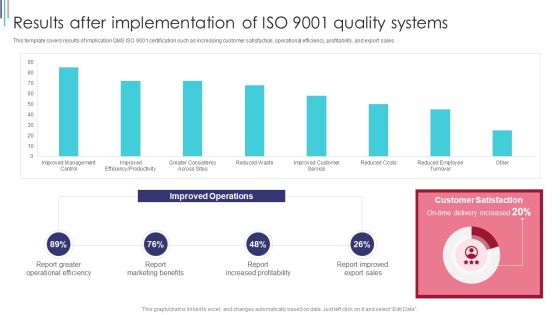
ISO 9001 Standard For Quality Control Results After Implementation Of ISO 9001 Quality Systems Demonstration PDF
This template covers results of implication QMS ISO 9001 certification such as increasing customer satisfaction, operational efficiency, profitability, and export sales. Deliver an awe inspiring pitch with this creative ISO 9001 Standard For Quality Control Results After Implementation Of ISO 9001 Quality Systems Demonstration PDF bundle. Topics like Report Marketing Benefits, Report Increased Profitability, Report Improved Export Sales can be discussed with this completely editable template. It is available for immediate download depending on the needs and requirements of the user.

3 Months Data Analytics Roadmap Structure
Introducing our 3 months data analytics roadmap structure. This PPT presentation is Google Slides compatible, therefore, you can share it easily with the collaborators for measuring the progress. Also, the presentation is available in both standard screen and widescreen aspect ratios. So edit the template design by modifying the font size, font type, color, and shapes as per your requirements. As this PPT design is fully editable it can be presented in PDF, JPG and PNG formats.

5 Year Data Analytics Roadmap Infographics
Introducing our 5 year data analytics roadmap infographics. This PPT presentation is Google Slides compatible, therefore, you can share it easily with the collaborators for measuring the progress. Also, the presentation is available in both standard screen and widescreen aspect ratios. So edit the template design by modifying the font size, font type, color, and shapes as per your requirements. As this PPT design is fully editable it can be presented in PDF, JPG and PNG formats.

9 Correlated Blocks Of Structured Data Ppt Film Business Plan PowerPoint Slides
We present our 9 correlated blocks of structured data ppt film business plan PowerPoint Slides.Present our Marketing PowerPoint Templates because you can Break through with our PowerPoint Templates and Slides. Bring down the mental barriers of your audience. Present our Communication PowerPoint Templates because Timeline crunches are a fact of life. Meet all deadlines using our PowerPoint Templates and Slides. Download and present our Arrows PowerPoint Templates because They will Put the wind in your sails. Skim smoothly over the choppy waters of the market. Present our Org Charts PowerPoint Templates because you can Add colour to your speech with our PowerPoint Templates and Slides. Your presentation will leave your audience speechless. Present our Business PowerPoint Templates because Your audience will believe you are the cats whiskers.Use these PowerPoint slides for presentations relating to Process, diagram, chart, flow, important, flowchart, data, connection, connect, connectivity, organization, business, teamwork, graphical, graph, steps, design, global, rectangle, corporate, plan, concept, arrow, hierarchy, glossy, chain, supervisor, relation, box, glassy, ladder, administration, group, highlight, organize, manager, office, financial, structure, officer. The prominent colors used in the PowerPoint template are Yellow, Green, Blue.

Data Mining Implementation Timeline For Data Mining Implementation In The Organization Icons PDF
This slide represents the timeline for the data science projects and a list of tasks performed each month, from training to work on projects.This is a data mining implementation timeline for data mining implementation in the organization icons pdf template with various stages. Focus and dispense information on six stages using this creative set, that comes with editable features. It contains large content boxes to add your information on topics like conditioning and transformation, exploratory analysis, final analysis You can also showcase facts, figures, and other relevant content using this PPT layout. Grab it now.
Key Questions For Customer Data Analysis Icons PDF
This slide list the win loss questions that must be asked for improving organizations messaging, positioning, packaging, pricing, and sales practices. Persuade your audience using this key questions for customer data analysis icons pdf. This PPT design covers five stages, thus making it a great tool to use. It also caters to a variety of topics including sales, practices, messaging, positioning. Download this PPT design now to present a convincing pitch that not only emphasizes the topic but also showcases your presentation skills.

Datafy Measures To Maintain Data Security In Datafication Diagrams PDF
This slide talks about the measures to keep data secure in datafication, including legal requirements, technical measures and business practices, containing marketing campaigns, sales operations and customer service. The technical measures include encryption, firewalls, and access controls. Welcome to our selection of the Datafy Measures To Maintain Data Security In Datafication Diagrams PDF. These are designed to help you showcase your creativity and bring your sphere to life. Planning and Innovation are essential for any business that is just starting out. This collection contains the designs that you need for your everyday presentations. All of our PowerPoints are 100 percent editable, so you can customize them to suit your needs. This multi-purpose template can be used in various situations. Grab these presentation templates today.
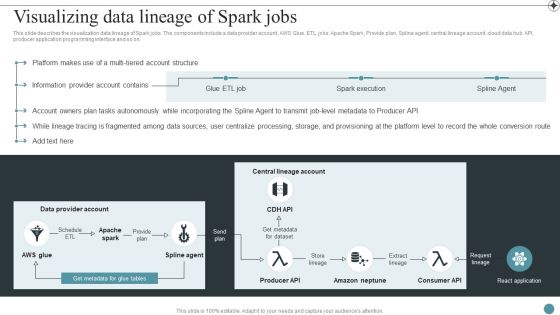
Visualizing Data Lineage Of Spark Jobs Deploying Data Lineage IT Professional PDF
This slide describes the visualization data lineage of Spark jobs. The components include a data provider account, AWS Glue, ETL jobs, Apache Spark, Provide plan, Spline agent, central lineage account, cloud data hub API, producer application programming interface and so on.Make sure to capture your audiences attention in your business displays with our gratis customizable Visualizing Data Lineage Of Spark Jobs Deploying Data Lineage IT Professional PDF. These are great for business strategies, office conferences, capital raising or task suggestions. If you desire to acquire more customers for your tech business and ensure they stay satisfied, create your own sales presentation with these plain slides.

Accounts Receivable Key Performance Indicators Ppt PowerPoint Presentation Visual Aids Model Cpb
Presenting this set of slides with name accounts receivable key performance indicators ppt powerpoint presentation visual aids model cpb. This is a three stage process. The stages in this process are accounts receivable key performance indicators. This is a completely editable PowerPoint presentation and is available for immediate download. Download now and impress your audience.

Quantitative Market Research Survey Results Structure PDF
This slide showcases market survey conducted and data gathered by various people to know the topics that drive better customer engagement. It also covers the location of the users. Pitch your topic with ease and precision using this Quantitative Market Research Survey Results Structure PDF. This layout presents information on Marketing Manager, Customer Support, Data Analyst. It is also available for immediate download and adjustment. So, changes can be made in the color, design, graphics or any other component to create a unique layout.
Five Key Performance Indicators Of Sales Team With Icons Ppt PowerPoint Presentation Gallery Introduction PDF
Persuade your audience using this five key performance indicators of sales team with icons ppt powerpoint presentation gallery introduction pdf. This PPT design covers five stages, thus making it a great tool to use. It also caters to a variety of topics including sales, win, revenue. Download this PPT design now to present a convincing pitch that not only emphasizes the topic but also showcases your presentation skills.
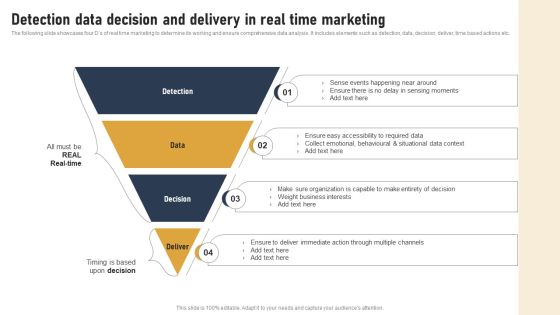
Incorporating Real Time Marketing For Improved Consumer Detection Data Decision And Delivery Pictures PDF
The following slide showcases four Ds of real time marketing to determine its working and ensure comprehensive data analysis. It includes elements such as detection, data, decision, deliver, time based actions etc. Create an editable Incorporating Real Time Marketing For Improved Consumer Detection Data Decision And Delivery Pictures PDF that communicates your idea and engages your audience. Whether youre presenting a business or an educational presentation, pre designed presentation templates help save time. Incorporating Real Time Marketing For Improved Consumer Detection Data Decision And Delivery Pictures PDF is highly customizable and very easy to edit, covering many different styles from creative to business presentations. Slidegeeks has creative team members who have crafted amazing templates. So, go and get them without any delay.

Increasing Consumer Engagement With Database Key Metrics To Measure Success Sample PDF
The purpose of this slide is to delineate key performance indicators KPIs through which marketers can evaluate success of email marketing campaign results and make data-driven decisions. The metrics are open rate, click-through rate CTR, conversion rate, spam complaint rate, forward rate, delivery rate, etc. Do you have to make sure that everyone on your team knows about any specific topic I yes, then you should give Increasing Consumer Engagement With Database Key Metrics To Measure Success Sample PDF a try. Our experts have put a lot of knowledge and effort into creating this impeccable Increasing Consumer Engagement With Database Key Metrics To Measure Success Sample PDF. You can use this template for your upcoming presentations, as the slides are perfect to represent even the tiniest detail. You can download these templates from the Slidegeeks website and these are easy to edit. So grab these today.

Integrating Data Privacy System Data Privacy Vs Data Security Ppt Icon Guidelines PDF
This slide compares data privacy with data security, indicating that security is concerned with safeguarding data, and privacy is about responsible data usage. Make sure to capture your audiences attention in your business displays with our gratis customizable Integrating Data Privacy System Data Privacy Vs Data Security Ppt Icon Guidelines PDF. These are great for business strategies, office conferences, capital raising or task suggestions. If you desire to acquire more customers for your tech business and ensure they stay satisfied, create your own sales presentation with these plain slides.
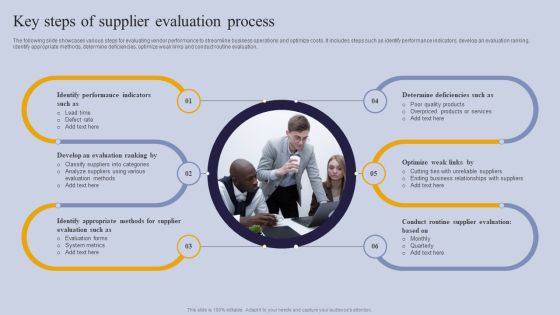
Vendor Performance Analysis And Administration Key Steps Of Supplier Evaluation Process Structure PDF
The following slide showcases various steps for evaluating vendor performance to streamline business operations and optimize costs. It includes steps such as identify performance indicators, develop an evaluation ranking, identify appropriate methods, determine deficiencies, optimize weak links and conduct routine evaluation. There are so many reasons you need a Vendor Performance Analysis And Administration Key Steps Of Supplier Evaluation Process Structure PDF. The first reason is you cannot spend time making everything from scratch, Thus, Slidegeeks has made presentation templates for you too. You can easily download these templates from our website easily.

Executing Sales Risk Administration Procedure Benefits Of Continuous Sales Risk Assessment Template PDF
The following slide highlights the advantages of sales risk analysis to integrate and implement process effectively. It includes key elements such as facilitates data driven decision making, helps in gaining profitable customers, awareness to market trends, helps to better serve the customers etc. Create an editable Executing Sales Risk Administration Procedure Benefits Of Continuous Sales Risk Assessment Template PDF that communicates your idea and engages your audience. Whether you are presenting a business or an educational presentation, pre designed presentation templates help save time. Executing Sales Risk Administration Procedure Benefits Of Continuous Sales Risk Assessment Template PDF is highly customizable and very easy to edit, covering many different styles from creative to business presentations. Slidegeeks has creative team members who have crafted amazing templates. So, go and get them without any delay.

5G Network Operations Radio Link Control RLC Layer Functions Graphics PDF
This slide covers the functions of the radio link control sublayer, including packet data convergence protocol transfer, sequence numbering, ARQ correction, SDU re-assembly, SDU RLC rejection, and re-establishment of RLC. Retrieve professionally designed 5G Network Operations Radio Link Control RLC Layer Functions Graphics PDF to effectively convey your message and captivate your listeners. Save time by selecting pre-made slideshows that are appropriate for various topics, from business to educational purposes. These themes come in many different styles, from creative to corporate, and all of them are easily adjustable and can be edited quickly. Access them as PowerPoint templates or as Google Slides themes. You dont have to go on a hunt for the perfect presentation because Slidegeeks got you covered from everywhere.
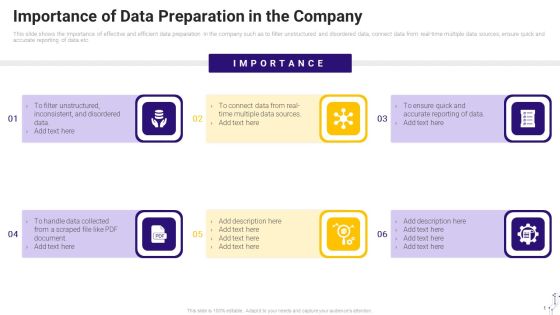
Effective Data Arrangement For Data Accessibility And Processing Readiness Importance Of Data Preparation In The Company Demonstration PDF
This slide shows the importance of effective and efficient data preparation in the company such as to filter unstructured and disordered data, connect data from real-time multiple data sources, ensure quick and accurate reporting of data etc. This is a effective data arrangement for data accessibility and processing readiness importance of data preparation in the company demonstration pdf template with various stages. Focus and dispense information on six stages using this creative set, that comes with editable features. It contains large content boxes to add your information on topics like importance of data preparation in the company. You can also showcase facts, figures, and other relevant content using this PPT layout. Grab it now.

Data Mining Implementation Roadmap To Integrate Data Mining In The Organization Sample PDF
This slide shows the roadmap to integrate data science in the business and what actions to be made at each stage after an interval of time.This is a data mining implementation roadmap to integrate data mining in the organization sample pdf template with various stages. Focus and dispense information on four stages using this creative set, that comes with editable features. It contains large content boxes to add your information on topics like data acquisition and transformation, hire professional data scientists, final data analysis You can also showcase facts, figures, and other relevant content using this PPT layout. Grab it now.
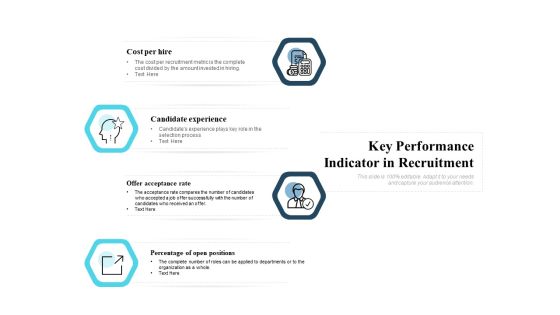
Key Performance Indicator In Recruitment Ppt PowerPoint Presentation Show Graphic Tips
Presenting this set of slides with name key performance indicator in recruitment ppt powerpoint presentation show graphic tips. This is a four stage process. The stages in this process are cost per hire, candidate experience, offer acceptance rate, percentage of open positions. This is a completely editable PowerPoint presentation and is available for immediate download. Download now and impress your audience.

Debt Retrieval Techniques Our Key Performance Indicators For Balance Sheet Ppt Pictures Gallery PDF
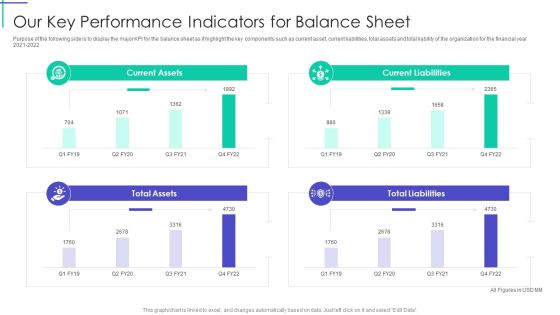
Purpose of the following side is to display the major KPI for the balance sheet as it highlight the key components such as current asset, current liabilities, total assets and total liability of the organization for the financial year 2020 2021 Deliver and pitch your topic in the best possible manner with this debt retrieval techniques our key performance indicators for balance sheet ppt pictures gallery pdf. Use them to share invaluable insights on current assets, current liabilities, total assets, total liabilities and impress your audience. This template can be altered and modified as per your expectations. So, grab it now.

Debt Collection Improvement Plan Our Key Performance Indicators For Balance Sheet Professional PDF
Purpose of the following side is to display the major KPI for the balance sheet as it highlight the key components such as current asset, current liabilities, total assets and total liability of the organization for the financial year 2021 to 2022. Deliver and pitch your topic in the best possible manner with this debt collection improvement plan our key performance indicators for balance sheet professional pdf. Use them to share invaluable insights on current assets, current liabilities, total assets, total liabilities and impress your audience. This template can be altered and modified as per your expectations. So, grab it now.
Mortgage Recovery Strategy For Finance Companies Our Key Performance Indicators For Balance Sheet Inspiration PDF
Purpose of the following side is to display the major KPI for the balance sheet as it highlight the key components such as current asset, current liabilities, total assets and total liability of the organization for the financial year 2021 to 2022. Deliver an awe inspiring pitch with this creative Mortgage Recovery Strategy For Finance Companies Our Key Performance Indicators For Balance Sheet Inspiration PDF bundle. Topics like Current Assets, Current Liabilities, Total Liabilities can be discussed with this completely editable template. It is available for immediate download depending on the needs and requirements of the user.
Key Performance Indicators Of Nss Electronic Manufacturing Company With Future Targets Icons PDF
Presenting key performance indicators of nss electronic manufacturing company with future targets icons pdf to provide visual cues and insights. Share and navigate important information on five stages that need your due attention. This template can be used to pitch topics like company revenue, labor shortage rate, on standard operating efficiency. In addtion, this PPT design contains high resolution images, graphics, etc, that are easily editable and available for immediate download.

 Home
Home