AI PPT Maker
Templates
PPT Bundles
Design Services
Business PPTs
Business Plan
Management
Strategy
Introduction PPT
Roadmap
Self Introduction
Timelines
Process
Marketing
Agenda
Technology
Medical
Startup Business Plan
Cyber Security
Dashboards
SWOT
Proposals
Education
Pitch Deck
Digital Marketing
KPIs
Project Management
Product Management
Artificial Intelligence
Target Market
Communication
Supply Chain
Google Slides
Research Services
 One Pagers
All Categories
-
Home
- Customer Favorites
- Monthly Dashboard
Monthly Dashboard
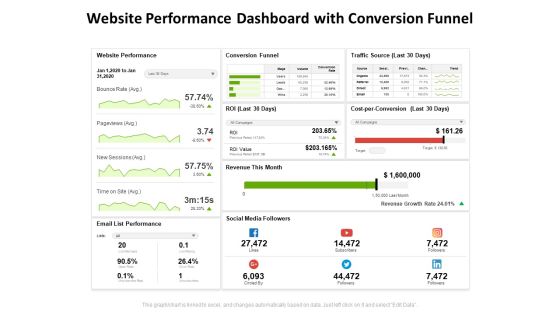
Website Performance Dashboard With Conversion Funnel Ppt PowerPoint Presentation Slides Pictures PDF
Presenting this set of slides with name website performance dashboard with conversion funnel ppt powerpoint presentation slides pictures pdf. The topics discussed in these slides are website performance, conversion funnel, traffic source, revenue this month, social media followers, email list performance. This is a completely editable PowerPoint presentation and is available for immediate download. Download now and impress your audience.
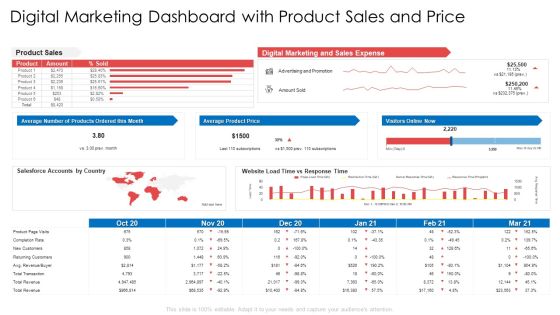
Digital Marketing Dashboard With Product Sales And Price Ppt Gallery Visual Aids PDF
Deliver an awe inspiring pitch with this creative digital marketing dashboard with product sales and price ppt gallery visual aids pdf bundle. Topics like average product price, average number of products ordered this month, digital marketing and sales expense, product sales can be discussed with this completely editable template. It is available for immediate download depending on the needs and requirements of the user.
Operational Risk Assessment And Management Plan Operational Risk Management Key Metrics Dashboard Icons PDF
This slide represents dashboard representing the key metrics of operational risk management. It includes KPIs such as operational risk by rating, by month, operational risk list etc. The Operational Risk Assessment And Management Plan Operational Risk Management Key Metrics Dashboard Icons PDF is a compilation of the most recent design trends as a series of slides. It is suitable for any subject or industry presentation, containing attractive visuals and photo spots for businesses to clearly express their messages. This template contains a variety of slides for the user to input data, such as structures to contrast two elements, bullet points, and slides for written information. Slidegeeks is prepared to create an impression.
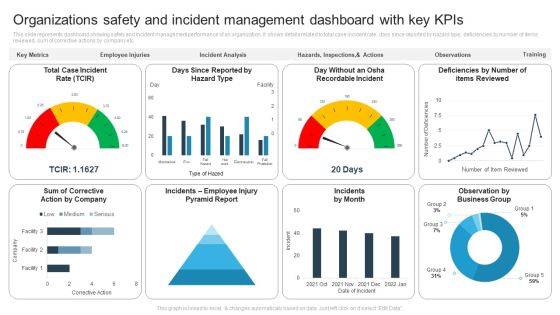
Organizations Safety And Incident Management Dashboard With Key Kpis Themes PDF
This slide represents dashboard showing safety and incident management performance of an organization. It shows details related to total case incident rate, days since reported by hazard type, deficiencies by number of items reviewed, sum of corrective actions by company etc. Showcasing this set of slides titled Organizations Safety And Incident Management Dashboard With Key Kpis Themes PDF. The topics addressed in these templates are Incidents By Month, Observation By Business Group. All the content presented in this PPT design is completely editable. Download it and make adjustments in color, background, font etc. as per your unique business setting.
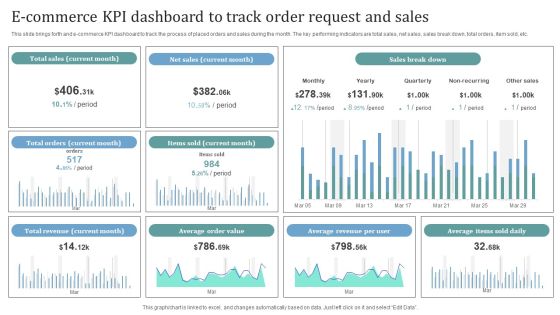
E Commerce KPI Dashboard To Track Order Request And Sales Introduction PDF
This slide brings forth and e commerce KPI dashboard to track the process of placed orders and sales during the month. The key performing indicators are total sales, net sales, sales break down, total orders, item sold, etc. Showcasing this set of slides titled E Commerce KPI Dashboard To Track Order Request And Sales Introduction PDF. The topics addressed in these templates are Total Sales, Net Sales, Sales Break Down. All the content presented in this PPT design is completely editable. Download it and make adjustments in color, background, font etc. as per your unique business setting.

Integrating Digital Marketing Campaign Strategy Dashboard With Lead Breakdown Slides PDF
This slide depicts an integrating digital marketing campaign dashboard used to track lead generation and user traffic generated. It includes lead breakdown per day, google analytics traffic channels and key conversion metrics. Showcasing this set of slides titled Integrating Digital Marketing Campaign Strategy Dashboard With Lead Breakdown Slides PDF. The topics addressed in these templates are Lead Current Month, Website Users, Top Social Media Channels. All the content presented in this PPT design is completely editable. Download it and make adjustments in color, background, font etc. as per your unique business setting.

Dashboard To Track Extensive Diversity Training Status For Employees Developement Elements PDF
This slide showcases the dashboard to track current diversity training status in the organization. Key metrics included here are training cost actual and budgeted, cost per partcipant, number of participants every month, hours of training provided etc. Showcasing this set of slides titled Dashboard To Track Extensive Diversity Training Status For Employees Developement Elements PDF. The topics addressed in these templates are Training Cost, Budget, Occupancy Rate. All the content presented in this PPT design is completely editable. Download it and make adjustments in color, background, font etc. as per your unique business setting.
Operations Of Commercial Bank Dashboard Tracking Customer Retention Rate Time Summary PDF
This slide contains dashboard that will allow bank to track the retention rate of customer within span of 6 months. Number of accounts that are successfully retained by the bank. It will also bank in tracking accounts that are cancelled. Deliver an awe-inspiring pitch with this creative operations of commercial bank dashboard tracking customer retention rate time summary pdf bundle. Topics like contraction, expansion, partner can be discussed with this completely editable template. It is available for immediate download depending on the needs and requirements of the user.
Operations Of Commercial Bank Dashboard Tracking Customer Retention Rate Icons PDF
This slide contains dashboard that will allow bank to track the retention rate of customer within span of 6 months. Number of accounts that are successfully retained by the bank. It will also bank in tracking accounts that are cancelled. Deliver and pitch your topic in the best possible manner with this operations of commercial bank dashboard tracking customer retention rate icons pdf. Use them to share invaluable insights on road runners, contraction, expansion and impress your audience. This template can be altered and modified as per your expectations. So, grab it now.
Executing Online Solution In Banking Dashboard Tracking Customer Retention Rate Seats Sample PDF
This slide contains dashboard that will allow bank to track the retention rate of customer within span of 6 months. Number of accounts that are successfully retained by the bank. It will also bank in tracking accounts that are cancelled. Deliver an awe inspiring pitch with this creative executing online solution in banking dashboard tracking customer retention rate seats sample pdf bundle. Topics like road runners, sleeping beautiful, aladdin rugs can be discussed with this completely editable template. It is available for immediate download depending on the needs and requirements of the user.
Executing Online Solution In Banking Dashboard Tracking Customer Retention Rate Time Topics PDF
This slide contains dashboard that will allow bank to track the retention rate of customer within span of 6 months. Number of accounts that are successfully retained by the bank. It will also bank in tracking accounts that are cancelled. Deliver and pitch your topic in the best possible manner with this executing online solution in banking dashboard tracking customer retention rate time topics pdf. Use them to share invaluable insights on account retention, retention components over time, expansion, contraction and impress your audience. This template can be altered and modified as per your expectations. So, grab it now.
Strawman Proposal For Enterprise Critical Thinking Potential Prospect Management Dashboard Icons PDF
The dashboard will provide overall scenario of all accounts and track new leads, top campaigns, expected revenue earned, etc. Deliver and pitch your topic in the best possible manner with this strawman proposal for enterprise critical thinking potential prospect management dashboard icons pdf. Use them to share invaluable insights on new leads this month, top campaigns, expected revenue by marketing channel, reasons for unqualified leads, lead status by owner and impress your audience. This template can be altered and modified as per your expectations. So, grab it now.
SFA Dashboard To Track Performance Ppt PowerPoint Presentation Icon Example File PDF
This Slide visually represents sales force automation dashboard to track performance which can be utilized by marketing managers to streamline the process of automated selling. It includes information about sales pipeline, competitors, opportunities, key competitors, etc. Pitch your topic with ease and precision using this sfa dashboard to track performance ppt powerpoint presentation icon example file pdf. This layout presents information on sales pipeline, sales pipeline by sales rep, key competitors, forecast by month, key opportunities. It is also available for immediate download and adjustment. So, changes can be made in the color, design, graphics or any other component to create a unique layout.

Designing And Deployment CRM Implementation Dashboard With Customer Satisfaction Clipart PDF
This slide showcases the dashboard for CRM which includes the revenue, marketing expenses, satisfaction rate, conversion funnel, tickets volume by priority, and expected sales this year. Deliver an awe inspiring pitch with this creative designing and deployment crm implementation dashboard with customer satisfaction clipart pdf bundle. Topics like pipeline vs expected sales this year, revenue vs expense by month, customer satisfaction, conversion funnel, tickets volume by priority can be discussed with this completely editable template. It is available for immediate download depending on the needs and requirements of the user.
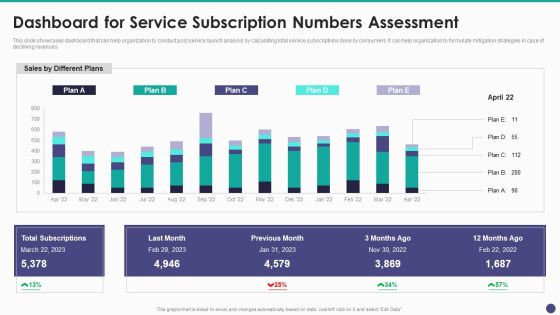
New Service Launch And Development Strategy To Gain Market Share Dashboard For Service Subscription Summary PDF
This slide showcases dashboard that can help organization to conduct post service launch analysis by calculating total service subscriptions done by consumers. It can help organization to formulate mitigation strategies in case of declining revenues.Deliver and pitch your topic in the best possible manner with this New Service Launch And Development Strategy To Gain Market Share Dashboard For Service Subscription Summary PDF Use them to share invaluable insights on Total Subscriptions, Previous Month, Different Plans and impress your audience. This template can be altered and modified as per your expectations. So, grab it now.

Strategic Human Resource Retention Management Dashboard For Employee Retention Polices Infographics PDF
Purpose of the following slide is to show the Employee Attrition dashboard as it highlights the Employee turnover rate, average seniority of employees in months, year-over-year turnover rate etc.Deliver and pitch your topic in the best possible manner with this Strategic Human Resource Retention Management Dashboard For Employee Retention Polices Infographics PDF. Use them to share invaluable insights on Turnover Rate, Rate By Division, Employee Turnover and impress your audience. This template can be altered and modified as per your expectations. So, grab it now.
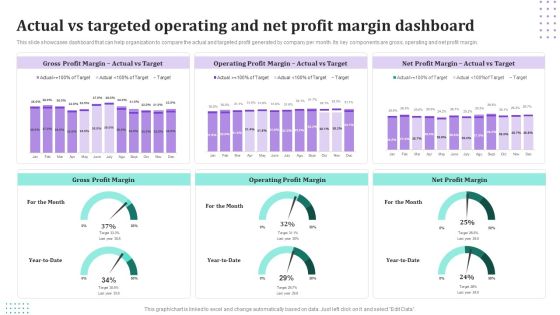
Actual Vs Targeted Operating And Net Profit Margin Dashboard Information PDF
This slide showcases dashboard that can help organization to compare the actual and targeted profit generated by company per month. Its key components are gross, operating and net profit margin. Showcasing this set of slides titled Actual Vs Targeted Operating And Net Profit Margin Dashboard Information PDF. The topics addressed in these templates are Gross Profit Margin, Operating Profit Margin, Net Profit Margin. All the content presented in this PPT design is completely editable. Download it and make adjustments in color, background, font etc. as per your unique business setting.

Social Networking Program Dashboard To Track Social Media Engagement Activity Rules PDF
This slide focuses on dashboard that depicts tracking status of social media engagement activities that covers subscribers, followers, likes, channel views, clicks and likes, shares, posts, etc. Deliver and pitch your topic in the best possible manner with this Social Networking Program Dashboard To Track Social Media Engagement Activity Rules PDF. Use them to share invaluable insights on Share last month, YouTube Channel Views, Facebook Daily Reach and impress your audience. This template can be altered and modified as per your expectations. So, grab it now.

R2R Dashboard With Income Statement Ppt PowerPoint Presentation Show Slide Download PDF
Following slide outlines a comprehensive R2R dashboard used for taking financial decisions. The various metrics covered in this slide are total income, expenses, net profit, cash at end of month, income and expenses, quick ratio, current ratio etc.Showcasing this set of slides titled R2R Dashboard With Income Statement Ppt PowerPoint Presentation Show Slide Download PDF. The topics addressed in these templates are Operating Expenses, Total Experience, Accounts Receivable. All the content presented in this PPT design is completely editable. Download it and make adjustments in color, background, font etc. as per your unique business setting.

Business Threats Landscape Dashboard For Cyber Security Program Management Ppt Gallery Images PDF
This slide shows risk landscape dashboard for cyber security program management which contains threat level by month, current threat posture, threats by source, threats by owner, risks by threat and threat register. This can help businesses in effective management of risks and counter measures. Showcasing this set of slides titled Business Threats Landscape Dashboard For Cyber Security Program Management Ppt Gallery Images PDF. The topics addressed in these templates are Current Threat Posture, Threat Register, Source. All the content presented in this PPT design is completely editable. Download it and make adjustments in color, background, font etc. as per your unique business setting.

Dashboard Of Product Sales Growth And Gross Analysis Analysis Ppt Styles Good PDF
The following slide highlights the dashboard o product sales growth and gross margin analysis illustrating key headings which includes sales by product, sales by month, sales product by margin, sales product by quantity, gross margin growth, gross margin trend and product inventory. Showcasing this set of slides titled Dashboard Of Product Sales Growth And Gross Analysis Analysis Ppt Styles Good PDF. The topics addressed in these templates are Gross Margin Growth, Gross Margin Trend, Product Inventory. All the content presented in this PPT design is completely editable. Download it and make adjustments in color, background, font etc. as per your unique business setting.
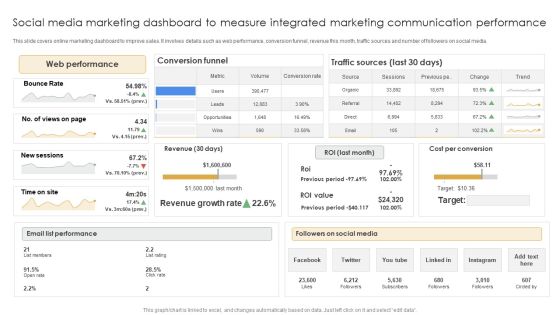
Social Media Marketing Dashboard To Measure Integrated Marketing Communication Performance Clipart PDF
This slide covers online marketing dashboard to improve sales. It involves details such as web performance, conversion funnel, revenue this month, traffic sources and number of followers on social media. Pitch your topic with ease and precision using this Social Media Marketing Dashboard To Measure Integrated Marketing Communication Performance Clipart PDF. This layout presents information on Web Performance, Email List Performance, Followers Social Media. It is also available for immediate download and adjustment. So, changes can be made in the color, design, graphics or any other component to create a unique layout.
Ultimate Guide To Improve Customer Support And Services Dashboard For Tracking Aftersales Customer Sample PDF
This slide covers the KPI dashboard for ticket tracking. It includes metrics such as tickets by month, service level, and details of customer service department agents. If your project calls for a presentation, then Slidegeeks is your go to partner because we have professionally designed, easy to edit templates that are perfect for any presentation. After downloading, you can easily edit Ultimate Guide To Improve Customer Support And Services Dashboard For Tracking Aftersales Customer Sample PDF and make the changes accordingly. You can rearrange slides or fill them with different images. Check out all the handy templates
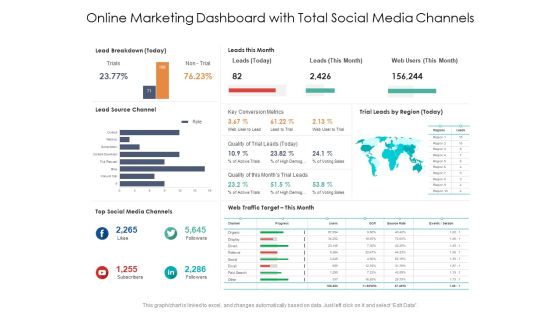
Online Marketing Dashboard With Total Social Media Channels Ppt PowerPoint Presentation Show Maker PDF
Presenting this set of slides with name online marketing dashboard with total social media channels ppt powerpoint presentation show maker pdf. The topics discussed in these slides are lead breakdown, leads this month, key conversion metrics, quality of trial leads, web traffic target, top social media channels, lead source channel. This is a completely editable PowerPoint presentation and is available for immediate download. Download now and impress your audience.
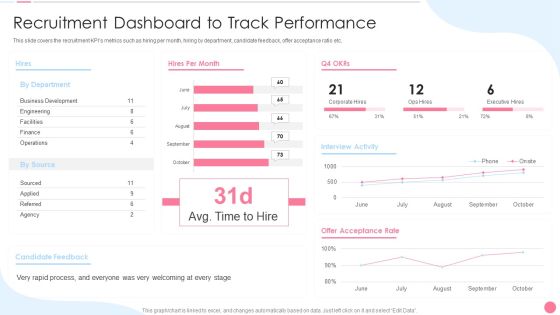
Social Media Hiring Approach Recruitment Dashboard To Track Performance Formats PDF
This slide covers the recruitment KPIs metrics such as hiring per month, hiring by department, candidate feedback, offer acceptance ratio etc. Deliver and pitch your topic in the best possible manner with this Social Media Hiring Approach Recruitment Dashboard To Track Performance Formats PDF. Use them to share invaluable insights on Business Development, Engineering, Acceptance Rate and impress your audience. This template can be altered and modified as per your expectations. So, grab it now.
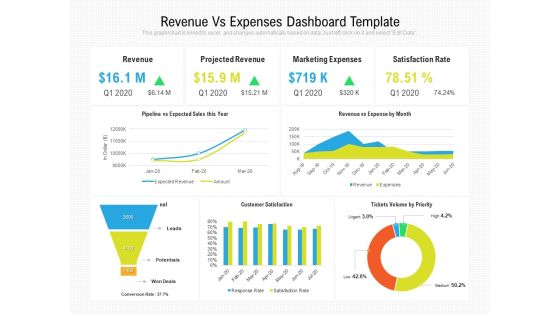
Revenue Vs Expenses Dashboard Template Ppt PowerPoint Presentation Slides Tips PDF
Presenting this set of slides with name revenue vs expenses dashboard template ppt powerpoint presentation slides tips pdf. The topics discussed in these slides are revenue, projected revenue, marketing expenses, satisfaction rate, pipeline vs expected sales this year, revenue vs expense by month, customer satisfaction, tickets volume by priority. This is a completely editable PowerPoint presentation and is available for immediate download. Download now and impress your audience.
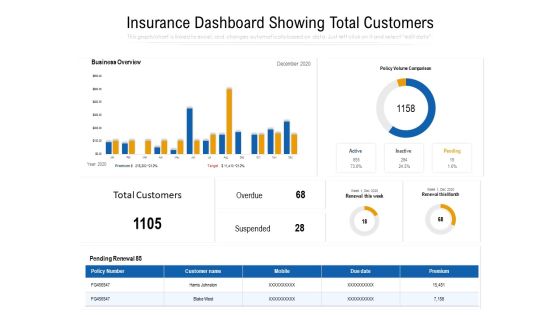
Insurance Dashboard Showing Total Customers Ppt PowerPoint Presentation Pictures Model PDF
Showcasing this set of slides titled insurance dashboard showing total customers ppt powerpoint presentation slides graphics tutorials pdf. The topics addressed in these templates are business overview, policy volume comparison, suspended, renewal this week, renewal this month, premium. All the content presented in this PPT design is completely editable. Download it and make adjustments in color, background, font etc. as per your unique business setting.
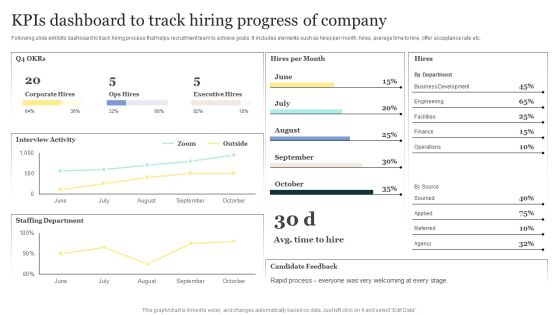
Strategic Approaches To Efficient Candidate Selection Kpis Dashboard To Track Hiring Progress Of Company Pictures PDF
Following slide exhibits dashboard to track hiring process that helps recruitment team to achieve goals. It includes elements such as hires per month, hires, average time to hire, offer acceptance rate etc. Explore a selection of the finest Strategic Approaches To Efficient Candidate Selection Kpis Dashboard To Track Hiring Progress Of Company Pictures PDF here. With a plethora of professionally designed and pre-made slide templates, you can quickly and easily find the right one for your upcoming presentation. You can use our Strategic Approaches To Efficient Candidate Selection Kpis Dashboard To Track Hiring Progress Of Company Pictures PDF to effectively convey your message to a wider audience. Slidegeeks has done a lot of research before preparing these presentation templates. The content can be personalized and the slides are highly editable. Grab templates today from Slidegeeks.
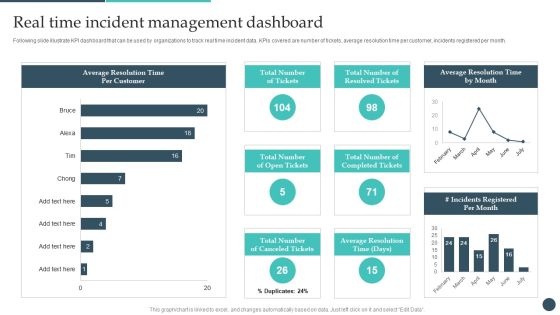
Safety Breach Response Playbook Real Time Incident Management Dashboard Formats PDF
Following slide illustrate KPI dashboard that can be used by organizations to track real time incident data. KPIs covered are number of tickets, average resolution time per customer, incidents registered per month. Find highly impressive Safety Breach Response Playbook Real Time Incident Management Dashboard Formats PDF on Slidegeeks to deliver a meaningful presentation. You can save an ample amount of time using these presentation templates. No need to worry to prepare everything from scratch because Slidegeeks experts have already done a huge research and work for you. You need to download Safety Breach Response Playbook Real Time Incident Management Dashboard Formats PDF for your upcoming presentation. All the presentation templates are 100 percent editable and you can change the color and personalize the content accordingly. Download now.

Advertising Campaign Optimization Process Social Media Advertisement Campaign Dashboard Graphics PDF
This slide showcases a dashboard depicting key metrics tracked for social media advertising campaigns. The metrics covered are spent this month, conversion, cost per conversion, sessions, etc. Do you have to make sure that everyone on your team knows about any specific topic I yes, then you should give Advertising Campaign Optimization Process Social Media Advertisement Campaign Dashboard Graphics PDF a try. Our experts have put a lot of knowledge and effort into creating this impeccable Advertising Campaign Optimization Process Social Media Advertisement Campaign Dashboard Graphics PDF. You can use this template for your upcoming presentations, as the slides are perfect to represent even the tiniest detail. You can download these templates from the Slidegeeks website and these are easy to edit. So grab these today.

Client Acquisition Through Marketing Campaign Social Media Advertisement Campaign Dashboard Clipart PDF
This slide showcases a dashboard depicting key metrics tracked for social media advertising campaigns. The metrics covered are spent this month, conversion, cost per conversion, sessions, etc. Get a simple yet stunning designed Client Acquisition Through Marketing Campaign Social Media Advertisement Campaign Dashboard Clipart PDF. It is the best one to establish the tone in your meetings. It is an excellent way to make your presentations highly effective. So, download this PPT today from Slidegeeks and see the positive impacts. Our easy to edit Client Acquisition Through Marketing Campaign Social Media Advertisement Campaign Dashboard Clipart PDF can be your go to option for all upcoming conferences and meetings. So, what are you waiting for Grab this template today.

Dashboard Indicating Status Of Change Requests For Effective Leadership Decisions Themes PDF
This slide showcase leadership dashboard indicating status of change requests for effective leadership decisions which can benefit organizations in earning additional revenues and stimulate employee performance. It contains change request due in a week, change request due in month, open changes, waiting for approval, open changes by risk, change requests by status and change requests by due date.Showcasing this set of slides titled Dashboard Indicating Status Of Change Requests For Effective Leadership Decisions Themes PDF The topics addressed in these templates are Dashboard Indicating, Requests Effective, Leadership Decisions All the content presented in this PPT design is completely editable. Download it and make adjustments in color, background, font etc. as per your unique business setting.
Increasing Customer Dashboard For Tracking Aftersales Customer Services Team Ideas PDF
This slide covers the KPI dashboard for ticket tracking. It includes metrics such as tickets by month, service level, and details of customer service department agents. Are you searching for a Increasing Customer Dashboard For Tracking Aftersales Customer Services Team Ideas PDF that is uncluttered, straightforward, and original Its easy to edit, and you can change the colors to suit your personal or business branding. For a presentation that expresses how much effort youve put in, this template is ideal With all of its features, including tables, diagrams, statistics, and lists, its perfect for a business plan presentation. Make your ideas more appealing with these professional slides. Download Increasing Customer Dashboard For Tracking Aftersales Customer Services Team Ideas PDF from Slidegeeks today.

Deploying Revitalization Strategy Enhance Product And Service Sales Product Reposition Dashboard Highlighting Brochure PDF
This slide highlights the product reposition dashboard which showcases market share in regions, emerging markets, after repositioning planned vs actual sales and product revenue by month. Do you have an important presentation coming up Are you looking for something that will make your presentation stand out from the rest Look no further than Deploying Revitalization Strategy Enhance Product And Service Sales Product Reposition Dashboard Highlighting Brochure PDF. With our professional designs, you can trust that your presentation will pop and make delivering it a smooth process. And with Slidegeeks, you can trust that your presentation will be unique and memorable. So why wait Grab Deploying Revitalization Strategy Enhance Product And Service Sales Product Reposition Dashboard Highlighting Brochure PDF today and make your presentation stand out from the rest.

Increasing Consumer Engagement With Database KPI Dashboard To Analyze Targeted Email Infographics PDF
The purpose of this slide is to highlight key performance indicator KPI dashboard which can be used by marketers to evaluate targeted email marketing campaign performance. The metrics are requests, opens, clicks, opens by country, opens vs clicks by month, etc. This modern and well arranged Increasing Consumer Engagement With Database KPI Dashboard To Analyze Targeted Email Infographics PDF provides lots of creative possibilities. It is very simple to customize and edit with the Powerpoint Software. Just drag and drop your pictures into the shapes. All facets of this template can be edited with Powerpoint no extra software is necessary. Add your own material, put your images in the places assigned for them, adjust the colors, and then you can show your slides to the world, with an animated slide included.

Strategic Risk Management And Mitigation Plan Operational Risk Management Key Metrics Dashboard Sample PDF
This slide represents dashboard representing the key metrics of operational risk management. It includes KPIs such as operational risk by rating, by month, operational risk list etc. Present like a pro with Strategic Risk Management And Mitigation Plan Operational Risk Management Key Metrics Dashboard Sample PDF Create beautiful presentations together with your team, using our easy to use presentation slides. Share your ideas in real time and make changes on the fly by downloading our templates. So whether you are in the office, on the go, or in a remote location, you can stay in sync with your team and present your ideas with confidence. With Slidegeeks presentation got a whole lot easier. Grab these presentations today.

Cyber Risks And Incident Response Playbook Real Time Incident Management Dashboard Guidelines PDF
Following slide illustrate KPI dashboard that can be used by organizations to track real time incident data. KPIs covered are number of tickets, average resolution time per customer, incidents registered per month. This Cyber Risks And Incident Response Playbook Real Time Incident Management Dashboard Guidelines PDF from Slidegeeks makes it easy to present information on your topic with precision. It provides customization options, so you can make changes to the colors, design, graphics, or any other component to create a unique layout. It is also available for immediate download, so you can begin using it right away. Slidegeeks has done good research to ensure that you have everything you need to make your presentation stand out. Make a name out there for a brilliant performance.
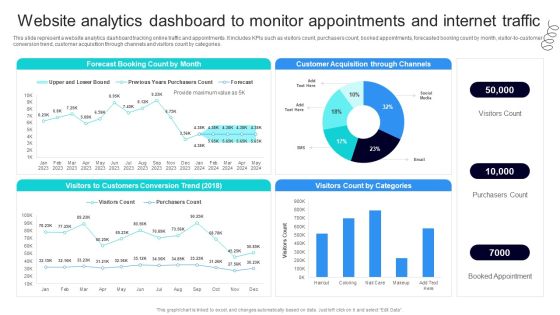
Strategic Marketing For Hair And Beauty Salon To Increase Website Analytics Dashboard Ideas PDF
This slide represent a website analytics dashboard tracking online traffic and appointments. It includes KPIs such as visitors count, purchasers count, booked appointments, forecasted booking count by month, visitor-to-customer conversion trend, customer acquisition through channels and visitors count by categories. Slidegeeks has constructed Strategic Marketing For Hair And Beauty Salon To Increase Website Analytics Dashboard Ideas PDF after conducting extensive research and examination. These presentation templates are constantly being generated and modified based on user preferences and critiques from editors. Here, you will find the most attractive templates for a range of purposes while taking into account ratings and remarks from users regarding the content. This is an excellent jumping off point to explore our content and will give new users an insight into our top notch PowerPoint Templates.

Business Sales Optimization Advertisement Campaign Social Media Advertisement Campaign Dashboard Graphics PDF
This slide showcases a dashboard depicting key metrics tracked for social media advertising campaigns. The metrics covered are spent this month, conversion, cost per conversion, sessions, etc. This modern and well arranged Business Sales Optimization Advertisement Campaign Social Media Advertisement Campaign Dashboard Graphics PDF provides lots of creative possibilities. It is very simple to customize and edit with the Powerpoint Software. Just drag and drop your pictures into the shapes. All facets of this template can be edited with Powerpoint no extra software is necessary. Add your own material, put your images in the places assigned for them, adjust the colors, and then you can show your slides to the world, with an animated slide included.

Advertising Programs Management Techniques Social Media Advertisement Campaign Dashboard Diagrams PDF
This slide showcases a dashboard depicting key metrics tracked for social media advertising campaigns. The metrics covered are spent this month, conversion, cost per conversion, sessions, etc. This modern and well arranged Advertising Programs Management Techniques Social Media Advertisement Campaign Dashboard Diagrams PDF provides lots of creative possibilities. It is very simple to customize and edit with the Powerpoint Software. Just drag and drop your pictures into the shapes. All facets of this template can be edited with Powerpoint no extra software is necessary. Add your own material, put your images in the places assigned for them, adjust the colors, and then you can show your slides to the world, with an animated slide included.

Dashboard To Track Leads Generated Through Outbound Marketing Campaign Slides PDF
This slide showcases dashboard that can help organization to track number of leads generated by running outbound marketing campaigns. Its key elements are lead breakdown, leads this month, total lead by program, key conversion metrics and total leads by region. Want to ace your presentation in front of a live audience Our Dashboard To Track Leads Generated Through Outbound Marketing Campaign Slides PDF can help you do that by engaging all the users towards you. Slidegeeks experts have put their efforts and expertise into creating these impeccable powerpoint presentations so that you can communicate your ideas clearly. Moreover, all the templates are customizable, and easy to edit and downloadable. Use these for both personal and commercial use.

Aligning Human Resource Hiring Procedure Dashboard To Evaluate HR Recruitment Process Portrait PDF
This slide showcases the KPIs that would help a business organization to evaluate improvements in the new recruitment and selection process. It includes hires per month, hires by department, etc. Here you can discover an assortment of the finest PowerPoint and Google Slides templates. With these templates, you can create presentations for a variety of purposes while simultaneously providing your audience with an eye catching visual experience. Download Aligning Human Resource Hiring Procedure Dashboard To Evaluate HR Recruitment Process Portrait PDF to deliver an impeccable presentation. These templates will make your job of preparing presentations much quicker, yet still, maintain a high level of quality. Slidegeeks has experienced researchers who prepare these templates and write high quality content for you. Later on, you can personalize the content by editing the Aligning Human Resource Hiring Procedure Dashboard To Evaluate HR Recruitment Process Portrait PDF.
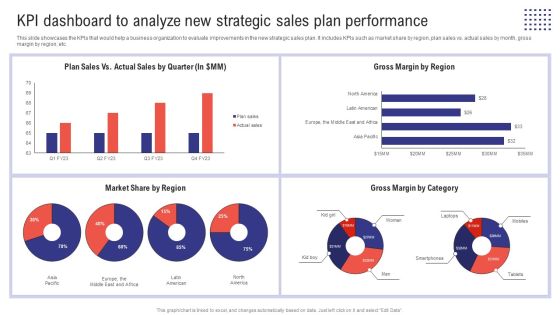
Planning Sales Campaign To Improve KPI Dashboard To Analyze New Strategic Sales Plan Information PDF
This slide showcases the KPIs that would help a business organization to evaluate improvements in the new strategic sales plan. It includes KPIs such as market share by region, plan sales vs. actual sales by month, gross margin by region, etc. Welcome to our selection of the Planning Sales Campaign To Improve KPI Dashboard To Analyze New Strategic Sales Plan Information PDF. These are designed to help you showcase your creativity and bring your sphere to life. Planning and Innovation are essential for any business that is just starting out. This collection contains the designs that you need for your everyday presentations. All of our PowerPoints are 100 percent editable, so you can customize them to suit your needs. This multi-purpose template can be used in various situations. Grab these presentation templates today.
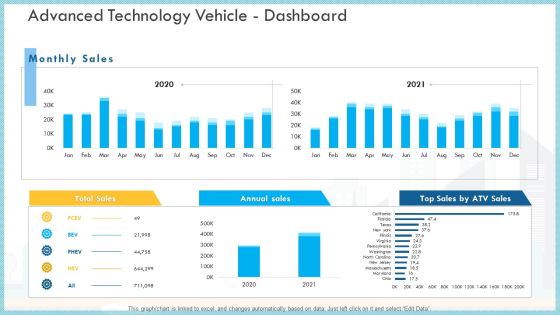
Loss Of Income And Financials Decline In An Automobile Organization Case Study Advanced Technology Vehicle Dashboard Infographics PDF
This graph or chart is linked to excel, and changes automatically based on data. Just left click on it and select Edit Data.Deliver an awe inspiring pitch with this creative loss of income and financials decline in an automobile organization case study advanced technology vehicle dashboard infographics pdf bundle. Topics like total sales, annual sales, monthly sales can be discussed with this completely editable template. It is available for immediate download depending on the needs and requirements of the user.
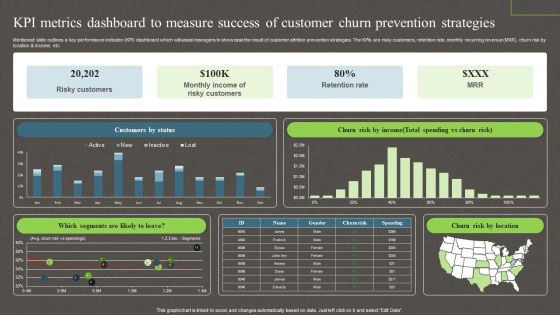
Kpi Metrics Dashboard To Measure Success Of Customer Churn Prevention Strategies Ppt PowerPoint Presentation File Model PDF
Mentioned slide outlines a key performance indicator KPI dashboard which will assist managers to showcase the result of customer attrition prevention strategies. The KPIs are risky customers, retention rate, monthly recurring revenue MRR, churn risk by location and income, etc. This Kpi Metrics Dashboard To Measure Success Of Customer Churn Prevention Strategies Ppt PowerPoint Presentation File Model PDF from Slidegeeks makes it easy to present information on your topic with precision. It provides customization options, so you can make changes to the colors, design, graphics, or any other component to create a unique layout. It is also available for immediate download, so you can begin using it right away. Slidegeeks has done good research to ensure that you have everything you need to make your presentation stand out. Make a name out there for a brilliant performance.
Three Months Data Analysis Procedure Roadmap Icons
We present our three months data analysis procedure roadmap icons. This PowerPoint layout is easy to edit so you can change the font size, font type, color, and shape conveniently. In addition to this, the PowerPoint layout is Google Slides compatible, so you can share it with your audience and give them access to edit it. Therefore, download and save this well researched three months data analysis procedure roadmap icons in different formats like PDF, PNG, and JPG to smoothly execute your business plan.

Six Months Data Analysis Procedure Roadmap Topics
Presenting our innovatively structured six months data analysis procedure roadmap topics Template. Showcase your roadmap process in different formats like PDF, PNG, and JPG by clicking the download button below. This PPT design is available in both Standard Screen and Widescreen aspect ratios. It can also be easily personalized and presented with modified font size, font type, color, and shapes to measure your progress in a clear way.

3 Months Data Analytics Implementation Roadmap Elements
Presenting our innovatively-structured 3 months data analytics implementation roadmap elements Template. Showcase your roadmap process in different formats like PDF, PNG, and JPG by clicking the download button below. This PPT design is available in both Standard Screen and Widescreen aspect ratios. It can also be easily personalized and presented with modified font size, font type, color, and shapes to measure your progress in a clear way.

3 Months Data Analytics Roadmap Structure
Introducing our 3 months data analytics roadmap structure. This PPT presentation is Google Slides compatible, therefore, you can share it easily with the collaborators for measuring the progress. Also, the presentation is available in both standard screen and widescreen aspect ratios. So edit the template design by modifying the font size, font type, color, and shapes as per your requirements. As this PPT design is fully editable it can be presented in PDF, JPG and PNG formats.

6 Months Data Analytics Roadmap Diagrams
Presenting our innovatively-structured 6 months data analytics roadmap diagrams Template. Showcase your roadmap process in different formats like PDF, PNG, and JPG by clicking the download button below. This PPT design is available in both Standard Screen and Widescreen aspect ratios. It can also be easily personalized and presented with modified font size, font type, color, and shapes to measure your progress in a clear way.
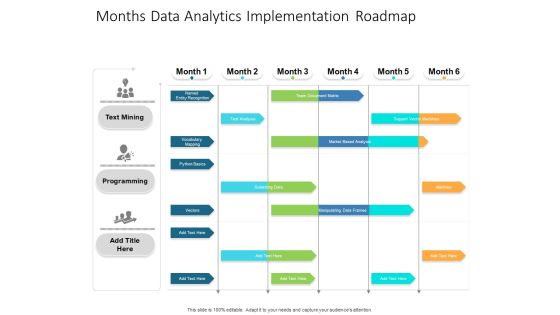
Months Data Analytics Implementation Roadmap Structure
Presenting our jaw-dropping months data analytics implementation roadmap structure. You can alternate the color, font size, font type, and shapes of this PPT layout according to your strategic process. This PPT presentation is compatible with Google Slides and is available in both standard screen and widescreen aspect ratios. You can also download this well-researched PowerPoint template design in different formats like PDF, JPG, and PNG. So utilize this visually-appealing design by clicking the download button given below.

Acquiring Clients Through Search Engine And Native Ads Dashboard To Track Website Traffic During Performance Icons PDF
This slide showcases dashboard that can help marketers to track the website traffic during execution of performance marketing activities. Its key elements are organic sessions, organic page views, inorganic sessions by month etc. Slidegeeks is here to make your presentations a breeze with Acquiring Clients Through Search Engine And Native Ads Dashboard To Track Website Traffic During Performance Icons PDF With our easy to use and customizable templates, you can focus on delivering your ideas rather than worrying about formatting. With a variety of designs to choose from, you are sure to find one that suits your needs. And with animations and unique photos, illustrations, and fonts, you can make your presentation pop. So whether you are giving a sales pitch or presenting to the board, make sure to check out Slidegeeks first.

Dashboards Related To The Patients Of Pharmaceutical Company Infographics PDF
This slide shows the dashboard or KPI related to pharmaceutical company which includes sales summary, number of units sold, status for latest month, etc.Deliver an awe inspiring pitch with this creative dashboards related to the patients of pharmaceutical company infographics pdf bundle. Topics like pharmaceutical sales summary, pharmaceutical data broker, quartipine injection can be discussed with this completely editable template. It is available for immediate download depending on the needs and requirements of the user.

3 Months Devops Implementation Roadmap Ppt Slides Background Images PDF
This template covers DevOps implementation roadmap initiating from understanding DevOps journey, managing change across the enterprise, resource DevOps, monitoring and improving etc. Deliver an awe inspiring pitch with this creative 3 months devops implementation roadmap ppt slides background images pdf bundle. Topics like management processes, team, dashboard, strategy can be discussed with this completely editable template. It is available for immediate download depending on the needs and requirements of the user.

6 Months Roadmap Report For Dissertation Thesis Submission Infographics PDF
This slide shows eight months roadmap of dissertation preparation. It includes risks such as proposal draft creation, meetings, literature reviews, etc. Pitch your topic with ease and precision using this 6 Months Roadmap Report For Dissertation Thesis Submission Infographics PDF. This layout presents information on Data Gathering, Data Analysis, Data Interpretation. It is also available for immediate download and adjustment. So, changes can be made in the color, design, graphics or any other component to create a unique layout.
Human Resource 4 Months Project Status Update Icon Topics PDF
Presenting Human Resource 4 Months Project Status Update Icon Topics PDF to dispense important information. This template comprises three stages. It also presents valuable insights into the topics including Human Resource, 4 Months Project, Status Update Icon. This is a completely customizable PowerPoint theme that can be put to use immediately. So, download it and address the topic impactfully.

3 Months Big Data Analysis Strategy Roadmap Sample
We present our 3 months big data analysis strategy roadmap sample. This PowerPoint layout is easy-to-edit so you can change the font size, font type, color, and shape conveniently. In addition to this, the PowerPoint layout is Google Slides compatible, so you can share it with your audience and give them access to edit it. Therefore, download and save this well-researched 3 months big data analysis strategy roadmap sample in different formats like PDF, PNG, and JPG to smoothly execute your business plan.

6 Months Big Data Analysis Strategy Roadmap Diagrams
We present our 6 months big data analysis strategy roadmap diagrams. This PowerPoint layout is easy-to-edit so you can change the font size, font type, color, and shape conveniently. In addition to this, the PowerPoint layout is Google Slides compatible, so you can share it with your audience and give them access to edit it. Therefore, download and save this well-researched 6 months big data analysis strategy roadmap diagrams in different formats like PDF, PNG, and JPG to smoothly execute your business plan.

3 Months Business Analytics Roadmap With Data Analytics Structure
We present our 3 months business analytics roadmap with data analytics structure. This PowerPoint layout is easy-to-edit so you can change the font size, font type, color, and shape conveniently. In addition to this, the PowerPoint layout is Google Slides compatible, so you can share it with your audience and give them access to edit it. Therefore, download and save this well-researched 3 months business analytics roadmap with data analytics structure in different formats like PDF, PNG, and JPG to smoothly execute your business plan.

6 Months Business Analytics Roadmap With Data Analytics Brochure
We present our 6 months business analytics roadmap with data analytics brochure. This PowerPoint layout is easy-to-edit so you can change the font size, font type, color, and shape conveniently. In addition to this, the PowerPoint layout is Google Slides compatible, so you can share it with your audience and give them access to edit it. Therefore, download and save this well-researched 6 months business analytics roadmap with data analytics brochure in different formats like PDF, PNG, and JPG to smoothly execute your business plan.
