AI PPT Maker
Templates
PPT Bundles
Design Services
Business PPTs
Business Plan
Management
Strategy
Introduction PPT
Roadmap
Self Introduction
Timelines
Process
Marketing
Agenda
Technology
Medical
Startup Business Plan
Cyber Security
Dashboards
SWOT
Proposals
Education
Pitch Deck
Digital Marketing
KPIs
Project Management
Product Management
Artificial Intelligence
Target Market
Communication
Supply Chain
Google Slides
Research Services
 One Pagers
All Categories
-
Home
- Customer Favorites
- Monthly Dashboard
Monthly Dashboard
Integrating Social Media Tactics Dashboard For Tracking Social Media Kpis Introduction PDF
This slide shows dashboard for tracking social media key performance indicators KPIs. It provides details about average social engagement, reactions, comments, shares, clicks, thumbnail, platform, post message, etc. Deliver an awe inspiring pitch with this creative Integrating Social Media Tactics Dashboard For Tracking Social Media Kpis Introduction PDF bundle. Topics like Month Upper Fence, Social KPIs, Conversion Rate can be discussed with this completely editable template. It is available for immediate download depending on the needs and requirements of the user.

Unified Business To Consumer Marketing Strategy Lead Generation Dashboard Template PDF
This infographic is used to track the multichannel marketing dashboard which covers lead breakdown, different social media channels, conversion metrics.Deliver and pitch your topic in the best possible manner with this unified business to consumer marketing strategy lead generation dashboard template pdf. Use them to share invaluable insights on key conversion metrics, today lead by program, leads this month and impress your audience. This template can be altered and modified as per your expectations. So, grab it now.
Operations Of Commercial Bank Dashboard Tracking Total Loans And Deposits Ppt Icon Mockup PDF
This slide contains dashboard that are used to track the loans and deposits in the bank. Deliver an awe-inspiring pitch with this creative operations of commercial bank dashboard tracking total loans and deposits ppt icon mockup pdf bundle. Topics like growth rate, 12 month trend can be discussed with this completely editable template. It is available for immediate download depending on the needs and requirements of the user.

Employee Risk Key Performance Indicator Dashboard With Case Incident Rate Ppt Professional Information PDF
The following slide highlights the employee safety key performance indicator dashboard with case incident rate illustrating total case occurrence rate, last reported case, days without reported, causing items, corrective actions, incident pyramid, incident by month and major causes. Pitch your topic with ease and precision using this Employee Risk Key Performance Indicator Dashboard With Case Incident Rate Ppt Professional Information PDF. This layout presents information on Total Case, Incident Rate, Last Incident Reported, Incident Causing Items. It is also available for immediate download and adjustment. So, changes can be made in the color, design, graphics or any other component to create a unique layout.

Supply Chain Strategic Planning KPI Dashboard Depicting Inventory And Costs Template PDF
This slide delineates supply planning key performance indicator kpi dashboard depicting inventory and costs which can assist logistics manager in determining demand and supply of products. It includes information about transaction based on units, out of stock products, inventory turnover and month to date expenditures. Showcasing this set of slides titled Supply Chain Strategic Planning KPI Dashboard Depicting Inventory And Costs Template PDF. The topics addressed in these templates are Transaction Based Units, 2016 To 2022. All the content presented in this PPT design is completely editable. Download it and make adjustments in color, background, font etc. as per your unique business setting.

Inspecting Sales Optimization Areas Sales Analysis Dashboard To Measure Performance Demonstration PDF
This slide showcases a dashboard presenting various metrics to measure and analyze sales performance for revenue growth. It includes key components such as number of annual new customer, sales revenue, customer satisfaction, customer acquisition cost, product wise sales, month wise sales and sales comparison. From laying roadmaps to briefing everything in detail, our templates are perfect for you. You can set the stage with your presentation slides. All you have to do is download these easy-to-edit and customizable templates. Inspecting Sales Optimization Areas Sales Analysis Dashboard To Measure Performance Demonstration PDF will help you deliver an outstanding performance that everyone would remember and praise you for. Do download this presentation today.
Forecasting And Managing Consumer Attrition For Business Advantage Dashboard Customer Purchase Tracking Repeat Structure PDF
The firm is looking forward to track customer experience by tracking various touchpoints in order to handle issues such customer churn. KPIs mentioned in the dashboard are measured regularly across the organization. Deliver and pitch your topic in the best possible manner with this forecasting and managing consumer attrition for business advantage dashboard customer purchase tracking repeat structure pdf. Use them to share invaluable insights on total repeat sales after coupon, total repeat sales after reward, total cart value per month and impress your audience. This template can be altered and modified as per your expectations. So, grab it now.

Strategic Partnership Management Plan Customer Relationship Management Dashboard Value Demonstration PDF
This slide covers the customer relationship management dashboard which includes company goals, revenue by deal source, new deals, etc. Deliver and pitch your topic in the best possible manner with this strategic partnership management plan customer relationship management dashboard value demonstration pdf. Use them to share invaluable insights on revenue this quarter, revenue goal attainment this year, revenue by deal source this year, revenue by deal source by owner this year, pipeline coverage this year, forecast this year, new deals by month this year and impress your audience. This template can be altered and modified as per your expectations. So, grab it now.
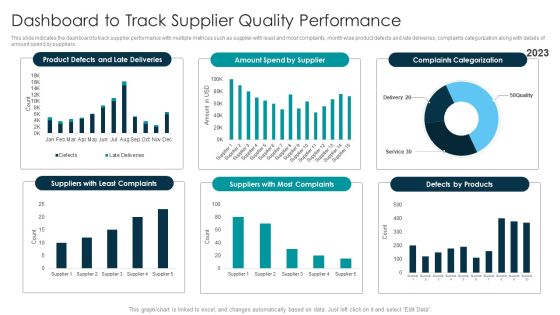
Tactical Approach For Vendor Reskilling Dashboard To Track Supplier Quality Performance Template PDF
This slide indicates the dashboard to track supplier performance with multiple metrices such as supplier with least and most complaints, month wise product defects and late deliveries, complaints categorization along with details of amount spend by suppliers. Make sure to capture your audiences attention in your business displays with our gratis customizable Tactical Approach For Vendor Reskilling Dashboard To Track Supplier Quality Performance Template PDF. These are great for business strategies, office conferences, capital raising or task suggestions. If you desire to acquire more customers for your tech business and ensure they stay satisfied, create your own sales presentation with these plain slides.
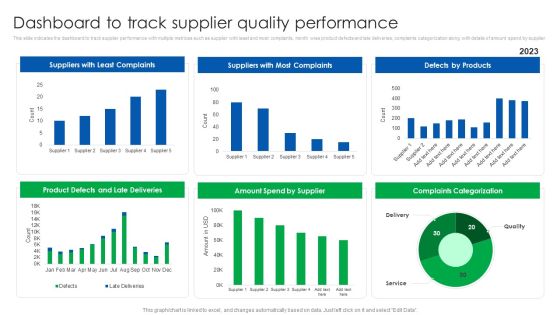
Vendor Relationship Management Strategic Plan Dashboard To Track Supplier Quality Performance Portrait PDF
This slide indicates the dashboard to track supplier performance with multiple metrices such as supplier with least and most complaints, month wise product defects and late deliveries, complaints categorization along with details of amount spend by supplier. Make sure to capture your audiences attention in your business displays with our gratis customizable Vendor Relationship Management Strategic Plan Dashboard To Track Supplier Quality Performance Portrait PDF. These are great for business strategies, office conferences, capital raising or task suggestions. If you desire to acquire more customers for your tech business and ensure they stay satisfied, create your own sales presentation with these plain slides.

HR Budget Vs Actual KPI Dashboard Ppt PowerPoint Presentation File Structure PDF
The given below slide highlights the key metrics of HR budget to manage expense stream and take assist decision making. It includes KPAs such as month wise variations in budget, total amount allocated, actual expenditures etc. Pitch your topic with ease and precision using this HR Budget Vs Actual KPI Dashboard Ppt PowerPoint Presentation File Structure PDF. This layout presents information on Amount Allocated, Expenses by Heads, Budget Achieved. It is also available for immediate download and adjustment. So, changes can be made in the color, design, graphics or any other component to create a unique layout.

Dashboard For Tracking And Measuring Business Sales And Revenue Ppt PowerPoint Presentation Slides Introduction PDF
Showcasing this set of slides titled dashboard for tracking and measuring business sales and revenue ppt powerpoint presentation slides introduction pdf. The topics addressed in these templates are revenue by pipeline jun 2020, new deals by month this year 2020, forecast june 2020, revenue goal attainment by owner jun 2020, revenue goal attainment jun 2020, pipeline coverage jul 2020. All the content presented in this PPT design is completely editable. Download it and make adjustments in color, background, font etc. as per your unique business setting.

Cyber Security Cases Action Plan Dashboard For Response Ppt PowerPoint Presentation File Deck PDF
This slide shows cyber security events matrices. The purpose of this dashboard is to track cyber threat incidents and to classify resolve and unresolve incidents. It includes elements such as incident status, new incidents, last six months incident graph. Showcasing this set of slides titled Cyber Security Cases Action Plan Dashboard For Response Ppt PowerPoint Presentation File Deck PDF. The topics addressed in these templates are Current Month, Closed Incidents, Last Month, Resolved Incidents. All the content presented in this PPT design is completely editable. Download it and make adjustments in color, background, font etc. as per your unique business setting.
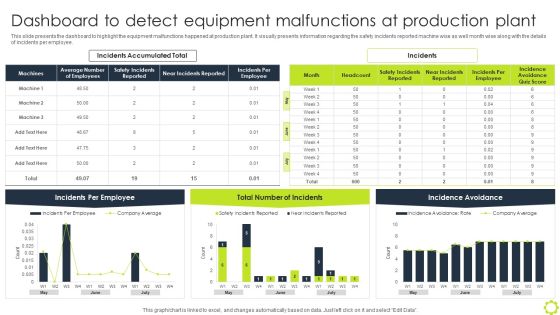
Machine Repairing And Servicing Dashboard To Detect Equipment Malfunctions At Rules PDF
This slide presents the dashboard to highlight the equipment malfunctions happened at production plant. It visually presents information regarding the safety incidents reported machine wise as well month wise along with the details of incidents per employee. Create an editable Machine Repairing And Servicing Dashboard To Detect Equipment Malfunctions At Rules PDF that communicates your idea and engages your audience. Whether youre presenting a business or an educational presentation, pre-designed presentation templates help save time. Machine Repairing And Servicing Dashboard To Detect Equipment Malfunctions At Rules PDF is highly customizable and very easy to edit, covering many different styles from creative to business presentations. Slidegeeks has creative team members who have crafted amazing templates. So, go and get them without any delay.

Dashboard To Track Supplier Quality Performance Vendor Management Program For Supplier Infographics PDF
This slide indicates the dashboard to track supplier performance with multiple metrices such as supplier with least and most complaints, month wise product defects and late deliveries, complaints categorization along with details of amount spend by suppliers.Boost your pitch with our creative Dashboard To Track Supplier Quality Performance Vendor Management Program For Supplier Infographics PDF. Deliver an awe-inspiring pitch that will mesmerize everyone. Using these presentation templates you will surely catch everyones attention. You can browse the ppts collection on our website. We have researchers who are experts at creating the right content for the templates. So you do not have to invest time in any additional work. Just grab the template now and use them.

Strategic Sourcing And Supplier Quality Dashboard To Track Supplier Quality Performance Microsoft PDF
This slide indicates the dashboard to track supplier performance with multiple metrices such as supplier with least and most complaints, month wise product defects and late deliveries, complaints categorization along with details of amount spend by suppliers.Slidegeeks has constructed Strategic Sourcing And Supplier Quality Dashboard To Track Supplier Quality Performance Microsoft PDF after conducting extensive research and examination. These presentation templates are constantly being generated and modified based on user preferences and critiques from editors. Here, you will find the most attractive templates for a range of purposes while taking into account ratings and remarks from users regarding the content. This is an excellent jumping-off point to explore our content and will give new users an insight into our top-notch PowerPoint Templates.
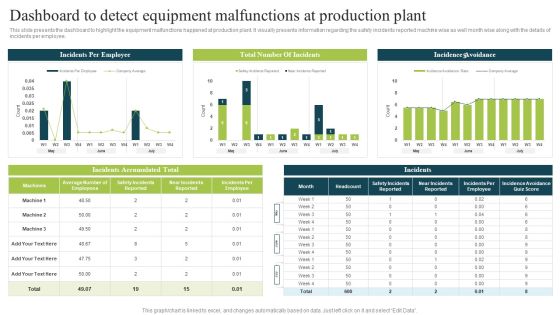
Plan To Enhance Manufacturing Dashboard To Detect Equipment Malfunctions Topics PDF
This slide presents the dashboard to highlight the equipment malfunctions happened at production plant. It visually presents information regarding the safety incidents reported machine wise as well month wise along with the details of incidents per employee. Slidegeeks has constructed Plan To Enhance Manufacturing Dashboard To Detect Equipment Malfunctions Topics PDF after conducting extensive research and examination. These presentation templates are constantly being generated and modified based on user preferences and critiques from editors. Here, you will find the most attractive templates for a range of purposes while taking into account ratings and remarks from users regarding the content. This is an excellent jumping-off point to explore our content and will give new users an insight into our top-notch PowerPoint Templates.

Strategies For Effective Manufacturing Dashboard To Detect Equipment Malfunctions Sample PDF
This slide presents the dashboard to highlight the equipment malfunctions happened at production plant. It visually presents information regarding the safety incidents reported machine wise as well month wise along with the details of incidents per employee. Slidegeeks has constructed Strategies For Effective Manufacturing Dashboard To Detect Equipment Malfunctions Sample PDF after conducting extensive research and examination. These presentation templates are constantly being generated and modified based on user preferences and critiques from editors. Here, you will find the most attractive templates for a range of purposes while taking into account ratings and remarks from users regarding the content. This is an excellent jumping-off point to explore our content and will give new users an insight into our top-notch PowerPoint Templates.
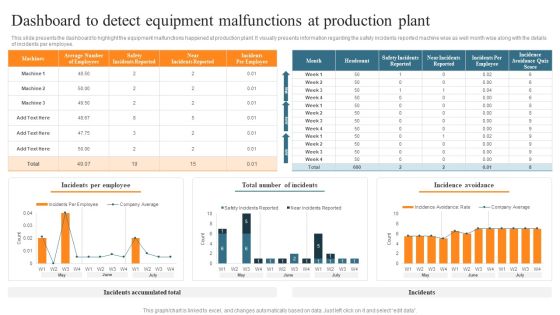
Leveraging Predictive Maintenance To Enhance Production Process Dashboard To Detect Equipment Malfunctions At Production Slides PDF
This slide presents the dashboard to highlight the equipment malfunctions happened at production plant. It visually presents information regarding the safety incidents reported machine wise as well month wise along with the details of incidents per employee. Want to ace your presentation in front of a live audience Our Leveraging Predictive Maintenance To Enhance Production Process Dashboard To Detect Equipment Malfunctions At Production Slides PDF can help you do that by engaging all the users towards you.. Slidegeeks experts have put their efforts and expertise into creating these impeccable powerpoint presentations so that you can communicate your ideas clearly. Moreover, all the templates are customizable, and easy-to-edit and downloadable. Use these for both personal and commercial use.

Online Marketing Strategy For Lead Generation Dashboard To Track Website Traffic During Performance Icons PDF
This slide showcases dashboard that can help marketers to track the website traffic during execution of performance marketing activities. Its key elements are organic sessions, organic page views, inorganic sessions by month etc. Take your projects to the next level with our ultimate collection of Online Marketing Strategy For Lead Generation Dashboard To Track Website Traffic During Performance Icons PDF. Slidegeeks has designed a range of layouts that are perfect for representing task or activity duration, keeping track of all your deadlines at a glance. Tailor these designs to your exact needs and give them a truly corporate look with your own brand colors they will make your projects stand out from the rest
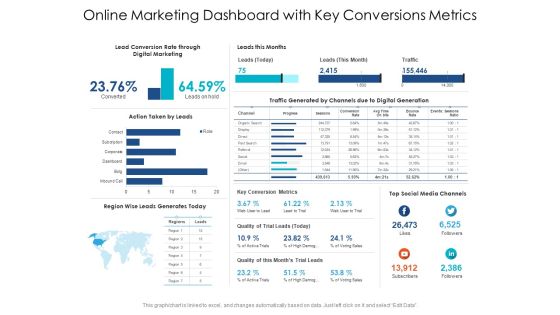
Online Marketing Dashboard With Key Conversions Metrics Ppt PowerPoint Presentation Gallery File Formats PDF
Presenting this set of slides with name online marketing dashboard with key conversions metrics ppt powerpoint presentation gallery file formats pdf. The topics discussed in these slides are Lead Conversion Rate through Digital Marketing, Leads this Months, Action Taken by Leads, Key Conversion Metrics, Quality of Trial Leads, Quality of this Months Trial leads. This is a completely editable PowerPoint presentation and is available for immediate download. Download now and impress your audience.
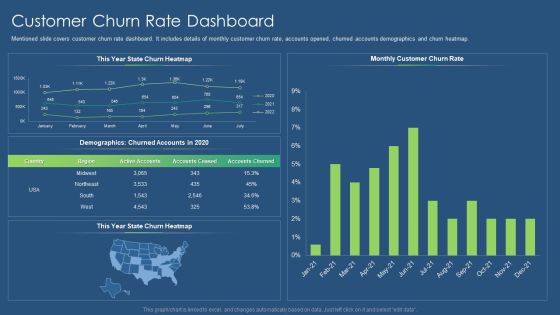
Sustainability Calculation With KPI Customer Churn Rate Dashboard Mockup PDF Mockup PDF
Mentioned slide covers cash flow dashboard. It shows detailed cash flow status in a 12 months format and working capital with accounts receivable and payable details. Deliver and pitch your topic in the best possible manner with this sustainability calculation with kpi cash flow dashboard liquidity ratio inspiration pdf. Use them to share invaluable insights on cash flow dashboard and impress your audience. This template can be altered and modified as per your expectations. So, grab it now.
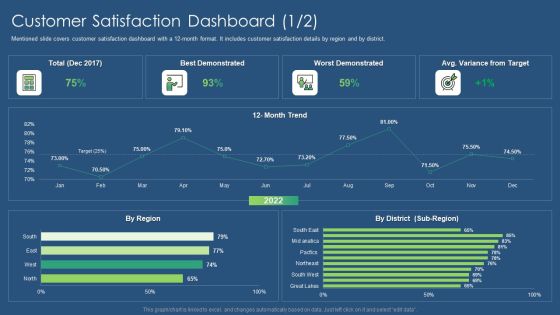
Sustainability Calculation With KPI Customer Satisfaction Dashboard Target Professional PDF Structure PDF
This slide covers customer lifetime value dashboard. It covers details of average customer lifetime and average lifetime value in a 12 months format. Deliver and pitch your topic in the best possible manner with this sustainability calculation with kpi customer lifetime value dashboard formats pdf. Use them to share invaluable insights on customer lifetime value dashboard and impress your audience. This template can be altered and modified as per your expectations. So, grab it now.

Customer Lifetime Value Dashboard Company Performance Evaluation Using KPI Formats PDF
This slide covers customer lifetime value dashboard. It covers details of average customer lifetime and average lifetime value in a 12 months format. Deliver and pitch your topic in the best possible manner with this Customer Lifetime Value Dashboard Company Performance Evaluation Using KPI Formats PDF. Use them to share invaluable insights on Customer Lifetime, Value Dashboard and impress your audience. This template can be altered and modified as per your expectations. So, grab it now.

Kpis For Evaluating Business Sustainability Customer Lifetime Value Dashboard Clipart PDF
This slide covers customer lifetime value dashboard. It covers details of average customer lifetime and average lifetime value in a 12 months format. Deliver and pitch your topic in the best possible manner with this Kpis For Evaluating Business Sustainability Customer Lifetime Value Dashboard Clipart PDF. Use them to share invaluable insights on Average Customer Lifetime, Average Lifetime Value and impress your audience. This template can be altered and modified as per your expectations. So, grab it now.
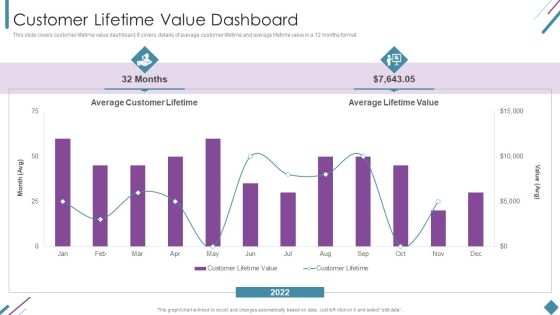
Metrics To Measure Business Performance Customer Lifetime Value Dashboard Slides PDF
This slide covers customer lifetime value dashboard. It covers details of average customer lifetime and average lifetime value in a 12 months format. Deliver and pitch your topic in the best possible manner with this Metrics To Measure Business Performance Customer Lifetime Value Dashboard Slides PDF. Use them to share invaluable insights on Average Customer Lifetime, Average Lifetime Value, 2022 and impress your audience. This template can be altered and modified as per your expectations. So, grab it now.

Economic Facts And Insights Analysis Dashboard Ppt PowerPoint Presentation Inspiration Slide Download PDF
Showcasing this set of slides titled economic facts and insights analysis dashboard ppt powerpoint presentation inspiration slide download pdf. The topics addressed in these templates are current working capital, cash conversion cycle in days last, current quick stats, vendor payment error rate last, 12 months currnet budget variance. All the content presented in this PPT design is completely editable. Download it and make adjustments in color, background, font etc. as per your unique business setting.

Growing Churn Rate In IT Organization Dashboard Employee Attrition Rate Employee Download PDF
Deliver and pitch your topic in the best possible manner with this growing churn rate in it organization dashboard employee attrition rate employee download pdf. Use them to share invaluable insights on turnover rate year over year, turnover rate by division, actual vs benchmark work time in months per division and impress your audience. This template can be altered and modified as per your expectations. So, grab it now.

Consumer Acquisition And Retention Dashboard With Loyal Consumer Rate And CLV Brochure PDF
This slide contains the complete dashboard of customer retention and acquisition matrix details. It includes current and previous months comparison of various types of KPIs used for strong customer base like customer churn, revenue churn, net retention and MRR growth. Showcasing this set of slides titled Consumer Acquisition And Retention Dashboard With Loyal Consumer Rate And CLV Brochure PDF. The topics addressed in these templates are Consumer Churn, Revenue Churn, Premium Users. All the content presented in this PPT design is completely editable. Download it and make adjustments in color, background, font etc. as per your unique business setting.

Sustainability Calculation With KPI Customer Service Dashboard Revenue Ideas PDF Graphics PDF
Following slide illustrates customer service dashboard covering details such as request answered, total requests, total revenue and support cost revenue. It also includes customer satisfaction score, customer retention in a 12 months format. Deliver and pitch your topic in the best possible manner with this sustainability calculation with kpi customer service dashboard microsoft pdf. Use them to share invaluable insights on customer satisfaction, revenue, customer retention and impress your audience. This template can be altered and modified as per your expectations. So, grab it now.
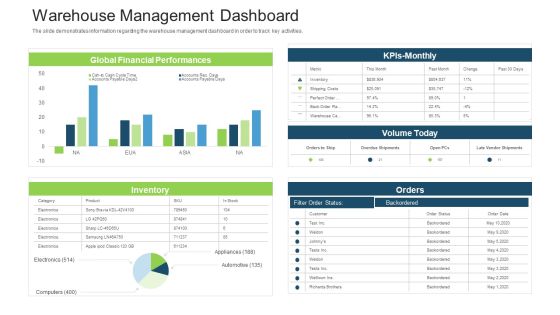
Stock Control System Warehouse Management Dashboard Ppt Visual Aids Outline PDF
The slide demonstrates information regarding the warehouse management dashboard in order to track key activities. Deliver and pitch your topic in the best possible manner with this stock control system warehouse management dashboard ppt visual aids outline pdf. Use them to share invaluable insights on kpls monthly, orders, inventory, global financial performances, volume today and impress your audience. This template can be altered and modified as per your expectations. So, grab it now.

Dashboards And Scorecards Comparison Diagram Ppt Slides
This is a dashboards and scorecards comparison diagram ppt slides. This is a three stage process. The stages in this process are dashboard, balanced scorecard, differences, performance management, periodically monthly, gps shows how will arrive, is used for, is update, in automobile it is, performance monitoring, in real time, automobile dashboard shows how your car is operating.
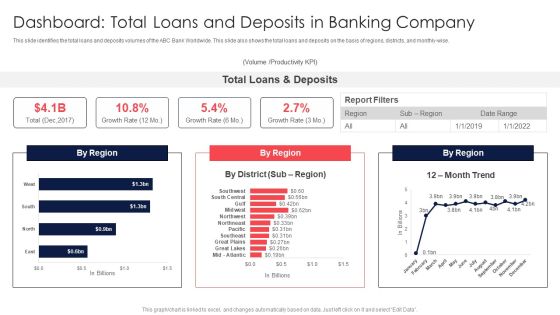
Digital Transformation Of Consumer Dashboard Total Loans And Deposits In Banking Company Topics PDF
This slide identifies the total loans and deposits volumes of the ABC Bank Worldwide. This slide also shows the total loans and deposits on the basis of regions, districts, and monthly-wise. Deliver an awe inspiring pitch with this creative Digital Transformation Of Consumer Dashboard Total Loans And Deposits In Banking Company Topics PDF bundle. Topics like Total Loans, Report Filters can be discussed with this completely editable template. It is available for immediate download depending on the needs and requirements of the user.

Sales Work Performance Monitoring Dashboard With Actual And Targets Introduction PDF
This slide elaborates about the performance of sales of an organization to know about the actual position of the firm. Showcasing this set of slides titled Sales Work Performance Monitoring Dashboard With Actual And Targets Introduction PDF. The topics addressed in these templates are Sales Realization, Team Monthly, Performance. All the content presented in this PPT design is completely editable. Download it and make adjustments in color, background, font etc. as per your unique business setting.

Online Product Planning Ecommerce Management KPI Dashboard Ppt Layouts Background Image PDF
Presenting this set of slides with name online product planning ecommerce management kpi dashboard ppt layouts background image pdf. The topics discussed in these slides are total volume sold this month, average purchase value, growth in average purchase value, growth in volume sold this month, growth in sales this month, total sales this month. This is a completely editable PowerPoint presentation and is available for immediate download. Download now and impress your audience.

Crm Dashboard This Year Sales Vs Last Year Sales Ppt PowerPoint Presentation Information
This is a crm dashboard this year sales vs last year sales ppt powerpoint presentation information. This is a five stage process. The stages in this process are this year sales and last year sales by given in fiscal month.

Crm Dashboard This Year Sales Vs Last Year Sales Ppt PowerPoint Presentation Styles
This is a crm dashboard this year sales vs last year sales ppt powerpoint presentation styles. This is a two stage process. The stages in this process are sales given in fiscal month, business, marketing, presentation, growth.

Crm Dashboard This Year Sales Vs Last Year Sales Ppt PowerPoint Presentation Layouts Outline
This is a crm dashboard this year sales vs last year sales ppt powerpoint presentation layouts outline. This is a two stage process. The stages in this process are sales given in fiscal month, this year sales, last year sales.
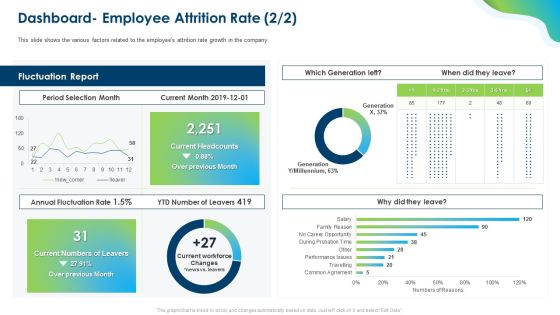
Growing Churn Rate In IT Organization Dashboard Employee Attrition Rate Report Topics PDF
Deliver an awe-inspiring pitch with this creative growing churn rate in it organization dashboard employee attrition rate report topics pdf bundle. Topics like period selection month, current month, annual fluctuation rate can be discussed with this completely editable template. It is available for immediate download depending on the needs and requirements of the user.
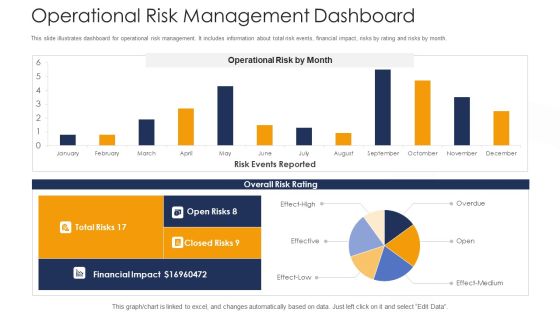
Strategies To Tackle Operational Risk In Banking Institutions Operational Risk Management Dashboard Structure PDF
This slide illustrates dashboard for operational risk management. It includes information about total risk events, financial impact, risks by rating and risks by month. Deliver an awe inspiring pitch with this creative strategies to tackle operational risk in banking institutions operational risk management dashboard structure pdf bundle. Topics like financial impact, operational risk management dashboard can be discussed with this completely editable template. It is available for immediate download depending on the needs and requirements of the user.
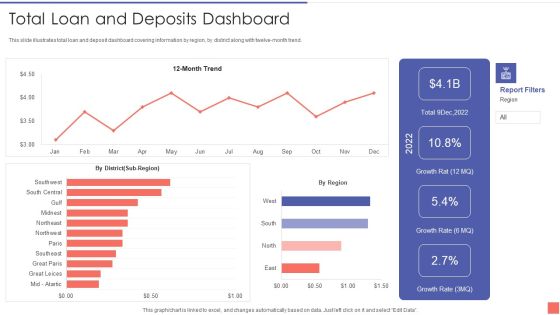
Providing Electronic Financial Services To Existing Consumers Total Loan And Deposits Dashboard Guidelines PDF
This slide illustrates total loan and deposit dashboard covering information by region, by district along with twelve-month trend. Deliver an awe inspiring pitch with this creative Providing Electronic Financial Services To Existing Consumers Total Loan And Deposits Dashboard Guidelines PDF bundle. Topics like Total Loan And Deposits Dashboard can be discussed with this completely editable template. It is available for immediate download depending on the needs and requirements of the user.
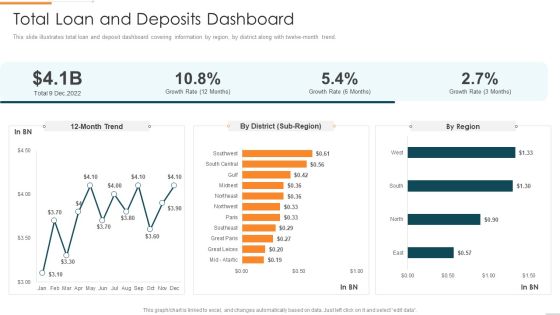
Enhanced Customer Banking Experience With Mobile Total Loan And Deposits Dashboard Professional PDF
This slide illustrates total loan and deposit dashboard covering information by region, by district along with twelve-month trend.Deliver an awe inspiring pitch with this creative Enhanced Customer Banking Experience With Mobile Total Loan And Deposits Dashboard Professional PDF bundle. Topics like Total Loan And Deposits Dashboard can be discussed with this completely editable template. It is available for immediate download depending on the needs and requirements of the user.

Conducting Monetary Inclusion With Mobile Financial Services Total Loan And Deposits Dashboard Download PDF
This slide illustrates total loan and deposit dashboard covering information by region, by district along with twelve-month trend.Deliver and pitch your topic in the best possible manner with this Conducting Monetary Inclusion With Mobile Financial Services Total Loan And Deposits Dashboard Download PDF. Use them to share invaluable insights on Total Loan, Deposits Dashboard and impress your audience. This template can be altered and modified as per your expectations. So, grab it now.

Risk Awareness And Risk Key Performance Indicator Dashboard Ppt Inspiration Ideas PDF
The following slide highlights the risk awareness and safety key performance indicator dashboard illustrating risk awareness, clear leadership, risk mitigation preparedness, risk incidents last month, safety incidents last months, inspection plan adherence, risk and safety quality training, trained people last month, monitoring, safety tools change on and risk awareness. Showcasing this set of slides titled Risk Awareness And Risk Key Performance Indicator Dashboard Ppt Inspiration Ideas PDF. The topics addressed in these templates are Safety Incident Avoided, Safety Incidents, Safety Incident, Accumulated Total. All the content presented in this PPT design is completely editable. Download it and make adjustments in color, background, font etc. as per your unique business setting.
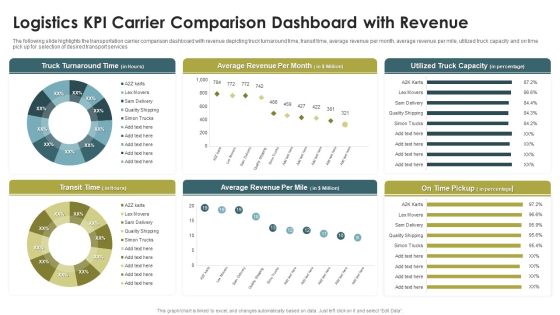
Logistics KPI Carrier Comparison Dashboard With Revenue Ppt Infographics Portfolio PDF
The following slide highlights the transportation carrier comparison dashboard with revenue depicting truck turnaround time, transit time, average revenue per month, average revenue per mile, utilized truck capacity and on time pick up for selection of desired transport services. Pitch your topic with ease and precision using this Logistics KPI Carrier Comparison Dashboard With Revenue Ppt Infographics Portfolio PDF. This layout presents information on Truck Turnaround Time, Average Revenue, Per Month, Transit Time. It is also available for immediate download and adjustment. So, changes can be made in the color, design, graphics or any other component to create a unique layout.
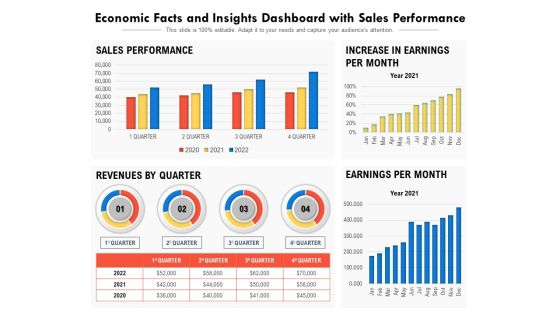
Economic Facts And Insights Dashboard With Sales Performance Ppt PowerPoint Presentation Show Gallery PDF
Showcasing this set of slides titled economic facts and insights dashboard with sales performance ppt powerpoint presentation show gallery pdf. The topics addressed in these templates are sales performance, increase in earnings per month, revenues by quarter, earnings per month. All the content presented in this PPT design is completely editable. Download it and make adjustments in color, background, font etc. as per your unique business setting.

Initiating Hazard Managing Structure Firm Operational Risk Management Dashboard Brochure PDF
This slide illustrates dashboard for operational risk management. It includes information about total risk events, financial impact, risks by rating and risks by month. Deliver an awe-inspiring pitch with this creative initiating hazard managing structure firm operational risk management dashboard brochure pdf bundle. Topics like financial impact, operational risk, risk events, risk rating can be discussed with this completely editable template. It is available for immediate download depending on the needs and requirements of the user.
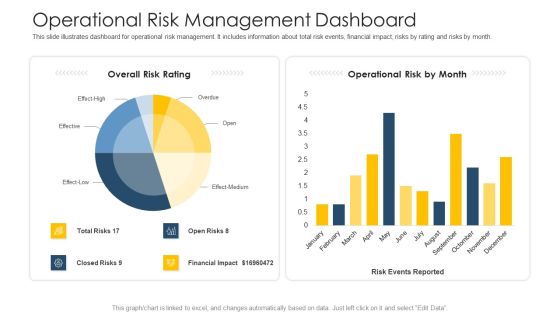
Establishing Operational Risk Framework Banking Operational Risk Management Dashboard Slides PDF
This slide illustrates dashboard for operational risk management. It includes information about total risk events, financial impact, risks by rating and risks by month. Deliver and pitch your topic in the best possible manner with this establishing operational risk framework banking operational risk management dashboard slides pdf. Use them to share invaluable insights on financial impact, operational risk, overall risk rating and impress your audience. This template can be altered and modified as per your expectations. So, grab it now.
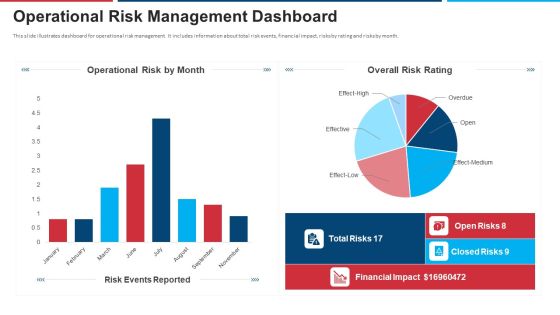
Mitigation Strategies For Operational Threat Operational Risk Management Dashboard Ppt Layouts Example PDF
This slide illustrates dashboard for operational risk management. It includes information about total risk events, financial impact, risks by rating and risks by month. Deliver and pitch your topic in the best possible manner with this mitigation strategies for operational threat operational risk management dashboard ppt layouts example pdf. Use them to share invaluable insights on financial, effective, operational risk, overall risk rating and impress your audience. This template can be altered and modified as per your expectations. So, grab it now.

Staff Retention Plan Dashboard For Employee Retention Polices Ppt Infographics Backgrounds PDF
Purpose of the following slide is to show the Employee Attrition dashboard as it highlights the Employee turnover rate, average seniority of employees in months, year-over-year turnover rate etc. Deliver and pitch your topic in the best possible manner with this staff retention plan dashboard for employee retention polices ppt infographics backgrounds pdf. Use them to share invaluable insights on turnover rate, employees these and impress your audience. This template can be altered and modified as per your expectations. So, grab it now.
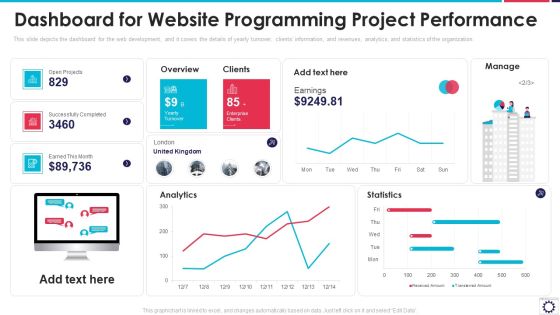
Website Programming IT Dashboard For Website Programming Project Performance Inspiration PDF
This slide depicts the dashboard for the web development, and it covers the details of yearly turnover, clients information, and revenues, analytics, and statistics of the organization. Deliver an awe inspiring pitch with this creative website programming it dashboard for website programming project performance inspiration pdf bundle. Topics like open projects, successfully completed, earned month, analytics, statistics can be discussed with this completely editable template. It is available for immediate download depending on the needs and requirements of the user.

Customer Relationship Management Lifecycle Analytics Dashboard With Sales Record Brochure PDF
This slide signifies the customer relationship management analytics dashboard. It covers information about sales record by different representative, total products sold, sales by different month, etc.Pitch your topic with ease and precision using this Customer Relationship Management Lifecycle Analytics Dashboard With Sales Record Brochure PDF. This layout presents information on Sales Record, Representative, Total Items. It is also available for immediate download and adjustment. So, changes can be made in the color, design, graphics or any other component to create a unique layout.

Strategic Risk Management Plan Operational Risk Management Key Metrics Dashboard Structure PDF
This slide represents dashboard representing the key metrics of operational risk management. It includes KPIs such as operational risk by rating, by month, operational risk list etc.Create an editable Strategic Risk Management Plan Operational Risk Management Key Metrics Dashboard Structure PDF that communicates your idea and engages your audience. Whether you are presenting a business or an educational presentation, pre-designed presentation templates help save time. Strategic Risk Management Plan Operational Risk Management Key Metrics Dashboard Structure PDF is highly customizable and very easy to edit, covering many different styles from creative to business presentations. Slidegeeks has creative team members who have crafted amazing templates. So, go and get them without any delay.
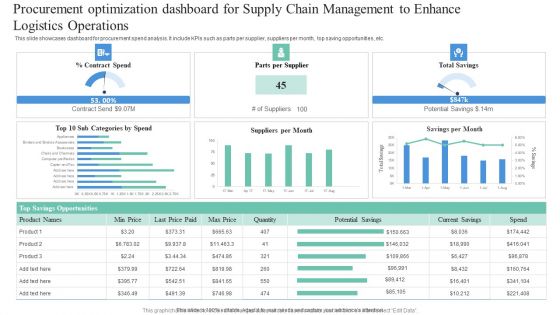
Procurement Optimization Dashboard For Supply Chain Management To Enhance Logistics Operations Elements PDF
This slide showcases dashboard for procurement spend analysis. It include KPIs such as parts per supplier, suppliers per month, top saving opportunities, etc. Pitch your topic with ease and precision using this Procurement Optimization Dashboard For Supply Chain Management To Enhance Logistics Operations Elements PDF. This layout presents information on Procurement Optimization Dashboard, Supply Chain Management, Enhance Logistic Operations. It is also available for immediate download and adjustment. So, changes can be made in the color, design, graphics or any other component to create a unique layout.
Modifying Banking Functionalities Dashboard Tracking Customer Retention Rate Partner Structure PDF
This slide contains dashboard that will allow bank to track the retention rate of customer within span of 6 months. Number of accounts that are successfully retained by the bank. It will also bank in tracking accounts that are cancelled. Deliver an awe inspiring pitch with this creative enhancing financial institution operations dashboard tracking customer retention rate partner introduction pdf bundle. Topics like dashboard tracking customer retention rate can be discussed with this completely editable template. It is available for immediate download depending on the needs and requirements of the user.

Product Sales Analysis Dashboard Report Ppt PowerPoint Presentation Infographics Graphics Pictures PDF
Presenting this set of slides with name product sales analysis dashboard report ppt powerpoint presentation infographics graphics pictures pdf. The topics discussed in these slides are average operative costs, product models performance, production last year, sales by month, taxed amount. This is a completely editable PowerPoint presentation and is available for immediate download. Download now and impress your audience.
Expansion Oriented Strategic Plan Business Performance Dashboard Ppt PowerPoint Presentation Styles Icon PDF
Presenting this set of slides with name expansion oriented strategic plan business performance dashboard ppt powerpoint presentation styles icon pdf. The topics discussed in these slides are revenue, new customers, gross profit, customer satisfaction, sales comparison, sales month. This is a completely editable PowerPoint presentation and is available for immediate download. Download now and impress your audience.

Business Sales Dashboard With Product Category Ppt PowerPoint Presentation Model Objects PDF
Presenting this set of slides with name business sales dashboard with product category ppt powerpoint presentation model objects pdf. The topics discussed in these slides are revenue, new costumers, gross profit, costumer satisfaction, sales comparison, sales product category, sales month. This is a completely editable PowerPoint presentation and is available for immediate download. Download now and impress your audience.
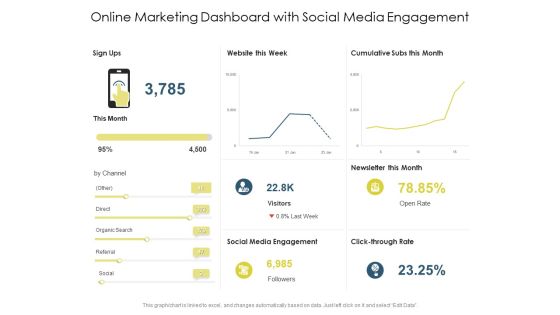
Online Marketing Dashboard With Social Media Engagement Ppt PowerPoint Presentation Show Rules PDF
Presenting this set of slides with name online marketing dashboard with social media engagement ppt powerpoint presentation show rules pdf. The topics discussed in these slides are social media engagement, newsletter this month, click through rate, visitors, referral, social, direct. This is a completely editable PowerPoint presentation and is available for immediate download. Download now and impress your audience.
Online Promotion Campaign Performance Dashboard Ppt PowerPoint Presentation Icon Ideas PDF
Presenting this set of slides with name online promotion campaign performance dashboard ppt powerpoint presentation icon ideas pdf. The topics discussed in these slides are digital campaign performance, revenue per sale, cost per lead, funnel, traffic sources, leeds this month. This is a completely editable PowerPoint presentation and is available for immediate download. Download now and impress your audience.
