Metrics

Essential Staffing Data Metrics For HR Inspiration PDF
The following slide showcases key metrics of recruitment data for HR professional and recruiters. It includes career page conversion, offer acceptance and recruitment conversion rate. Presenting Essential Staffing Data Metrics For HR Inspiration PDF to dispense important information. This template comprises three stages. It also presents valuable insights into the topics including Recruiting Conversion Rate, Offer Acceptance, Career Page Conversion. This is a completely customizable PowerPoint theme that can be put to use immediately. So, download it and address the topic impactfully.
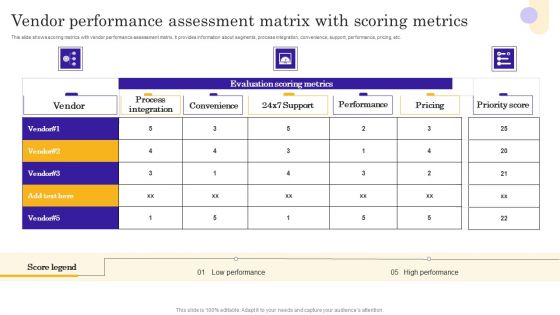
Vendor Performance Assessment Matrix With Scoring Metrics Style PDF
This slide shows scoring metrics with vendor performance assessment matrix. It provides information about segments, process integration, convenience, support, performance, pricing, etc. Pitch your topic with ease and precision using this Vendor Performance Assessment Matrix With Scoring Metrics Style PDF. This layout presents information on Process Integration, Convenience, Performance. It is also available for immediate download and adjustment. So, changes can be made in the color, design, graphics or any other component to create a unique layout.
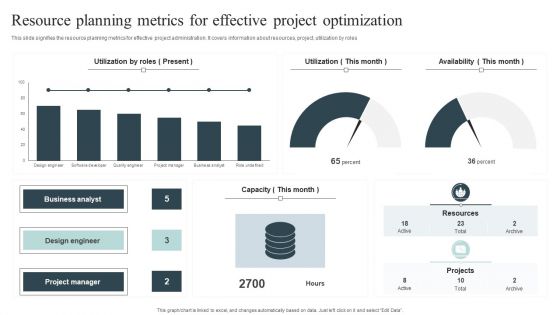
Resource Planning Metrics For Effective Project Optimization Brochure PDF
This slide signifies the resource planning metrics for effective project administration. It covers information about resources, project, utilization by roles.Pitch your topic with ease and precision using this Resource Planning Metrics For Effective Project Optimization Brochure PDF. This layout presents information on Business Analyst, Design Engineer, Project Manager. It is also available for immediate download and adjustment. So, changes can be made in the color, design, graphics or any other component to create a unique layout.

Internal Audit Metrics Flowchart Ppt Infographic Template Example Introduction PDF
This slide depicts the flowchart for the internal audit KPI metrics. It includes the information related to steps involved in the audit process and planning. Presenting Internal Audit Metrics Flowchart Ppt Infographic Template Example Introduction PDF to dispense important information. This template comprises one stages. It also presents valuable insights into the topics including Audit Members, Risk Assessment, Audit Scheduling. This is a completely customizable PowerPoint theme that can be put to use immediately. So, download it and address the topic impactfully.

Key Metrics In Quality Analytics Procedure Framework Slides PDF
This slide showcases a framework for quality analytics. It highlights the key metrics which includes descriptive, diagnostic, predictive and perspective. Persuade your audience using this Key Metrics In Quality Analytics Procedure Framework Slides PDF. This PPT design covers four stages, thus making it a great tool to use. It also caters to a variety of topics including Descriptive, Predictive, Diagnostic. Download this PPT design now to present a convincing pitch that not only emphasizes the topic but also showcases your presentation skills.
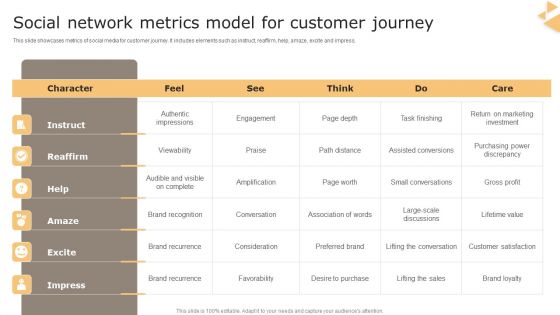
Social Network Metrics Model For Customer Journey Guidelines PDF
This slide showcases metrics of social media for customer journey. It includes elements such as instruct, reaffirm, help, amaze, excite and impress. Pitch your topic with ease and precision using this Social Network Metrics Model For Customer Journey Guidelines PDF. This layout presents information on Brand Recurrence, Marketing Investment, Customer Satisfaction. It is also available for immediate download and adjustment. So, changes can be made in the color, design, graphics or any other component to create a unique layout.

Hospital Operations Metrics To Monitor Performance Structure PDF
This slide represents a dashboard showcasing operations metrics to monitor medical institute performance. It includes the total number of patients, operational cost, available staff, etc. Showcasing this set of slides titled Hospital Operations Metrics To Monitor Performance Structure PDF. The topics addressed in these templates are Divisions, Overall Patient Satisfaction, Total Operational Cost. All the content presented in this PPT design is completely editable. Download it and make adjustments in color, background, font etc. as per your unique business setting.
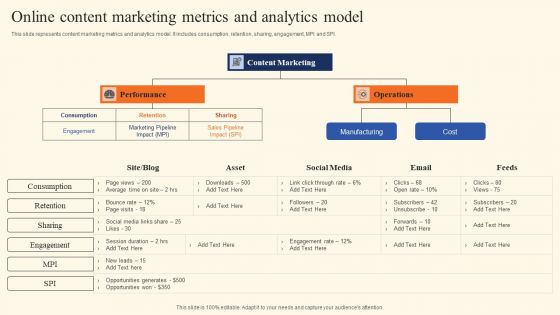
Online Content Marketing Metrics And Analytics Model Download PDF
This slide represents content marketing metrics and analytics model. It includes consumption, retention, sharing, engagement, MPI and SPI. Presenting Online Content Marketing Metrics And Analytics Model Download PDF to dispense important information. This template comprises two stages. It also presents valuable insights into the topics including Performance, Operations, Manufacturing. This is a completely customizable PowerPoint theme that can be put to use immediately. So, download it and address the topic impactfully.
Comparative Metrics For Continuous Tracking In Devops Tools Clipart PDF
This slide illustrates comparison of key performance indicators of DevOps tools. It includes metrics such as observability and visualization, observability and application, pattern analysis, etc. Showcasing this set of slides titled Comparative Metrics For Continuous Tracking In Devops Tools Clipart PDF. The topics addressed in these templates are Appdynamics, Datadog, Dynatrace. All the content presented in this PPT design is completely editable. Download it and make adjustments in color, background, font etc. as per your unique business setting.

Project Management Departmental Metrics Balanced Scorecard Introduction PDF
This slide covers the project management scorecard with department wise objectives and metrics to track their performance. The departmental objectives includes financial, customer and internal. Showcasing this set of slides titled Project Management Departmental Metrics Balanced Scorecard Introduction PDF. The topics addressed in these templates are Customer, Financial, Customer Retention. All the content presented in this PPT design is completely editable. Download it and make adjustments in color, background, font etc. as per your unique business setting.

Saas Product Business Metrics Pyramid Analysis Portrait PDF
Mentioned slide showcases a product metrics pyramid which facilitates in streamlining project management process. It covers key aspects of pyramid like north star, key influencers and levers. Presenting Saas Product Business Metrics Pyramid Analysis Portrait PDF to dispense important information. This template comprises three stages. It also presents valuable insights into the topics including North Star, Key Influencers North Star, Levers. This is a completely customizable PowerPoint theme that can be put to use immediately. So, download it and address the topic impactfully.
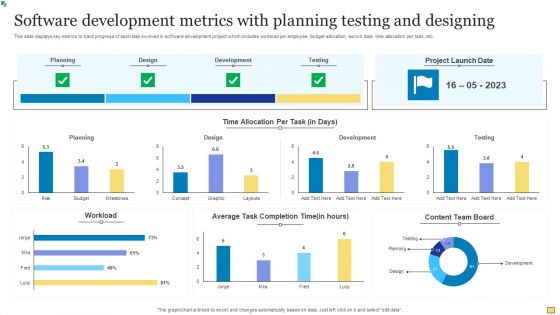
Software Development Metrics With Planning Testing And Designing Introduction PDF
This slide displays key metrics to track progress of each task involved in software development project which includes workload per employee, budget allocation, launch date, time allocation per task, etc. Showcasing this set of slides titled Software Development Metrics With Planning Testing And Designing Introduction PDF. The topics addressed in these templates are Planning, Workload, Development. All the content presented in this PPT design is completely editable. Download it and make adjustments in color, background, font etc. as per your unique business setting.
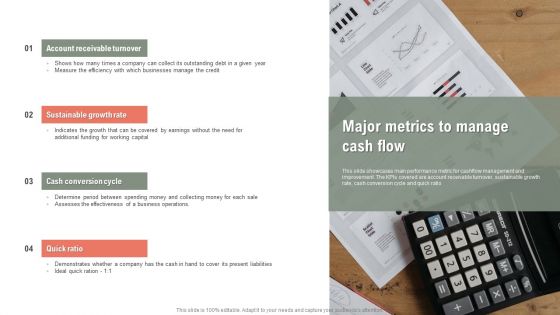
Major Metrics To Manage Cash Flow Ppt Infographics Portfolio PDF
This slide showcases main performance metric for cashflow management and improvement. The KPIs covered are account receivable turnover, sustainable growth rate, cash conversion cycle and quick ratio. Presenting Major Metrics To Manage Cash Flow Ppt Infographics Portfolio PDF to dispense important information. This template comprises four stages. It also presents valuable insights into the topics including Account Receivable Turnover, Sustainable Growth Rate, Cash Conversion Cycle. This is a completely customizable PowerPoint theme that can be put to use immediately. So, download it and address the topic impactfully.

Business Metrics Pyramid To Guide Devops Initiative Summary PDF
The slide showcases a metric oriented framework to guide the companys DevOps initiatives and helps in measuring efficiency, quality, and velocity in order to accomplish a true DevOps transformation. It covers business performance, customer value, organizational effectiveness, service quality, service velocity and operational efficiency. Presenting Business Metrics Pyramid To Guide Devops Initiative Summary PDF to dispense important information. This template comprises six stages. It also presents valuable insights into the topics including Business Performance, Customer Value, Organizational Effectiveness. This is a completely customizable PowerPoint theme that can be put to use immediately. So, download it and address the topic impactfully.
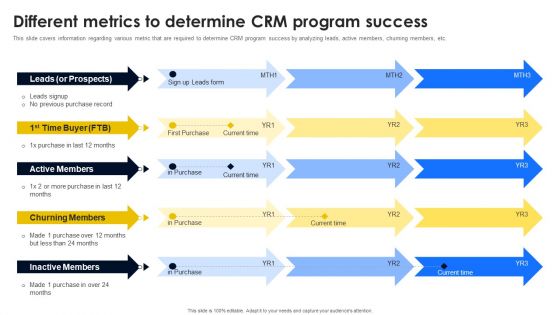
Different Metrics To Determine CRM Program Success Professional PDF
This slide covers information regarding various metric that are required to determine CRM program success by analyzing leads, active members, churning members, etc. This Different Metrics To Determine CRM Program Success Professional PDF from Slidegeeks makes it easy to present information on your topic with precision. It provides customization options, so you can make changes to the colors, design, graphics, or any other component to create a unique layout. It is also available for immediate download, so you can begin using it right away. Slidegeeks has done good research to ensure that you have everything you need to make your presentation stand out. Make a name out there for a brilliant performance.

Comparison Metrics For Business Partner Lifecycle Management Guidelines PDF
The following slide highlights the comparison metrics for partner lifecycle management illustrating key headings which includes comparison area, comparison metric, high score, low score and partner. Where comparison are depicts business size, management, growth strategy, integration and finance. Pitch your topic with ease and precision using this Comparison Metrics For Business Partner Lifecycle Management Guidelines PDF. This layout presents information on Business Size, Management, Growth Strategy. It is also available for immediate download and adjustment. So, changes can be made in the color, design, graphics or any other component to create a unique layout.

Environmental Impact Metrics For Green Financing Rules PDF
This slide consists of key performing metrices which are to be kept in mind by the business manager for encouraging sustainable activities in the organization and control financial burnout. The project categories include clean transportation, energy, sustainable use of land etc. Pitch your topic with ease and precision using this Environmental Impact Metrics For Green Financing Rules PDF. This layout presents information on Financing, Environmental, Metrics. It is also available for immediate download and adjustment. So, changes can be made in the color, design, graphics or any other component to create a unique layout.

Workforce Performance Metrics Scorecard To Measure Training Effectiveness Information PDF
Mentioned slide outlines HR KPI scorecard showcasing most important kpis. Organization can measure the success rate of HR strategy by tracking metrics such as training effectiveness, absence rate and cost, benefits satisfaction, productivity rate, net promotor score, etc.Pitch your topic with ease and precision using this Workforce Performance Metrics Scorecard To Measure Training Effectiveness Information PDF. This layout presents information on Absence Rate, Internal Promotion, Engagement Index. It is also available for immediate download and adjustment. So, changes can be made in the color, design, graphics or any other component to create a unique layout.

Instagram Metrics To Measure Marketing Campaign Performance Formats PDF
The following slide outlines different key performance indicators KPIs through which managers can evaluate the success of a marketing campaign. It contains information about metrics such as total impressions, followers growth rate, cost per click CPC, revenue generated, likes, and comments. Explore a selection of the finest Instagram Metrics To Measure Marketing Campaign Performance Formats PDF here. With a plethora of professionally designed and pre made slide templates, you can quickly and easily find the right one for your upcoming presentation. You can use our Instagram Metrics To Measure Marketing Campaign Performance Formats PDF to effectively convey your message to a wider audience. Slidegeeks has done a lot of research before preparing these presentation templates. The content can be personalized and the slides are highly editable. Grab templates today from Slidegeeks.
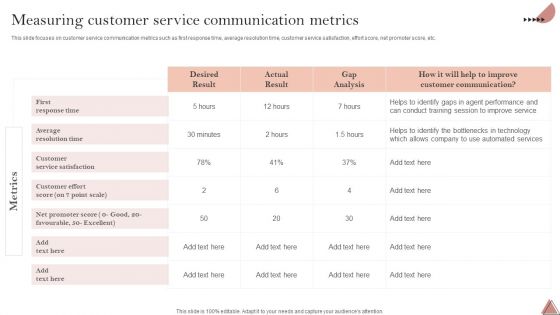
Enhancing Client Engagement Measuring Customer Service Communication Metrics Graphics PDF
This slide focuses on customer service communication metrics such as first response time, average resolution time, customer service satisfaction, effort score, net promoter score, etc. Whether you have daily or monthly meetings, a brilliant presentation is necessary. Enhancing Client Engagement Measuring Customer Service Communication Metrics Graphics PDF can be your best option for delivering a presentation. Represent everything in detail using Enhancing Client Engagement Measuring Customer Service Communication Metrics Graphics PDF and make yourself stand out in meetings. The template is versatile and follows a structure that will cater to your requirements. All the templates prepared by Slidegeeks are easy to download and edit. Our research experts have taken care of the corporate themes as well. So, give it a try and see the results.
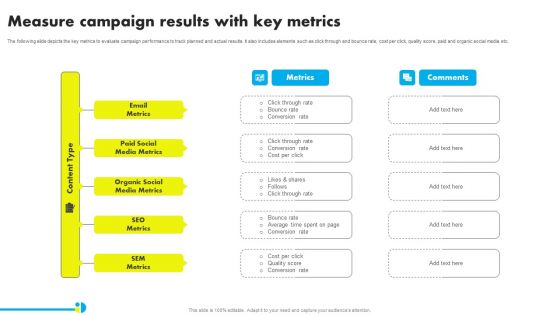
Measure Campaign Results With Key Metrics Ppt Pictures Examples PDF

Define Performance Management Objectives And Metrics Template PDF
The following slide covers the objectives and key metrics of performance management to align individual and organizations goals. It includes elements such as employee retention rate, net promotor score, competency, productivity, efficiency, engagement rate etc. Do you have to make sure that everyone on your team knows about any specific topic I yes, then you should give Define Performance Management Objectives And Metrics Template PDF a try. Our experts have put a lot of knowledge and effort into creating this impeccable Define Performance Management Objectives And Metrics Template PDF. You can use this template for your upcoming presentations, as the slides are perfect to represent even the tiniest detail. You can download these templates from the Slidegeeks website and these are easy to edit. So grab these today.
Business Analytics Application Employee Engagement Key Performance Metrics Icons PDF
This slide represents key metrics dashboard to analyze the engagement of employees in the organization. It includes details related to KPIs such as engagement score, response rate, net promoter score etc. Formulating a presentation can take up a lot of effort and time, so the content and message should always be the primary focus. The visuals of the PowerPoint can enhance the presenters message, so our Business Analytics Application Employee Engagement Key Performance Metrics Icons PDF was created to help save time. Instead of worrying about the design, the presenter can concentrate on the message while our designers work on creating the ideal templates for whatever situation is needed. Slidegeeks has experts for everything from amazing designs to valuable content, we have put everything into Business Analytics Application Employee Engagement Key Performance Metrics Icons PDF.

Human Resource Analytics Employee Engagement Key Performance Metrics Inspiration PDF
This slide represents key metrics dashboard to analyze the engagement of employees in the organization. It includes details related to KPIs such as engagement score, response rate, net promoter score etc. Crafting an eye-catching presentation has never been more straightforward. Let your presentation shine with this tasteful yet straightforward Human Resource Analytics Employee Engagement Key Performance Metrics Inspiration PDF template. It offers a minimalistic and classy look that is great for making a statement. The colors have been employed intelligently to add a bit of playfulness while still remaining professional. Construct the ideal Human Resource Analytics Employee Engagement Key Performance Metrics Inspiration PDF that effortlessly grabs the attention of your audience Begin now and be certain to wow your customers.
Post Event Activities Tracking Post Event Metrics Status Elements PDF
This slide provides an overview of the status of key metrics. The KPIs covered are the number of attendees, revenue and social media engagement. Whether you have daily or monthly meetings, a brilliant presentation is necessary. Post Event Activities Tracking Post Event Metrics Status Elements PDF can be your best option for delivering a presentation. Represent everything in detail using Post Event Activities Tracking Post Event Metrics Status Elements PDF and make yourself stand out in meetings. The template is versatile and follows a structure that will cater to your requirements. All the templates prepared by Slidegeeks are easy to download and edit. Our research experts have taken care of the corporate themes as well. So, give it a try and see the results.

Human Resources Incentive Program Key Metrics Topics PDF
This slide showcases the critical metrices of HR incentive compensation plans. It includes the category in which the metrices fall and its range.Showcasing this set of slides titled Human Resources Incentive Program Key Metrics Topics PDF. The topics addressed in these templates are Base Experiments, Incentive Pay, Excellence Ratio. All the content presented in this PPT design is completely editable. Download it and make adjustments in color, background, font etc. as per your unique business setting.
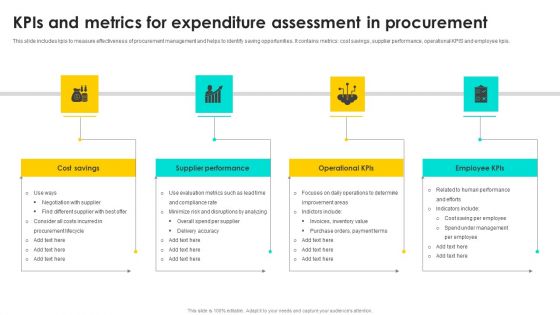
Kpis And Metrics For Expenditure Assessment In Procurement Slides PDF
This slide includes kpis to measure effectiveness of procurement management and helps to identify saving opportunities. It contains metrics cost savings, supplier performance, operational KPIS and employee kpis. Persuade your audience using this Kpis And Metrics For Expenditure Assessment In Procurement Slides PDF. This PPT design covers Four stages, thus making it a great tool to use. It also caters to a variety of topics including Cost Savings, Supplier Performance. Download this PPT design now to present a convincing pitch that not only emphasizes the topic but also showcases your presentation skills.
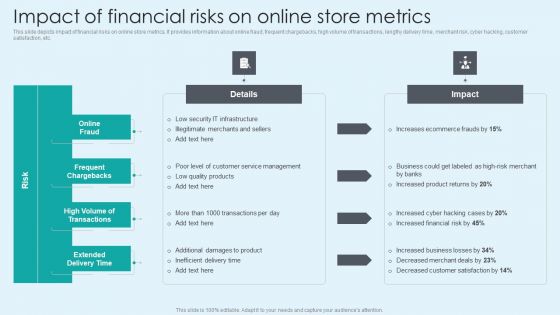
Impact Of Financial Risks On Online Store Metrics Summary PDF
This slide depicts impact of financial risks on online store metrics. It provides information about online fraud, frequent chargebacks, high volume of transactions, lengthy delivery time, merchant risk, cyber hacking, customer satisfaction, etc. Formulating a presentation can take up a lot of effort and time, so the content and message should always be the primary focus. The visuals of the PowerPoint can enhance the presenters message, so our Impact Of Financial Risks On Online Store Metrics Summary PDF was created to help save time. Instead of worrying about the design, the presenter can concentrate on the message while our designers work on creating the ideal templates for whatever situation is needed. Slidegeeks has experts for everything from amazing designs to valuable content, we have put everything into Impact Of Financial Risks On Online Store Metrics Summary PDF.

Implementing Succession Planning Succession Plan Evaluation Metrics Topics PDF
Following slide portrays different metrics to evaluate succession planning program. Metrics included in the slide are fulfillment percentage, ready pool, retention rate of HIPO, positions covered, number of HIPO promoted and number of successor. Welcome to our selection of the Implementing Succession Planning Succession Plan Evaluation Metrics Topics PDF. These are designed to help you showcase your creativity and bring your sphere to life. Planning and Innovation are essential for any business that is just starting out. This collection contains the designs that you need for your everyday presentations. All of our PowerPoints are 100 percent editable, so you can customize them to suit your needs. This multi-purpose template can be used in various situations. Grab these presentation templates today.
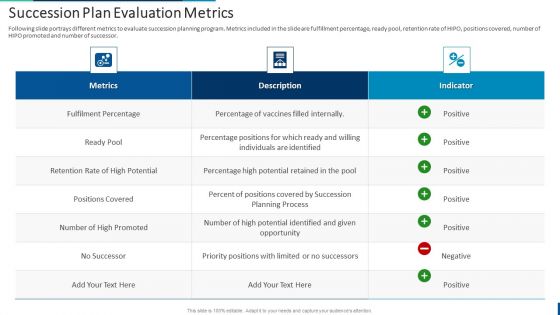
Internal Employee Succession Succession Plan Evaluation Metrics Information PDF
Following slide portrays different metrics to evaluate succession planning program. Metrics included in the slide are fulfillment percentage, ready pool, retention rate of HIPO, positions covered, number of HIPO promoted and number of successor. Welcome to our selection of the Internal Employee Succession Succession Plan Evaluation Metrics Information PDF. These are designed to help you showcase your creativity and bring your sphere to life. Planning and Innovation are essential for any business that is just starting out. This collection contains the designs that you need for your everyday presentations. All of our PowerPoints are 100 percent editable, so you can customize them to suit your needs. This multi-purpose template can be used in various situations. Grab these presentation templates today.
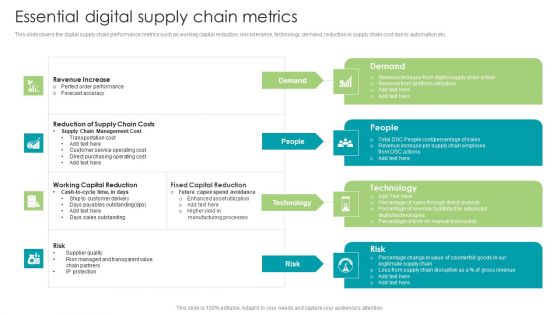
Robotic Process Automation Essential Digital Supply Chain Metrics Diagrams PDF
This slide covers the digital supply chain performance metrics such as working capital reduction, risk tolerance, technology, demand, reduction in supply chain cost due to automation etc. Explore a selection of the finest Robotic Process Automation Essential Digital Supply Chain Metrics Diagrams PDF here. With a plethora of professionally designed and pre-made slide templates, you can quickly and easily find the right one for your upcoming presentation. You can use our Robotic Process Automation Essential Digital Supply Chain Metrics Diagrams PDF to effectively convey your message to a wider audience. Slidegeeks has done a lot of research before preparing these presentation templates. The content can be personalized and the slides are highly editable. Grab templates today from Slidegeeks.
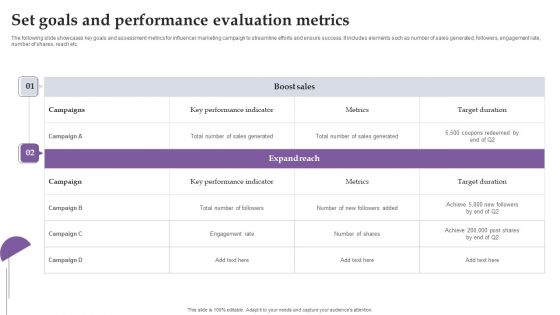
Set Goals And Performance Evaluation Metrics Ppt Professional Master Slide
The following slide showcases key goals and assessment metrics for influencer marketing campaign to streamline efforts and ensure success. It includes elements such as number of sales generated, followers, engagement rate, number of shares, reach etc. Do you have an important presentation coming up Are you looking for something that will make your presentation stand out from the rest Look no further than Set Goals And Performance Evaluation Metrics Ppt Professional Master Slide. With our professional designs, you can trust that your presentation will pop and make delivering it a smooth process. And with Slidegeeks, you can trust that your presentation will be unique and memorable. So why wait Grab Set Goals And Performance Evaluation Metrics Ppt Professional Master Slide today and make your presentation stand out from the rest
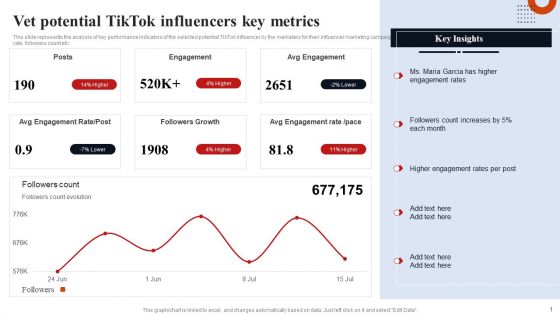
Vet Potential Tiktok Influencers Key Metrics Template PDF
This slide represents the analysis of key performance indicators of the selected potential TikTok influencer by the marketers for their influencer marketing campaign. It includes details related to key metrics such as engagement rate, followers count etc. Explore a selection of the finest Vet Potential Tiktok Influencers Key Metrics Template PDF here. With a plethora of professionally designed and pre made slide templates, you can quickly and easily find the right one for your upcoming presentation. You can use our Vet Potential Tiktok Influencers Key Metrics Template PDF to effectively convey your message to a wider audience. Slidegeeks has done a lot of research before preparing these presentation templates. The content can be personalized and the slides are highly editable. Grab templates today from Slidegeeks.
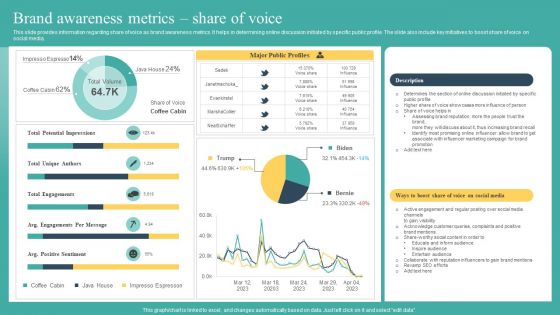
Brand Awareness Metrics Share Of Voice Ppt Infographics Show PDF
This slide provides information regarding share of voice as brand awareness metrics. It helps in determining online discussion initiated by specific public profile. The slide also include key initiatives to boost share of voice on social media. Here you can discover an assortment of the finest PowerPoint and Google Slides templates. With these templates, you can create presentations for a variety of purposes while simultaneously providing your audience with an eye catching visual experience. Download Brand Awareness Metrics Share Of Voice Ppt Infographics Show PDF to deliver an impeccable presentation. These templates will make your job of preparing presentations much quicker, yet still, maintain a high level of quality. Slidegeeks has experienced researchers who prepare these templates and write high quality content for you. Later on, you can personalize the content by editing the Brand Awareness Metrics Share Of Voice Ppt Infographics Show PDF.
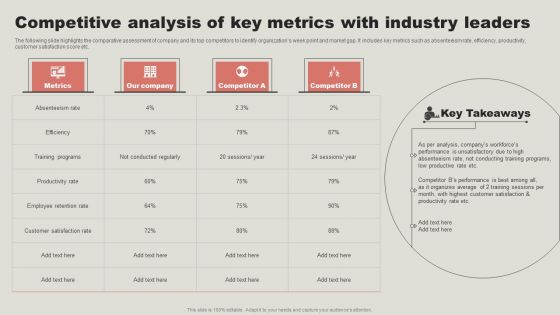
Competitive Analysis Of Key Metrics With Industry Leaders Structure PDF
The following slide highlights the comparative assessment of company and its top competitors to identify organizations week point and market gap. It includes key metrics such as absenteeism rate, efficiency, productivity, customer satisfaction score etc. Here you can discover an assortment of the finest PowerPoint and Google Slides templates. With these templates, you can create presentations for a variety of purposes while simultaneously providing your audience with an eye catching visual experience. Download Competitive Analysis Of Key Metrics With Industry Leaders Structure PDF to deliver an impeccable presentation. These templates will make your job of preparing presentations much quicker, yet still, maintain a high level of quality. Slidegeeks has experienced researchers who prepare these templates and write high quality content for you. Later on, you can personalize the content by editing the Competitive Analysis Of Key Metrics With Industry Leaders Structure PDF.

KPI Metrics Dashboard Highlighting Employee Retention Rate Structure PDF
The purpose of this slide is to exhibit a key performance indicator KPI dashboard through which managers can analyze the monthly employee retention rate. The metrics covered in the slide are active employees, new candidates hired, internal, exit, employee turnover rate, etc. Do you have to make sure that everyone on your team knows about any specific topic I yes, then you should give KPI Metrics Dashboard Highlighting Employee Retention Rate Structure PDF a try. Our experts have put a lot of knowledge and effort into creating this impeccable KPI Metrics Dashboard Highlighting Employee Retention Rate Structure PDF. You can use this template for your upcoming presentations, as the slides are perfect to represent even the tiniest detail. You can download these templates from the Slidegeeks website and these are easy to edit. So grab these today.
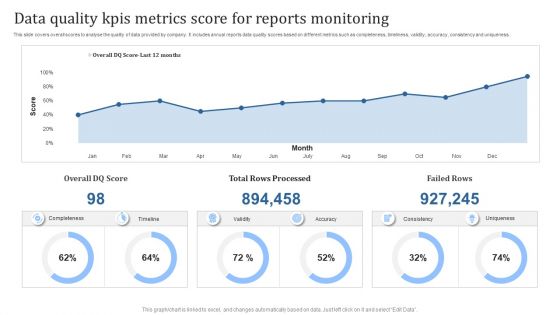
Data Quality Kpis Metrics Score For Reports Monitoring Download PDF
This slide covers overall scores to analyse the quality of data provided by company. It includes annual reports data quality scores based on different metrics such as completeness, timeliness, validity, accuracy, consistency and uniqueness. Showcasing this set of slides titled Data Quality Kpis Metrics Score For Reports Monitoring Download PDF. The topics addressed in these templates are Total Rows Processed, Failed Rows. All the content presented in this PPT design is completely editable. Download it and make adjustments in color, background, font etc. as per your unique business setting.
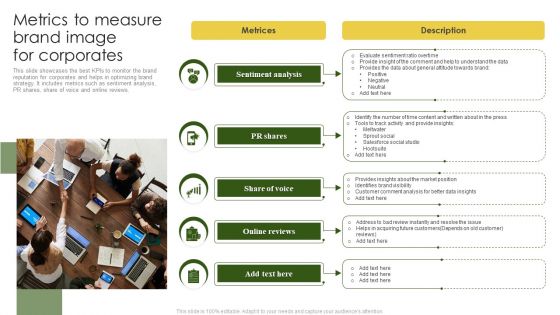
Metrics To Measure Brand Image For Corporates Professional PDF
This slide showcases the best KPIs to monitor the brand reputation for corporates and helps in optimizing brand strategy. It includes metrics such as sentiment analysis, PR shares, share of voice and online reviews. Persuade your audience using this Metrics To Measure Brand Image For Corporates Professional PDF. This PPT design covers Five stages, thus making it a great tool to use. It also caters to a variety of topics including Sentiment Analysis, Share Of Voice, Online Reviews. Download this PPT design now to present a convincing pitch that not only emphasizes the topic but also showcases your presentation skills.
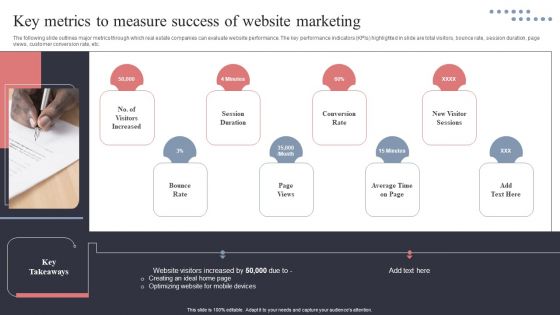
Key Metrics To Measure Success Of Website Marketing Elements PDF
The following slide outlines major metrics through which real estate companies can evaluate website performance. The key performance indicators KPIs highlighted in slide are total visitors, bounce rate, session duration, page views, customer conversion rate, etc. If your project calls for a presentation, then Slidegeeks is your go-to partner because we have professionally designed, easy-to-edit templates that are perfect for any presentation. After downloading, you can easily edit Key Metrics To Measure Success Of Website Marketing Elements PDF and make the changes accordingly. You can rearrange slides or fill them with different images. Check out all the handy templates
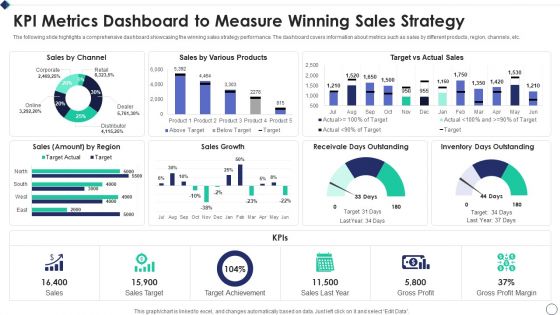
KPI Metrics Dashboard To Measure Winning Sales Strategy Ideas PDF
The following slide highlights a comprehensive dashboard showcasing the winning sales strategy performance. The dashboard covers information about metrics such as sales by different products, region, channels, etc.Showcasing this set of slides titled KPI Metrics Dashboard To Measure Winning Sales Strategy Ideas PDF The topics addressed in these templates are Sales By Channel, Various Products, Inventory Outstanding All the content presented in this PPT design is completely editable. Download it and make adjustments in color, background, font etc. as per your unique business setting.
Tools For Customer Service Metrics Measurement And Tracking Download PDF
This slide showcases tools that can help to measure and track the customer service metrics. Its key components are tools, features, free trial, paid version and user reviews. Persuade your audience using this Tools For Customer Service Metrics Measurement And Tracking Download PDF. This PPT design covers four stages, thus making it a great tool to use. It also caters to a variety of topics including Data Visualization, Custom Reports, Goal Tracking. Download this PPT design now to present a convincing pitch that not only emphasizes the topic but also showcases your presentation skills.

Playbook To Formulate Efficient Web Performance Measurement Metrics Diagrams PDF
Mentioned slide shows the major key performance indicators used by organizations to measure their website performance. Metrics covered are related to organic traffic, inbound leads, bounce rate. Slidegeeks has constructed Playbook To Formulate Efficient Web Performance Measurement Metrics Diagrams PDF after conducting extensive research and examination. These presentation templates are constantly being generated and modified based on user preferences and critiques from editors. Here, you will find the most attractive templates for a range of purposes while taking into account ratings and remarks from users regarding the content. This is an excellent jumping-off point to explore our content and will give new users an insight into our top-notch PowerPoint Templates.
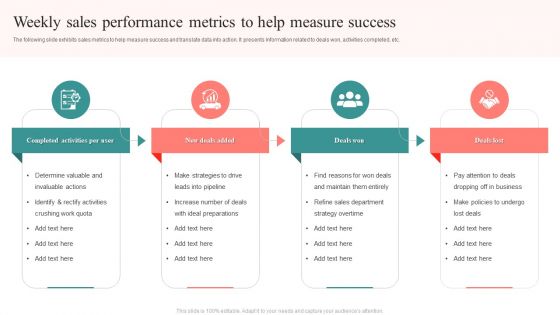
Weekly Sales Performance Metrics To Help Measure Success Ideas PDF
The following slide exhibits sales metrics to help measure success and translate data into action. It presents information related to deals won, activities completed, etc. Persuade your audience using this Weekly Sales Performance Metrics To Help Measure Success Ideas PDF. This PPT design covers four stages, thus making it a great tool to use. It also caters to a variety of topics including Completed Activities, Per User, New Deals Added, Deals Won, Deals Lost. Download this PPT design now to present a convincing pitch that not only emphasizes the topic but also showcases your presentation skills.
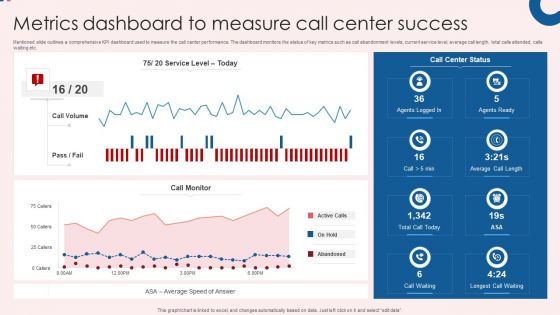
Metrics Dashboard To Measure Call Center Success Themes PDF
Mentioned slide outlines a comprehensive KPI dashboard used to measure the call center performance. The dashboard monitors the status of key metrics such as call abandonment levels, current service level, average call length, total calls attended, calls waiting etc. Showcasing this set of slides titled Metrics Dashboard To Measure Call Center Success Themes PDF. The topics addressed in these templates are Center Success, Call Center Status, Call Monitor. All the content presented in this PPT design is completely editable. Download it and make adjustments in color, background, font etc. as per your unique business setting.
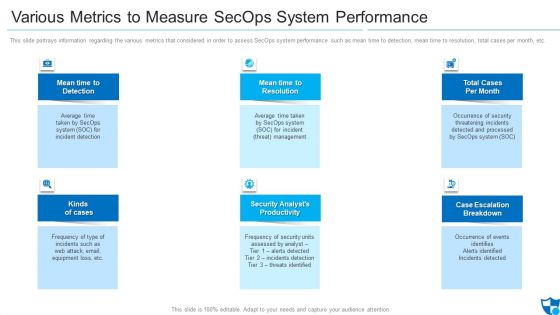
Various Metrics To Measure Secops System Performance Brochure PDF
This slide portrays information regarding the various metrics that considered in order to assess SecOps system performance such as mean time to detection, mean time to resolution, total cases per month, etc. This is a various metrics to measure secops system performance brochure pdf template with various stages. Focus and dispense information on six stages using this creative set, that comes with editable features. It contains large content boxes to add your information on topics like mean time to detection, mean time to resolution, total cases per month . You can also showcase facts, figures, and other relevant content using this PPT layout. Grab it now.

Ecommerce Operations Management Metrics To Measure Performance Professional PDF
This slide showcases essential metrics of e-commerce to make informed decisions. Major key performance indicators covered are website traffic, shopping cart abandonment rate, revenue per visitor and on time delivery rate. Presenting Ecommerce Operations Management Metrics To Measure Performance Professional PDF to dispense important information. This template comprises one stage. It also presents valuable insights into the topics including Abandonment Rate, Industry Benchmark, Performance. This is a completely customizable PowerPoint theme that can be put to use immediately. So, download it and address the topic impactfully.
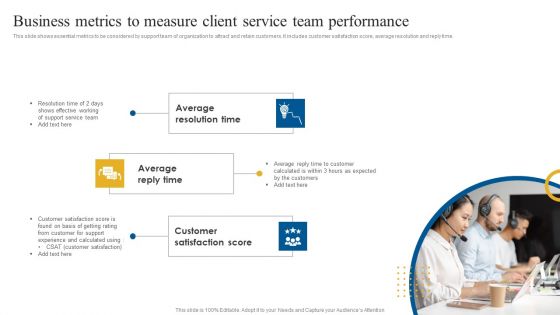
Business Metrics To Measure Client Service Team Performance Guidelines PDF
This slide shows essential metrics to be considered by support team of organization to attract and retain customers. It includes customer satisfaction score, average resolution and reply time. Presenting Business Metrics To Measure Client Service Team Performance Guidelines PDF to dispense important information. This template comprises three stages. It also presents valuable insights into the topics including Average Reply Time, Average Resolution Time, Customer Satisfaction Score. This is a completely customizable PowerPoint theme that can be put to use immediately. So, download it and address the topic impactfully.
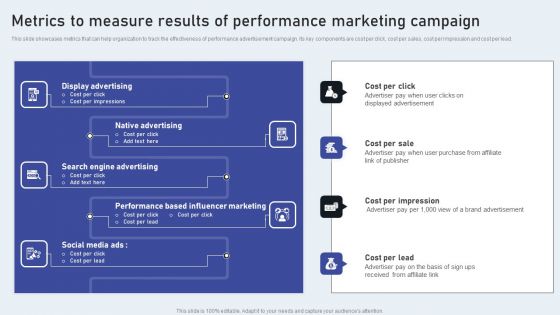
Metrics To Measure Results Of Performance Marketing Campaign Sample PDF
This slide showcases metrics that can help organization to track the effectiveness of performance advertisement campaign. Its key components are cost per click, cost per sales, cost per impression and cost per lead. Want to ace your presentation in front of a live audience Our Metrics To Measure Results Of Performance Marketing Campaign Sample PDF can help you do that by engaging all the users towards you. Slidegeeks experts have put their efforts and expertise into creating these impeccable powerpoint presentations so that you can communicate your ideas clearly. Moreover, all the templates are customizable, and easy-to-edit and downloadable. Use these for both personal and commercial use.
Agile Virtual Project Management Agile Performance Evaluation Metrics Icons PDF
This slide covers the metrics used by the organisation to measure agile capability on the basis of product performance, security level and user satisfaction Present like a pro with Agile Virtual Project Management Agile Performance Evaluation Metrics Icons PDF Create beautiful presentations together with your team, using our easy-to-use presentation slides. Share your ideas in real-time and make changes on the fly by downloading our templates. So whether youre in the office, on the go, or in a remote location, you can stay in sync with your team and present your ideas with confidence. With Slidegeeks presentation got a whole lot easier. Grab these presentations today.
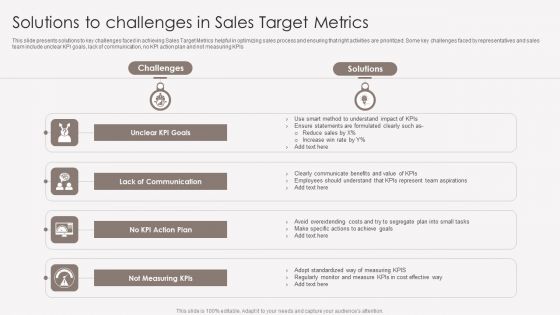
Solutions To Challenges In Sales Target Metrics Topics PDF
This slide presents solutions to key challenges faced in achieving Sales Target Metrics helpful in optimizing sales process and ensuring that right activities are prioritized. Some key challenges faced by representatives and sales team include unclear KPI goals, lack of communication, no KPI action plan and not measuring KPIs. Presenting Solutions To Challenges In Sales Target Metrics Topics PDF to dispense important information. This template comprises three stages. It also presents valuable insights into the topics including Lack Of Communication, Action Plan, Not Measuring. This is a completely customizable PowerPoint theme that can be put to use immediately. So, download it and address the topic impactfully.
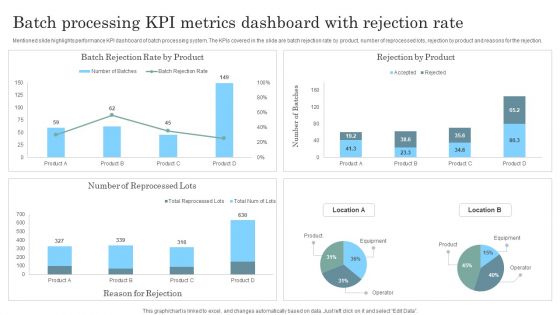
Batch Processing KPI Metrics Dashboard With Rejection Rate Topics PDF
Mentioned slide highlights performance KPI dashboard of batch processing system. The KPIs covered in the slide are batch rejection rate by product, number of reprocessed lots, rejection by product and reasons for the rejection. Pitch your topic with ease and precision using this Batch Processing KPI Metrics Dashboard With Rejection Rate Topics PDF. This layout presents information on Batch Processing KPI Metrics, Dashboard Rejection Rate. It is also available for immediate download and adjustment. So, changes can be made in the color, design, graphics or any other component to create a unique layout.
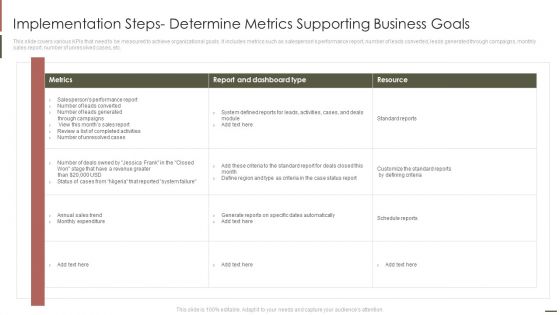
Implementation Steps Determine Metrics Supporting Business Goals Download PDF
This slide covers various KPIs that need to be measured to achieve organizational goals. It includes metrics such as salespersons performance report, number of leads converted, leads generated through campaigns, monthly sales report, number of unresolved cases, etc. Deliver an awe inspiring pitch with this creative Implementation Steps Determine Metrics Supporting Business Goals Download PDF bundle. Topics like Performance Report, Completed Activities, Customize Standard can be discussed with this completely editable template. It is available for immediate download depending on the needs and requirements of the user.

Implementation Steps Determine Metrics Supporting Business Goals Graphics PDF
This slide covers various KPIs that need to be measured to achieve organizational goals. It includes metrics such as salespersons performance report, number of leads converted, leads generated through campaigns, monthly sales report, number of unresolved cases, etc. Deliver an awe inspiring pitch with this creative Implementation Steps Determine Metrics Supporting Business Goals Graphics PDF bundle. Topics like Generate Reports, Salespersons Performance, Report Dashboard can be discussed with this completely editable template. It is available for immediate download depending on the needs and requirements of the user.
KPI Metrics For SQA Ppt PowerPoint Presentation Icon Deck PDF
This slide shows the KPI metrics which can be used by an organization to measure the software quality. It includes passed test defects fixed per day, Average time to test, quality ratio, etc. Showcasing this set of slides titled KPI Metrics For SQA Ppt PowerPoint Presentation Icon Deck PDF. The topics addressed in these templates are Quality Ratio, Kpis, Passed Tests. All the content presented in this PPT design is completely editable. Download it and make adjustments in color, background, font etc. as per your unique business setting.

Lead Generation Digital Promotion Success Metrics Portrait PDF
The slide highlights the KPIs to measure success rate of the lead generation campaign for predicting future sales. Various metrics included are marketing qualified leads, sales and time on site. Persuade your audience using this Lead Generation Digital Promotion Success Metrics Portrait PDF. This PPT design covers Three stages, thus making it a great tool to use. It also caters to a variety of topics including Marketing Qualified Leads, Sales. Download this PPT design now to present a convincing pitch that not only emphasizes the topic but also showcases your presentation skills.

SMART Goal Metrics For Maintenance Framework Inspiration PDF
The following slide showcases the SMART maintenance KPIs to achieve and improve goals. It includes metrics such as reducing downtime, optimizing labor time, achieving inventory precision, decreasing power consumption, lowering rework requests etc. Persuade your audience using this SMART Goal Metrics For Maintenance Framework Inspiration PDF. This PPT design covers five stages, thus making it a great tool to use. It also caters to a variety of topics including Specific, Measurable, Attainable, Realistic, Timely. Download this PPT design now to present a convincing pitch that not only emphasizes the topic but also showcases your presentation skills.
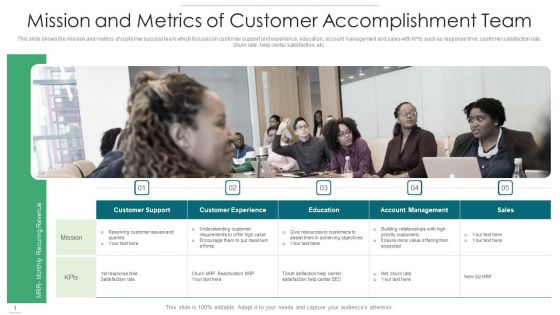
Mission And Metrics Of Customer Accomplishment Team Demonstration PDF
This slide shows the mission and metrics of customer success team which focuses on customer support and experience, education, account management and sales with KPIs such as response time, customer satisfaction rate, churn rate, help center satisfaction, etc. Presenting mission and metrics of customer accomplishment team demonstration pdf to dispense important information. This template comprises five stages. It also presents valuable insights into the topics including customer support, customer experience, education, account management, sales. This is a completely customizable PowerPoint theme that can be put to use immediately. So, download it and address the topic impactfully.
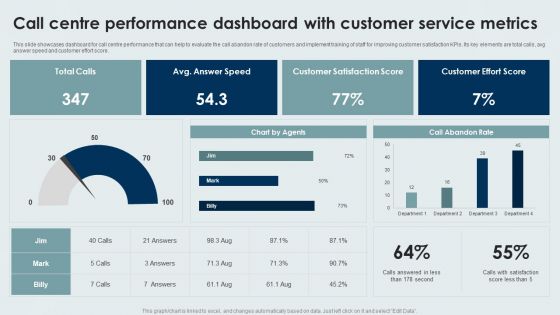
Call Centre Performance Dashboard With Customer Service Metrics Background PDF
This slide showcases dashboard for call centre performance that can help to evaluate the call abandon rate of customers and implement training of staff for improving customer satisfaction KPIs. Its key elements are total calls, avg answer speed and customer effort score. Showcasing this set of slides titled Call Centre Performance Dashboard With Customer Service Metrics Background PDF. The topics addressed in these templates are Call Centre Performance Dashboard, Customer Service Metrics. All the content presented in this PPT design is completely editable. Download it and make adjustments in color, background, font etc. as per your unique business setting.
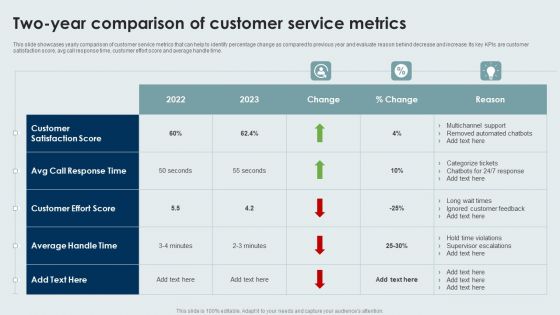
Two Year Comparison Of Customer Service Metrics Information PDF
This slide showcases yearly comparison of customer service metrics that can help to identify percentage change as compared to previous year and evaluate reason behind decrease and increase. Its key KPIs are customer satisfaction score, avg call response time, customer effort score and average handle time. Pitch your topic with ease and precision using this Two Year Comparison Of Customer Service Metrics Information PDF. This layout presents information on Customer Effort Score, Customer Satisfaction Score, Average Handle Time. It is also available for immediate download and adjustment. So, changes can be made in the color, design, graphics or any other component to create a unique layout.
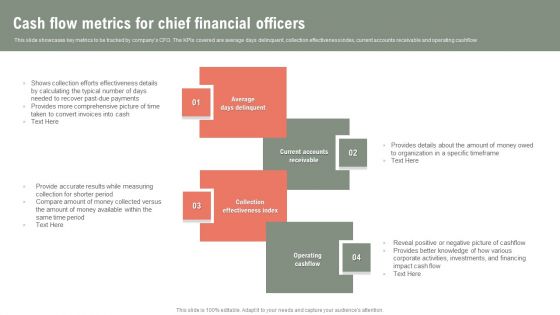
Cash Flow Metrics For Chief Financial Officers Ppt Sample PDF
This slide showcases key metrics to be tracked by companys CFO. The KPIs covered are average days delinquent, collection effectiveness index, current accounts receivable and operating cashflow. Presenting Cash Flow Metrics For Chief Financial Officers Ppt Sample PDF to dispense important information. This template comprises four stages. It also presents valuable insights into the topics including Average Days Delinquent, Current Accounts Receivable, Collection Effectiveness Index. This is a completely customizable PowerPoint theme that can be put to use immediately. So, download it and address the topic impactfully.
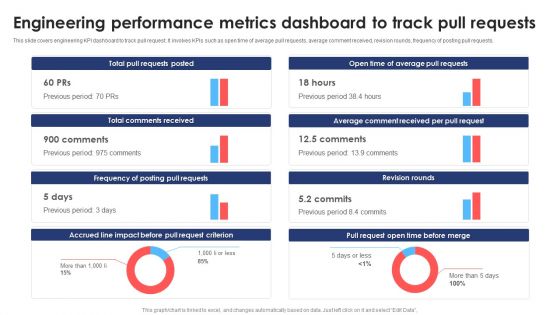
Engineering Performance Metrics Dashboard To Track Pull Requests Background PDF
This slide covers engineering KPI dashboard to track pull request. It involves KPIs such as open time of average pull requests, average comment received, revision rounds, frequency of posting pull requests. Pitch your topic with ease and precision using this Engineering Performance Metrics Dashboard To Track Pull Requests Background PDF. This layout presents information on Dashboard Track Pull Requests, Engineering Performance Metrics. It is also available for immediate download and adjustment. So, changes can be made in the color, design, graphics or any other component to create a unique layout.
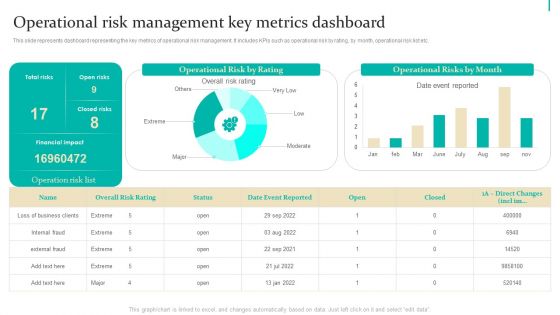
Enterprise Risk Management Operational Risk Management Key Metrics Inspiration PDF
This slide represents dashboard representing the key metrics of operational risk management. It includes KPIs such as operational risk by rating, by month, operational risk list etc. Boost your pitch with our creative Enterprise Risk Management Operational Risk Management Key Metrics Inspiration PDF. Deliver an awe-inspiring pitch that will mesmerize everyone. Using these presentation templates you will surely catch everyones attention. You can browse the ppts collection on our website. We have researchers who are experts at creating the right content for the templates. So you dont have to invest time in any additional work. Just grab the template now and use them.
Monthly Shipping And Inventory Tracking Metrics Tracker Icons PDF
This slide displays the KPI tracker for identifying the shipment, inventory, and fleet maintenance status. It also includes KPIs such as on-time delivery, on-time departure, inventory age, inventory cycle, etc. Showcasing this set of slides titled Monthly Shipping And Inventory Tracking Metrics Tracker Icons PDF. The topics addressed in these templates are Minimum Standard, Level Agreement, Metrics Tracker. All the content presented in this PPT design is completely editable. Download it and make adjustments in color, background, font etc. as per your unique business setting.
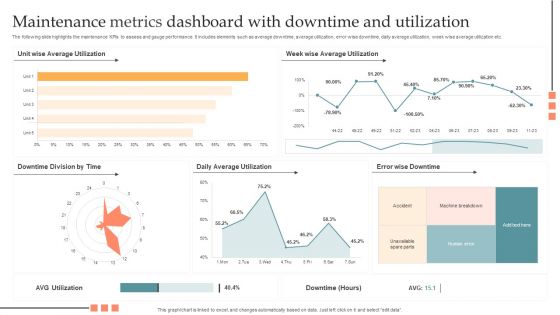
Maintenance Metrics Dashboard With Downtime And Utilization Pictures PDF
The following slide highlights the maintenance KPIs to assess and gauge performance. It includes elements such as average downtime, average utilization, error wise downtime, daily average utilization, week wise average utilization etc. Showcasing this set of slides titled Maintenance Metrics Dashboard With Downtime And Utilization Pictures PDF. The topics addressed in these templates are Maintenance Metrics Dashboard, Downtime And Utilization. All the content presented in this PPT design is completely editable. Download it and make adjustments in color, background, font etc. as per your unique business setting.
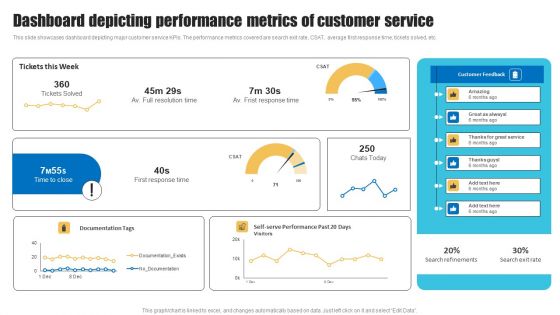
Dashboard Depicting Performance Metrics Of Customer Service Template PDF
This slide showcases dashboard depicting major customer service KPIs. The performance metrics covered are search exit rate, CSAT, average first response time, tickets solved, etc. Take your projects to the next level with our ultimate collection of Dashboard Depicting Performance Metrics Of Customer Service Template PDF. Slidegeeks has designed a range of layouts that are perfect for representing task or activity duration, keeping track of all your deadlines at a glance. Tailor these designs to your exact needs and give them a truly corporate look with your own brand colors they will make your projects stand out from the rest.

Commodity Bundle Costing Metrics For Brands Structure PDF
This slide presents key metrics to be tracked by brands using product bundle pricing, helpful in monitoring effectiveness od strategy and overall profits. It includes average order value, best and least performing bundles, annual growth and comparison of sales. Presenting Commodity Bundle Costing Metrics For Brands Structure PDF to dispense important information. This template comprises four stages. It also presents valuable insights into the topics including AOV, Best Least Performing Bundles, Annual Growth Of Product, Comparison Sales Positive Reception. This is a completely customizable PowerPoint theme that can be put to use immediately. So, download it and address the topic impactfully.

Social Network Promotion Campaign Metrics Ppt Portfolio Outline PDF
This slide outlines the measurement of specified goals to assess the impact of social media activities on marketing campaigns and to capture customer growth. The various measured goals are awareness, client engagement, conversion rate, and brand recognition. Showcasing this set of slides titled Social Network Promotion Campaign Metrics Ppt Portfolio Outline PDF. The topics addressed in these templates are Business Objective, Social Media Goal, Metrics. All the content presented in this PPT design is completely editable. Download it and make adjustments in color, background, font etc. as per your unique business setting.

Internal Audit Key Performance Indicators Metrics Inspiration PDF
This slide depicts the internal audit key performance indicator KPI metrics. It includes information related to the measures and its achievement. Persuade your audience using this Internal Audit Key Performance Indicators Metrics Inspiration PDF. This PPT design covers two stages, thus making it a great tool to use. It also caters to a variety of topics including Measures, Achievement, Audit Findings Percentage. Download this PPT design now to present a convincing pitch that not only emphasizes the topic but also showcases your presentation skills.
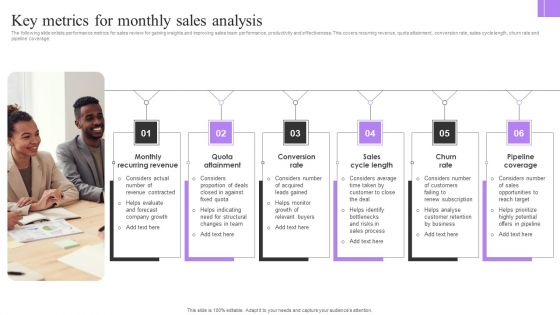
Key Metrics For Monthly Sales Analysis Mockup PDF
The following slide enlists performance metrics for sales review for gaining insights and improving sales team performance, productivity and effectiveness. This covers recurring revenue, quota attainment, conversion rate, sales cycle length, churn rate and pipeline coverage. Presenting Key Metrics For Monthly Sales Analysis Mockup PDF to dispense important information. This template comprises six stages. It also presents valuable insights into the topics including Monthly Recurring Revenue, Quota Attainment, Conversion Rate . This is a completely customizable PowerPoint theme that can be put to use immediately. So, download it and address the topic impactfully.

Metrics To Track Employee Engagement And Coordination Background PDF
The following slide outlines metrics to track employee collaboration aimed at motivating employee productivity for resolving issues and boost engagement. It covers turnover rate, retention rate, net promoter score, employee performance and workload balance. Persuade your audience using this Metrics To Track Employee Engagement And Coordination Background PDF. This PPT design covers six stages, thus making it a great tool to use. It also caters to a variety of topics including Turnover Rate, Employee Performance, Retention Rate. Download this PPT design now to present a convincing pitch that not only emphasizes the topic but also showcases your presentation skills.
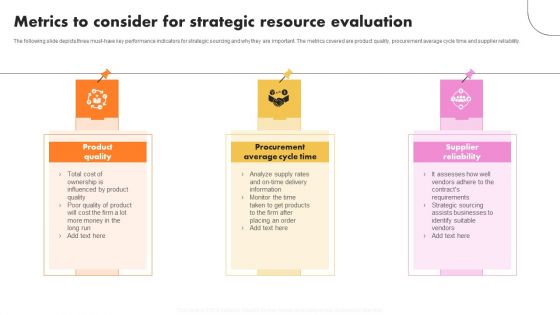
Metrics To Consider For Strategic Resource Evaluation Graphics PDF
The following slide depicts three must-have key performance indicators for strategic sourcing and why they are important. The metrics covered are product quality, procurement average cycle time and supplier reliability. Presenting Metrics To Consider For Strategic Resource Evaluation Graphics PDF to dispense important information. This template comprises three stages. It also presents valuable insights into the topics including Product Quality, Procurement Average Cycle Time, Supplier Reliability. This is a completely customizable PowerPoint theme that can be put to use immediately. So, download it and address the topic impactfully.

Commodity Adoption Metrics For Technique Development Microsoft PDF
This slide highlights various key performance indicators to identify product adoption rate for user acquisition strategy development. It includes key metrics such as net promoter score, client retention rate, active user percentage, customer lifetime value and churn rate. Presenting Commodity Adoption Metrics For Technique Development Microsoft PDF to dispense important information. This template comprises four stages. It also presents valuable insights into the topics including Build Customer, Onboarding Process, Analysis. This is a completely customizable PowerPoint theme that can be put to use immediately. So, download it and address the topic impactfully.

Current Team Performance Using Velocity Metrics Graphics PDF
This slide depicts the current performance of the team through a graph that shows the committed work to be done and the actual work that has been done. The tasks have been divided into various sprints and performance is measured in story points. Deliver and pitch your topic in the best possible manner with this current team performance using velocity metrics graphics pdf. Use them to share invaluable insights on current team performance using velocity metrics and impress your audience. This template can be altered and modified as per your expectations. So, grab it now.

Current Team Performance Using Velocity Metrics Clipart PDF
This slide depicts the current performance of the team through a graph that shows the committed work to be done and the actual work that has been done. The tasks have been divided into various sprints and performance is measured in story points. Deliver an awe-inspiring pitch with this creative current team performance using velocity metrics clipart pdf bundle. Topics like current team performance using velocity metrics can be discussed with this completely editable template. It is available for immediate download depending on the needs and requirements of the user.
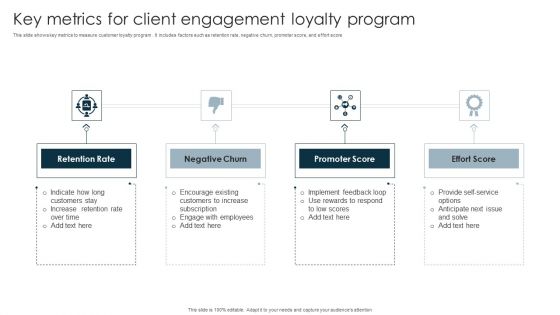
Key Metrics For Client Engagement Loyalty Program Microsoft PDF
This slide shows key metrics to measure customer loyalty program . It includes factors such as retention rate, negative churn, promoter score, and effort score. Persuade your audience using this Key Metrics For Client Engagement Loyalty Program Microsoft PDF. This PPT design covers four stages, thus making it a great tool to use. It also caters to a variety of topics including Retention Rate, Negative Churn, Promoter Score, Effort Score. Download this PPT design now to present a convincing pitch that not only emphasizes the topic but also showcases your presentation skills.
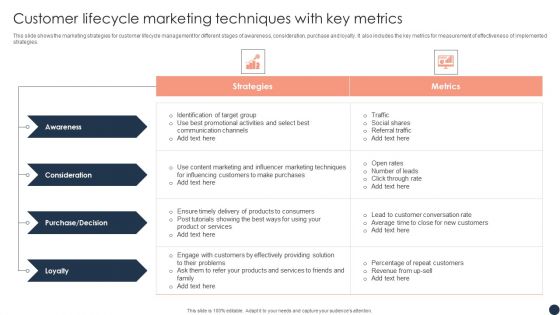
Customer Lifecycle Marketing Techniques With Key Metrics Topics PDF
This slide shows the marketing strategies for customer lifecycle management for different stages of awareness, consideration, purchase and loyalty. It also includes the key metrics for measurement of effectiveness of implemented strategies. Showcasing this set of slides titled Customer Lifecycle Marketing Techniques With Key Metrics Topics PDF. The topics addressed in these templates are Consideration, Awareness, Purchase. All the content presented in this PPT design is completely editable. Download it and make adjustments in color, background, font etc. as per your unique business setting.
Performance Tracking Metrics Of Marketing Return On Investment Graphics PDF
This slide shows various key performance indicators to measure performance of marketing ROI. It includes metrics such as unique monthly visitors, cost per lead, return on ad spend, average order value, etc. Showcasing this set of slides titled Performance Tracking Metrics Of Marketing Return On Investment Graphics PDF. The topics addressed in these templates are Cost Per Lead, Customer Lifetime Value, Unique Monthly Visitors. All the content presented in this PPT design is completely editable. Download it and make adjustments in color, background, font etc. as per your unique business setting.

Call Center Metrics Dashboard With Average Response Time Inspiration PDF
Mentioned slide outlines KPI dashboard which can be used by call center to measure the performance of their agents. The key metrics highlighted in the dashboard are first call resolution, daily abandonment rate, total number of calls by topic, top performing call agents etc. Showcasing this set of slides titled Call Center Metrics Dashboard With Average Response Time Inspiration PDF. The topics addressed in these templates are Efficiency, Quality, Activity, Daily Average Response, Daily Average Transfer. All the content presented in this PPT design is completely editable. Download it and make adjustments in color, background, font etc. as per your unique business setting.

Step 8 Event Management Performance Evaluation Metrics Themes PDF
This slide showcases the key metrics that are tracked to measure event success. The indicators covered are registration trends, post survey responses, cost per attendee, NPS and conversion rate. Take your projects to the next level with our ultimate collection of Step 8 Event Management Performance Evaluation Metrics Themes PDF. Slidegeeks has designed a range of layouts that are perfect for representing task or activity duration, keeping track of all your deadlines at a glance. Tailor these designs to your exact needs and give them a truly corporate look with your own brand colors they will make your projects stand out from the rest
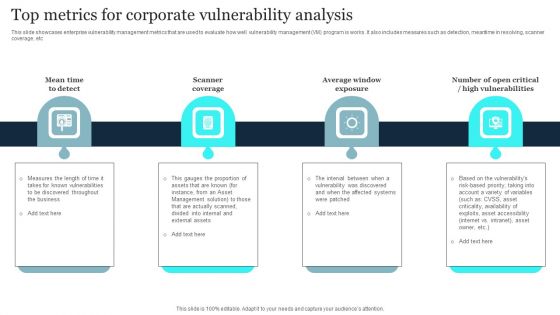
Top Metrics For Corporate Vulnerability Analysis Diagrams PDF
This slide showcases enterprise vulnerability management metrics that are used to evaluate how well vulnerability management VM program is works. It also includes measures such as detection, meantime in resolving, scanner coverage, etc. Presenting Top Metrics For Corporate Vulnerability Analysis Diagrams PDF to dispense important information. This template comprises four stages. It also presents valuable insights into the topics including Scanner Coverage, Average Window Exposure, High Vulnerabilities. This is a completely customizable PowerPoint theme that can be put to use immediately. So, download it and address the topic impactfully.

Dashboards Showing Consultancy Company Performance With Key Metrics Microsoft PDF
This slide shows the dashboard related to consultancy company performance which includes budget preparation, sales and goals. Company profits and goals etc.Presenting dashboards showing consultancy company performance with key metrics microsoft pdf to provide visual cues and insights. Share and navigate important information on four stages that need your due attention. This template can be used to pitch topics like dashboards showing consultancy company performance with key metrics. In addtion, this PPT design contains high resolution images, graphics, etc, that are easily editable and available for immediate download.

Devops Business Performance Metrics Ppt Slides Inspiration PDF
This template covers metrics for evaluation of devOps performance on each stage such as operational efficiency, service quality, service velocity, business performance etc. Presenting devops business performance metrics ppt slides inspiration pdf to provide visual cues and insights. Share and navigate important information on five stages that need your due attention. This template can be used to pitch topics like customer value, organizational, service, business performance. In addtion, this PPT design contains high resolution images, graphics, etc, that are easily editable and available for immediate download.
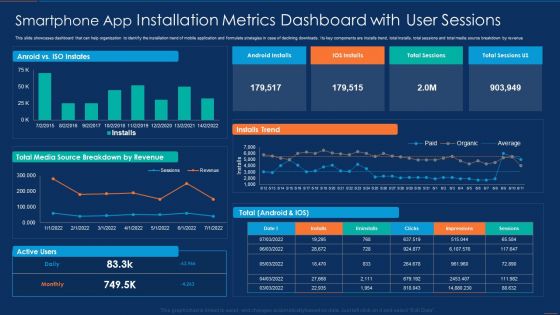
Smartphone App Installation Metrics Dashboard With User Sessions Microsoft PDF
This slide showcases dashboard that can help organization to identify the installation trend of mobile application and formulate strategies in case of declining downloads. Its key components are installs trend, total installs, total sessions and total media source breakdown by revenue. Pitch your topic with ease and precision using this Smartphone App Installation Metrics Dashboard With User Sessions Microsoft PDF. This layout presents information on Smartphone App Installation Metrics Dashboard With User Sessions. It is also available for immediate download and adjustment. So, changes can be made in the color, design, graphics or any other component to create a unique layout.

Comparing Logistics Performance Metrics With Competitors Topics PDF
This slide focuses on the comparison of logistics performance metrics with competitors on the basis of parameters such as shipping time, order accuracy, equipment utilization rate, etc.Presenting Comparing Logistics Performance Metrics With Competitors Topics PDF to provide visual cues and insights. Share and navigate important information on one stage that need your due attention. This template can be used to pitch topics like Equipment Utilization, Warehousing Costs, Transportation Costs In addtion, this PPT design contains high resolution images, graphics, etc, that are easily editable and available for immediate download.
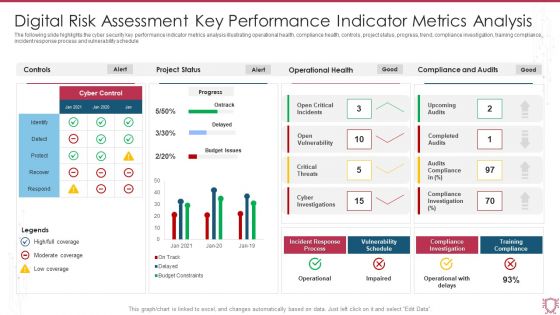
Digital Risk Assessment Key Performance Indicator Metrics Analysis Infographics PDF
The following slide highlights the cyber security key performance indicator metrics analysis illustrating operational health, compliance health, controls, project status, progress, trend, compliance investigation, training compliance, incident response process and vulnerability schedule. Showcasing this set of slides titled Digital Risk Assessment Key Performance Indicator Metrics Analysis Infographics PDF. The topics addressed in these templates are Project Status, Operational Health, Compliance And Audits. All the content presented in this PPT design is completely editable. Download it and make adjustments in color, background, font etc. as per your unique business setting.

Supply Chain Approaches Dashboard Depicting Supply Chain Metrics Background PDF
This slide shows the dashboard that depicts supply chain metrics such as total net sales, supply chain expenses, average cash to cash cycle in days, carrying costs of inventory, etc.Deliver and pitch your topic in the best possible manner with this Supply Chain Approaches Dashboard Depicting Supply Chain Metrics Background PDF. Use them to share invaluable insights on Supply Chain, Expenses Based Category, Chain Expenses and impress your audience. This template can be altered and modified as per your expectations. So, grab it now.
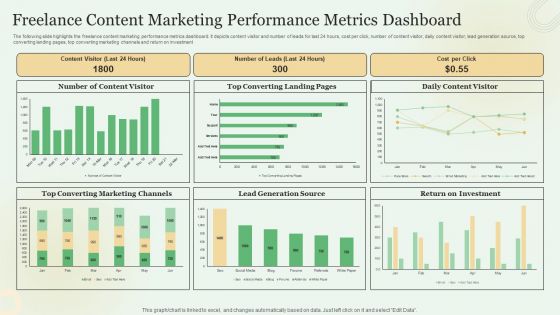
Freelance Content Marketing Performance Metrics Dashboard Elements PDF
The following slide highlights the freelance content marketing performance metrics dashboard. It depicts content visitor and number of leads for last 24 hours, cost per click, number of content visitor, daily content visitor, lead generation source, top converting landing pages, top converting marketing channels and return on investment. Showcasing this set of slides titled Freelance Content Marketing Performance Metrics Dashboard Elements PDF. The topics addressed in these templates are Lead Generation Source, Return On Investment, Converting Marketing Channels. All the content presented in this PPT design is completely editable. Download it and make adjustments in color, background, font etc. as per your unique business setting.
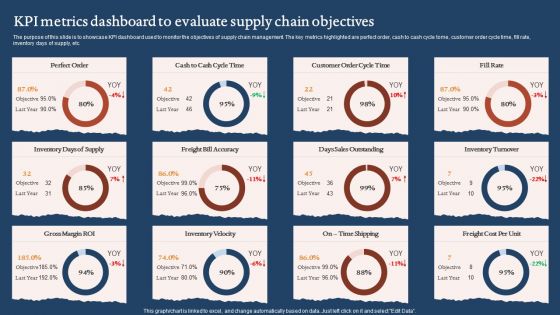
KPI Metrics Dashboard To Evaluate Supply Chain Objectives Graphics PDF
The purpose of this slide is to showcase KPI dashboard used to monitor the objectives of supply chain management. The key metrics highlighted are perfect order, cash to cash cycle tome, customer order cycle time, fill rate, inventory days of supply, etc. Pitch your topic with ease and precision using this KPI Metrics Dashboard To Evaluate Supply Chain Objectives Graphics PDF. This layout presents information on Days Sales Outstanding, Inventory Velocity, Gross Margin Roi. It is also available for immediate download and adjustment. So, changes can be made in the color, design, graphics or any other component to create a unique layout.

Effective Personal Job Assignment Monitoring Metrics Ppt Portfolio Samples PDF
The following slide highlights the effective workload monitoring metrics illustrating key headings which includes job assignment, work result, average work time, estimated work time, workload and efficiency. Pitch your topic with ease and precision using this Effective Personal Job Assignment Monitoring Metrics Ppt Portfolio Samples PDF. This layout presents information on Job Assignment, Work Result, Average Work Time. It is also available for immediate download and adjustment. So, changes can be made in the color, design, graphics or any other component to create a unique layout.
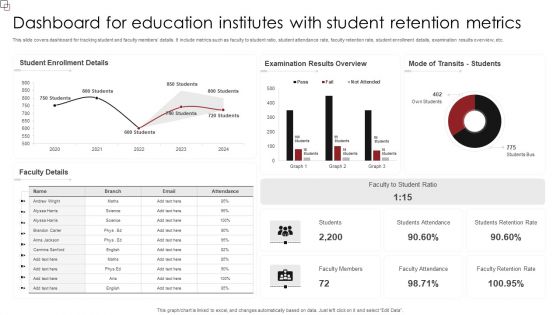
Dashboard For Education Institutes With Student Retention Metrics Slides PDF
This slide covers dashboard for tracking student and faculty members details. It include metrics such as faculty to student ratio, student attendance rate, faculty retention rate, student enrollment details, examination results overview, etc. Showcasing this set of slides titled Dashboard For Education Institutes With Student Retention Metrics Slides PDF. The topics addressed in these templates are Student Enrollment Details, Examination Results Overview, Faculty Student Ratio. All the content presented in this PPT design is completely editable. Download it and make adjustments in color, background, font etc. as per your unique business setting.
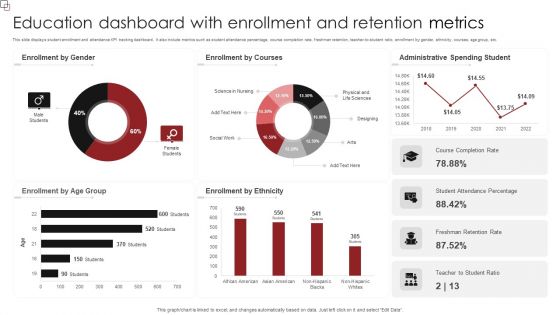
Education Dashboard With Enrollment And Retention Metrics Sample PDF
This slide displays student enrollment and attendance KPI tracking dashboard. It also include metrics such as student attendance percentage, course completion rate, freshman retention, teacher-to-student ratio, enrollment by gender, ethnicity, courses, age group, etc. Pitch your topic with ease and precision using this Education Dashboard With Enrollment And Retention Metrics Sample PDF. This layout presents information on Enrollment Gender, Enrollment Courses, Administrative Spending Student. It is also available for immediate download and adjustment. So, changes can be made in the color, design, graphics or any other component to create a unique layout.
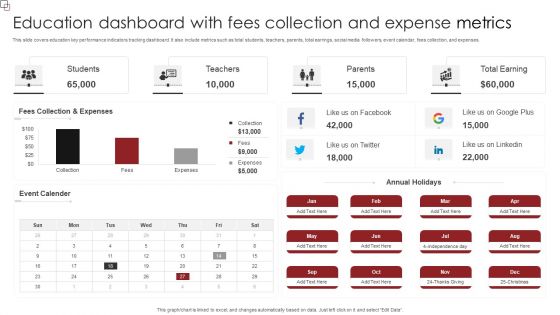
Education Dashboard With Fees Collection And Expense Metrics Demonstration PDF
This slide covers education key performance indicators tracking dashboard. It also include metrics such as total students, teachers, parents, total earrings, social media followers, event calendar, fees collection, and expenses. Showcasing this set of slides titled Education Dashboard With Fees Collection And Expense Metrics Demonstration PDF. The topics addressed in these templates are Event Calender, Annual Holidays, Fees Collection, Expenses. All the content presented in this PPT design is completely editable. Download it and make adjustments in color, background, font etc. as per your unique business setting.
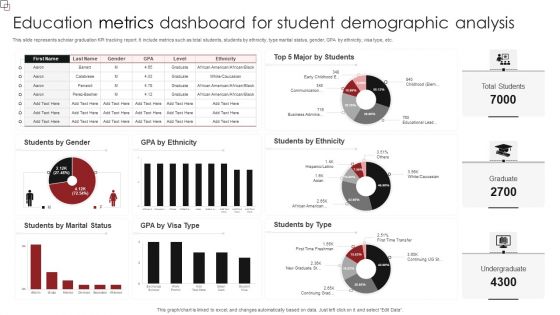
Education Metrics Dashboard For Student Demographic Analysis Diagrams PDF
This slide represents scholar graduation KPI tracking report. It include metrics such as total students, students by ethnicity, type marital status, gender, GPA by ethnicity, visa type, etc. Showcasing this set of slides titled Education Metrics Dashboard For Student Demographic Analysis Diagrams PDF. The topics addressed in these templates are Students Ethnicity, Students Type, Students Marital Status. All the content presented in this PPT design is completely editable. Download it and make adjustments in color, background, font etc. as per your unique business setting.

Education Metrics Dashboard With College Details Formats PDF
This slide showcases the education key performance indicator tracker. It also include metrics such as overall admissions, admissions out of state, person of colour, gender, goal achievement rate, admissions by college, number of women by college, etc. Pitch your topic with ease and precision using this Education Metrics Dashboard With College Details Formats PDF. This layout presents information on Overall Admissions, Person Of Color, Percent To Goal. It is also available for immediate download and adjustment. So, changes can be made in the color, design, graphics or any other component to create a unique layout.
Education Metrics Tracker For Students Performance Evaluation Professional PDF
This slide covers student performance analysis dashboard. It include metrics student count, student attendance, average subject score, branch examination results, student count by grade, etc. Showcasing this set of slides titled Education Metrics Tracker For Students Performance Evaluation Professional PDF. The topics addressed in these templates are Students Count, Grade And Gender, Students Details, Examination Results Branch. All the content presented in this PPT design is completely editable. Download it and make adjustments in color, background, font etc. as per your unique business setting.
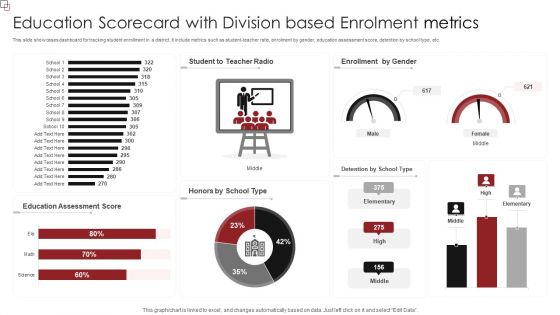
Education Scorecard With Division Based Enrolment Metrics Professional PDF
This slide showcases dashboard for tracking student enrollment in a district. It include metrics such as student-teacher ratio, enrolment by gender, education assessment score, detention by school type, etc. Pitch your topic with ease and precision using this Education Scorecard With Division Based Enrolment Metrics Professional PDF. This layout presents information on Education Assessment Score, Enrollment Gender. It is also available for immediate download and adjustment. So, changes can be made in the color, design, graphics or any other component to create a unique layout.
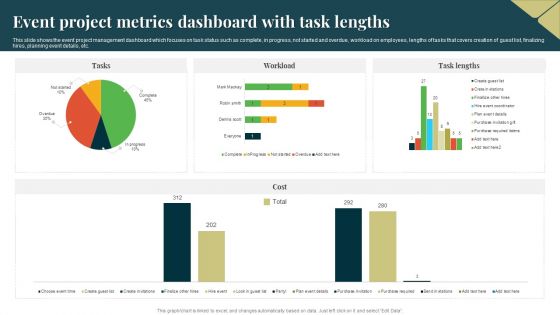
Event Project Metrics Dashboard With Task Lengths Template PDF
This slide shows the event project management dashboard which focuses on task status such as complete, in progress, not started and overdue, workload on employees, lengths of tasks that covers creation of guest list, finalizing hires, planning event details, etc. Showcasing this set of slides titled Event Project Metrics Dashboard With Task Lengths Template PDF. The topics addressed in these templates are Event Project Metrics Dashboard, Cost. All the content presented in this PPT design is completely editable. Download it and make adjustments in color, background, font etc. as per your unique business setting.
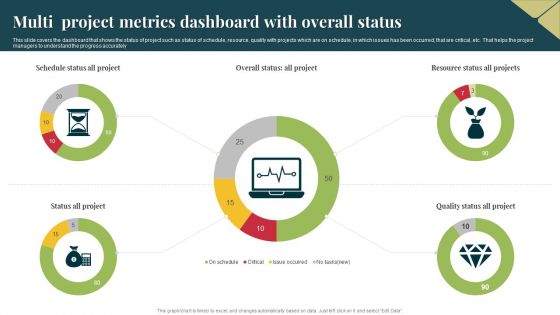
Multi Project Metrics Dashboard With Overall Status Pictures PDF
This slide covers the dashboard that shows the status of project such as status of schedule, resource, quality with projects which are on schedule, in which issues has been occurred, that are critical, etc. That helps the project managers to understand the progress accurately. Pitch your topic with ease and precision using this Multi Project Metrics Dashboard With Overall Status Pictures PDF. This layout presents information on Multi Project, Metrics Dashboard. It is also available for immediate download and adjustment. So, changes can be made in the color, design, graphics or any other component to create a unique layout.

Project Metrics Dashboard Depicting Issue Description Rules PDF
This slide focuses on the project management dashboard which covers the name of the company, department, project manager, statuses with tally, priorities using pie graph describing not started, in progress and closed projects and describes the issues such as timing, milestones, etc. Showcasing this set of slides titled Project Metrics Dashboard Depicting Issue Description Rules PDF. The topics addressed in these templates are Project Metrics, Dashboard Depicting. All the content presented in this PPT design is completely editable. Download it and make adjustments in color, background, font etc. as per your unique business setting.
Project Metrics Dashboard Depicting Tracking System Inspiration PDF
This slide focuses on project management dashboard which covers the four spirit teams, iteration defects by priority with quarterly roadmap with legends such as high attention, low, none, normal and resolved immediately with time in iteration, etc. Pitch your topic with ease and precision using this Project Metrics Dashboard Depicting Tracking System Inspiration PDF. This layout presents information on Project Metrics, Dashboard Depicting, Tracking System. It is also available for immediate download and adjustment. So, changes can be made in the color, design, graphics or any other component to create a unique layout.
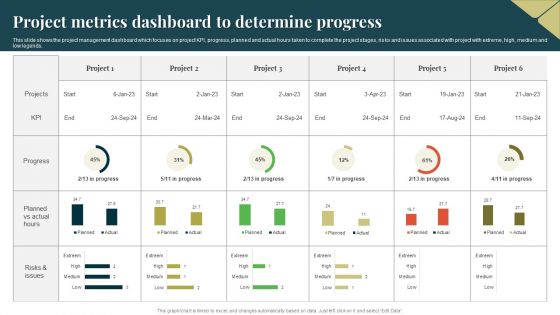
Project Metrics Dashboard To Determine Progress Guidelines PDF
This slide shows the project management dashboard which focuses on project KPI, progress, planned and actual hours taken to complete the project stages, risks and issues associated with project with extreme, high, medium and low legends. Showcasing this set of slides titled Project Metrics Dashboard To Determine Progress Guidelines PDF. The topics addressed in these templates are Project Metrics Dashboard, Determine Progress. All the content presented in this PPT design is completely editable. Download it and make adjustments in color, background, font etc. as per your unique business setting.
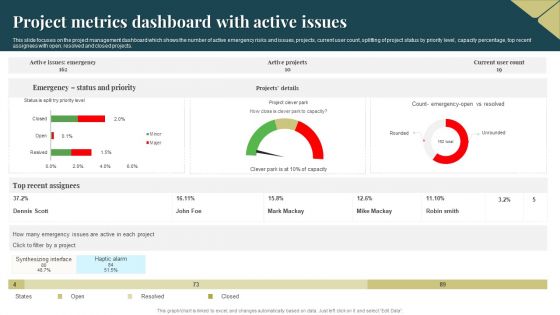
Project Metrics Dashboard With Active Issues Topics PDF
This slide focuses on the project management dashboard which shows the number of active emergency risks and issues, projects, current user count, splitting of project status by priority level, capacity percentage, top recent assignees with open, resolved and closed projects. Pitch your topic with ease and precision using this Project Metrics Dashboard With Active Issues Topics PDF. This layout presents information on Project Metrics, Dashboard With Active Issues. It is also available for immediate download and adjustment. So, changes can be made in the color, design, graphics or any other component to create a unique layout.
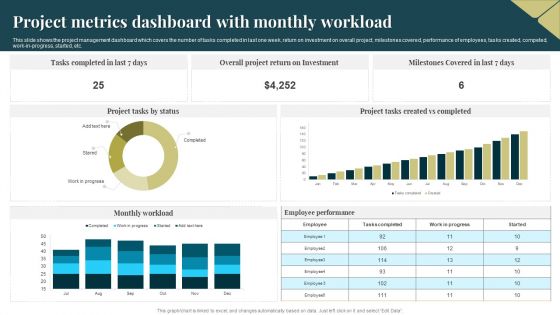
Project Metrics Dashboard With Monthly Workload Topics PDF
This slide shows the project management dashboard which covers the number of tasks completed in last one week, return on investment on overall project, milestones covered, performance of employees, tasks created, competed, work in progress, started, etc. Pitch your topic with ease and precision using this Project Metrics Dashboard With Monthly Workload Topics PDF. This layout presents information on Investment, Employee Performance, Project Metrics Dashboard. It is also available for immediate download and adjustment. So, changes can be made in the color, design, graphics or any other component to create a unique layout.
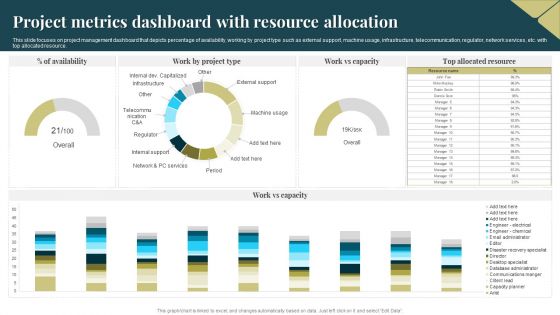
Project Metrics Dashboard With Resource Allocation Portrait PDF
This slide focuses on project management dashboard that depicts percentage of availability, working by project type such as external support, machine usage, infrastructure, telecommunication, regulator, network services, etc. with top allocated resource. Pitch your topic with ease and precision using this Project Metrics Dashboard With Resource Allocation Portrait PDF. This layout presents information on Project Metrics Dashboard, Resource Allocation. It is also available for immediate download and adjustment. So, changes can be made in the color, design, graphics or any other component to create a unique layout.
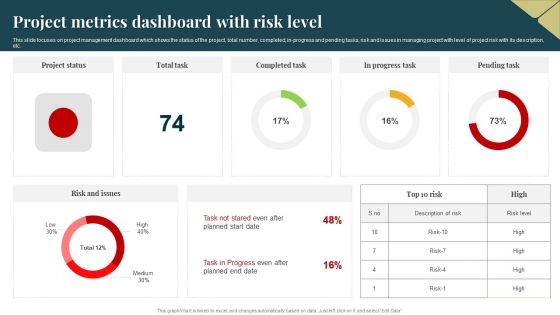
Project Metrics Dashboard With Risk Level Guidelines PDF
This slide focuses on project management dashboard which shows the status of the project, total number, completed, in progress and pending tasks, risk and issues in managing project with level of project risk with its description, etc. Pitch your topic with ease and precision using this Project Metrics Dashboard With Risk Level Guidelines PDF. This layout presents information on Project Metrics Dashboard, Risk Level. It is also available for immediate download and adjustment. So, changes can be made in the color, design, graphics or any other component to create a unique layout.
Project Metrics Dashboard With Task Summary Icons PDF
This slide shows the project management dashboard which covers the summary of different projects with time, cost, workload, tasks and progress with workload, created verses completed tasks, time spent on managing projects, etc. Showcasing this set of slides titled Project Metrics Dashboard With Task Summary Icons PDF. The topics addressed in these templates are Project Metrics Dashboard, Task Summary. All the content presented in this PPT design is completely editable. Download it and make adjustments in color, background, font etc. as per your unique business setting.

Project Metrics Dashboard With Team Requests Background PDF
This slide focuses on the project management dashboard which shows the creation of monthly number of requests, requests made by departmental teams, average completion time in days with the number of requests created on week days, etc. Pitch your topic with ease and precision using this Project Metrics Dashboard With Team Requests Background PDF. This layout presents information on Project Metrics Dashboard, Team Requests. It is also available for immediate download and adjustment. So, changes can be made in the color, design, graphics or any other component to create a unique layout.

Customer Service Metrics Dashboard With Unresolved Calls Designs PDF
This slide showcases KPI dashboard for customer service that can help to identify the issue unresolved and response time by weekday. Its key elements are final call resolution, unresolved calls, avg response time and best day to call. Showcasing this set of slides titled Customer Service Metrics Dashboard With Unresolved Calls Designs PDF. The topics addressed in these templates are Customer Service, Metrics Dashboard, Unresolved Calls. All the content presented in this PPT design is completely editable. Download it and make adjustments in color, background, font etc. as per your unique business setting.
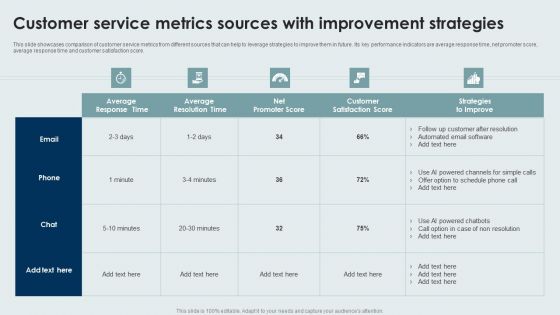
Customer Service Metrics Sources With Improvement Strategies Rules PDF
This slide showcases comparison of customer service metrics from different sources that can help to leverage strategies to improve them in future. Its key performance indicators are average response time, net promoter score, average response time and customer satisfaction score. Showcasing this set of slides titled Customer Service Metrics Sources With Improvement Strategies Rules PDF. The topics addressed in these templates are Average, Strategies, Customer Satisfaction Score. All the content presented in this PPT design is completely editable. Download it and make adjustments in color, background, font etc. as per your unique business setting.
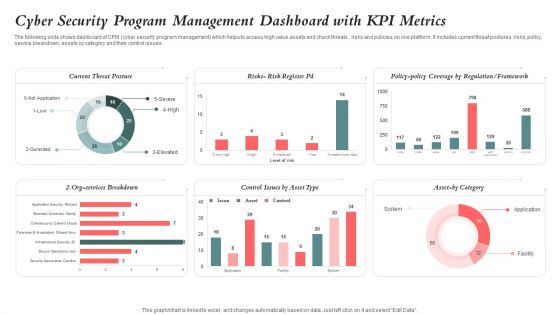
Cyber Security Program Management Dashboard With KPI Metrics Ideas PDF
The following slide shows dashboard of CPM cyber security program management which helps to access high value assets and check threats , risks and policies on one platform. It includes current threat postures, risks, policy, service breakdown, assets by category and their control issues. Pitch your topic with ease and precision using this Cyber Security Program Management Dashboard With KPI Metrics Ideas PDF. This layout presents information on Cyber Security, Program Management Dashboard, Kpi Metrics. It is also available for immediate download and adjustment. So, changes can be made in the color, design, graphics or any other component to create a unique layout.
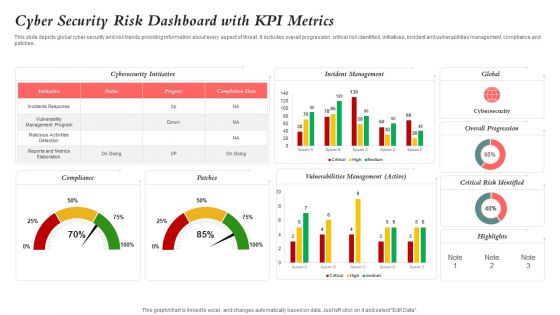
Cyber Security Risk Dashboard With KPI Metrics Elements PDF
This slide depicts global cyber security and risk trends providing information about every aspect of threat. It includes overall progression, critical risk identified, initiatives, incident and vulnerabilities management, compliance and patches. Showcasing this set of slides titled Cyber Security Risk Dashboard With KPI Metrics Elements PDF. The topics addressed in these templates are Vulnerability Management Program, Reports And Metrics Elaboration, Critical Risk Identified. All the content presented in this PPT design is completely editable. Download it and make adjustments in color, background, font etc. as per your unique business setting.
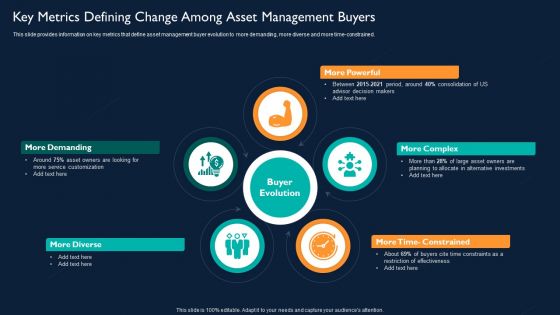
Key Metrics Defining Change Among Asset Management Buyers Elements PDF
This slide provides information on key metrics that define asset management buyer evolution to more demanding, more diverse and more time-constrained. This is a Key Metrics Defining Change Among Asset Management Buyers Elements PDF template with various stages. Focus and dispense information on five stages using this creative set, that comes with editable features. It contains large content boxes to add your information on topics like More Complex, Buyer Evolution, More Diverse. You can also showcase facts, figures, and other relevant content using this PPT layout. Grab it now.
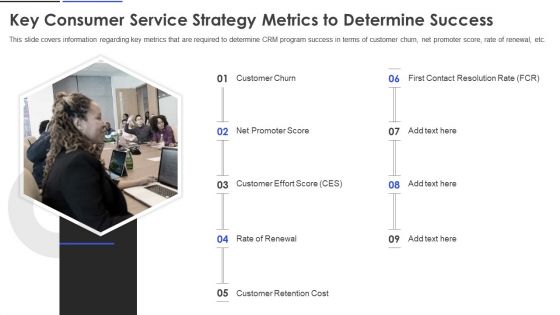
Key Consumer Service Strategy Metrics To Determine Success Portrait PDF
This slide covers information regarding key metrics that are required to determine CRM program success in terms of customer churn, net promoter score, rate of renewal, etc. This is a Key Consumer Service Strategy Metrics To Determine Success Portrait PDF template with various stages. Focus and dispense information on nine stages using this creative set, that comes with editable features. It contains large content boxes to add your information on topics like Net Promoter Score, Customer Churn, Customer Effort Score. You can also showcase facts, figures, and other relevant content using this PPT layout. Grab it now.

Success Metrics To Assess Consumer Service Strategy Pictures PDF
This slide provides information regarding the customer relationship metrics in order to access CRM program success. This is a Success Metrics To Assess Consumer Service Strategy Pictures PDF template with various stages. Focus and dispense information on seven stages using this creative set, that comes with editable features. It contains large content boxes to add your information on topics like Increased Up Sale, Increased Referrals, Customer Lifetime Value. You can also showcase facts, figures, and other relevant content using this PPT layout. Grab it now.
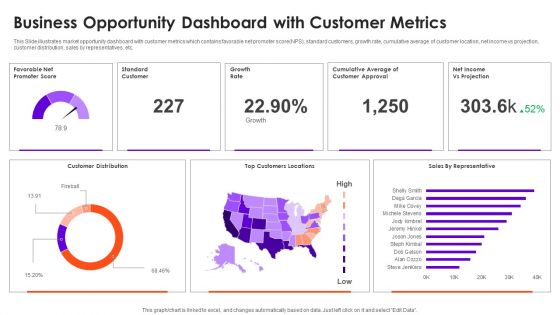
Business Opportunity Dashboard With Customer Metrics Information PDF
This Slide illustrates market opportunity dashboard with customer metrics which contains favorable net promoter score NPS, standard customers, growth rate, cumulative average of customer location, net income vs projection, customer distribution, sales by representatives, etc. Pitch your topic with ease and precision using this Business Opportunity Dashboard With Customer Metrics Information PDF. This layout presents information on Customer Distribution, Growth Rate, Top Customers Locations. It is also available for immediate download and adjustment. So, changes can be made in the color, design, graphics or any other component to create a unique layout.
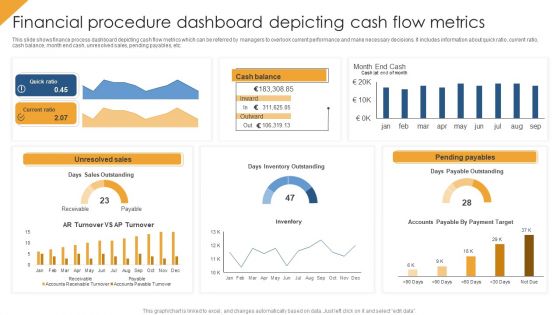
Financial Procedure Dashboard Depicting Cash Flow Metrics Structure PDF
This slide shows finance process dashboard depicting cash flow metrics which can be referred by managers to overlook current performance and make necessary decisions. It includes information about quick ratio, current ratio, cash balance, month end cash, unresolved sales, pending payables, etc. Pitch your topic with ease and precision using this Financial Procedure Dashboard Depicting Cash Flow Metrics Structure PDF. This layout presents information on Quick Ratio, Unresolved Sales, Pending Payables. It is also available for immediate download and adjustment. So, changes can be made in the color, design, graphics or any other component to create a unique layout.
Altcoins Portfolio Tracking Metrics Dashboard Ppt Inspiration Background Images PDF
This slide covers dashboard for tracking different cryptocurrencies value and growth. It includes metrics such as incomes and expenses, market values, cryptocurrency transactions history, overall growth percentages, exchange rates, etc. Showcasing this set of slides titled Altcoins Portfolio Tracking Metrics Dashboard Ppt Inspiration Background Images PDF. The topics addressed in these templates are Balance, 3 Currencies, Transactions. All the content presented in this PPT design is completely editable. Download it and make adjustments in color, background, font etc. as per your unique business setting.

Brand Client Engagement Loyalty Programs Metrics Demonstration PDF
This slide depicts metrics of innovative customer loyalty programs to add new and retain customers. It includes headings such as program name, members, referrals, annual sales , and points. Showcasing this set of slides titled Brand Client Engagement Loyalty Programs Metrics Demonstration PDF. The topics addressed in these templates are Designer Shoe Warehouse, Sephora Beauty Insider, Starbucks Rewards. All the content presented in this PPT design is completely editable. Download it and make adjustments in color, background, font etc. as per your unique business setting.
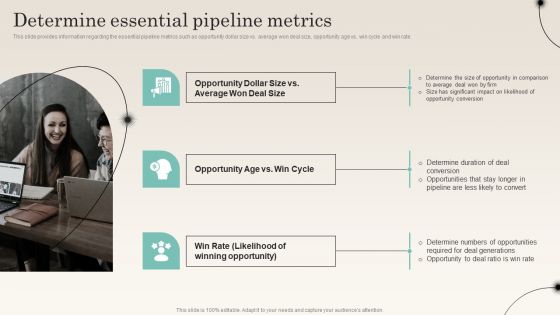
Determine Essential Pipeline Metrics Improving Distribution Channel Introduction PDF
This slide provides information regarding the essential pipeline metrics such as opportunity dollar size vs. average won deal size, opportunity age vs. win cycle and win rate. This is a Determine Essential Pipeline Metrics Improving Distribution Channel Introduction PDF template with various stages. Focus and dispense information on two stages using this creative set, that comes with editable features. It contains large content boxes to add your information on topics like Determine Duration, Winning Opportunity, Determine Duration. You can also showcase facts, figures, and other relevant content using this PPT layout. Grab it now.

Metrics To Manage Company Cash Flow Ppt Model Gridlines PDF
This slide showcases key metrics used by organizations to manage cashflow. The key performance indicators included are days, receivable, inventory and payable outstanding. Pitch your topic with ease and precision using this Metrics To Manage Company Cash Flow Ppt Model Gridlines PDF. This layout presents information on Days Receivable Outstanding, Days Inventory Outstanding, Days Payable Outstanding. It is also available for immediate download and adjustment. So, changes can be made in the color, design, graphics or any other component to create a unique layout.
Key Metrics Defining Change Among Asset Management Buyers Icons PDF
This slide provides information on key metrics that define asset management buyer evolution to more demanding, more diverse and more time constrained. Want to ace your presentation in front of a live audience Our Key Metrics Defining Change Among Asset Management Buyers Icons PDF can help you do that by engaging all the users towards you. Slidegeeks experts have put their efforts and expertise into creating these impeccable powerpoint presentations so that you can communicate your ideas clearly. Moreover, all the templates are customizable, and easy to edit and downloadable. Use these for both personal and commercial use.

Psychological Marketing Metrics That Influence Buying Behaviour Elements PDF
This slide covers metrics to develop effective marketing material by understanding customer behavior and then utilizing them to achieve goals of company. It includes trust, fear, guilt, belonging, time, value and competition. Persuade your audience using this Psychological Marketing Metrics That Influence Buying Behaviour Elements PDF. This PPT design covers seven stages, thus making it a great tool to use. It also caters to a variety of topics including Competition, Value, Trust. Download this PPT design now to present a convincing pitch that not only emphasizes the topic but also showcases your presentation skills.
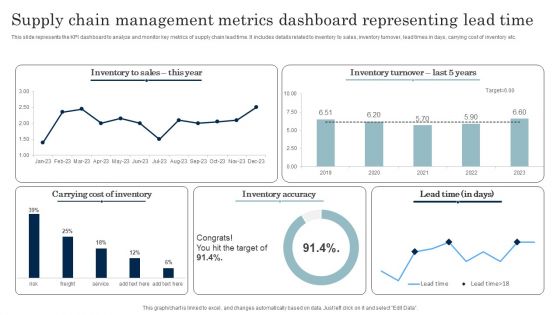
Supply Chain Management Metrics Dashboard Representing Lead Time Download PDF
This slide represents the KPI dashboard to analyze and monitor key metrics of supply chain lead time. It includes details related to inventory to sales, inventory turnover, lead times in days, carrying cost of inventory etc. Pitch your topic with ease and precision using this Supply Chain Management Metrics Dashboard Representing Lead Time Download PDF. This layout presents information on Inventory Accuracy, Carrying Cost Of Inventory. It is also available for immediate download and adjustment. So, changes can be made in the color, design, graphics or any other component to create a unique layout.

Business Referral Marketing Program Performance Metrics Dashboard Introduction PDF
This slide shows KPI dashboard to effectively track performance of business referral program in order to attract more leads and potential customers to the busines. It includes details related to key metrics such as referral participation rate, referred customers, referral conversion rate and total revenue generated. Showcasing this set of slides titled Business Referral Marketing Program Performance Metrics Dashboard Introduction PDF. The topics addressed in these templates are Referral Participation Rate, Referred Customers, Referral Conversion Rate, Total Revenue Generated. All the content presented in this PPT design is completely editable. Download it and make adjustments in color, background, font etc. as per your unique business setting.
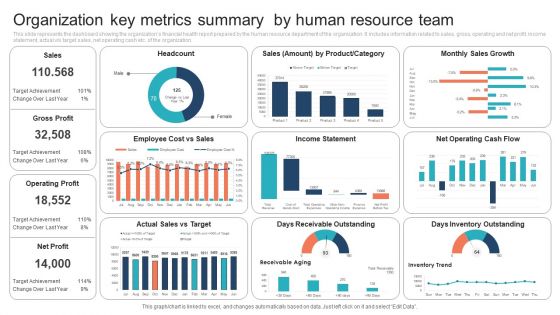
Organization Key Metrics Summary By Human Resource Team Information PDF
This slide represents the dashboard showing the organizations financial health report prepared by the human resource department of the organization. It includes information related to sales, gross, operating and net profit, income statement, actual vs target sales, net operating cash etc. of the organization.Showcasing this set of slides titled Organization Key Metrics Summary By Human Resource Team Information PDF. The topics addressed in these templates are Organization Key Metrics Summary, Human Resource Team. All the content presented in this PPT design is completely editable. Download it and make adjustments in color, background, font etc. as per your unique business setting.

Software Engineering Performance Metrics Dashboard To Improve Results Infographics PDF
This slide covers software engineering KPI dashboard to improve results and efficiency. It involves details such as new issues of last week, number of remaining issues, daily pull requests, average response time on daily basis and cumulative task flow. Pitch your topic with ease and precision using this Software Engineering Performance Metrics Dashboard To Improve Results Infographics PDF. This layout presents information on Software Engineering Performance, Metrics Dashboard Improve Results. It is also available for immediate download and adjustment. So, changes can be made in the color, design, graphics or any other component to create a unique layout.
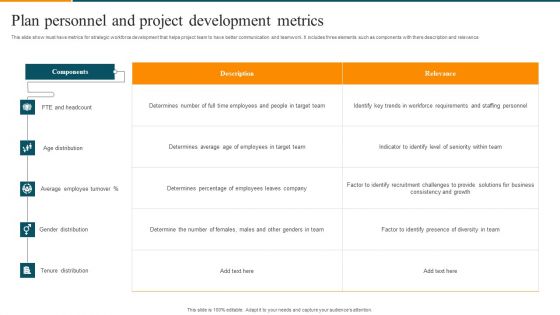
Plan Personnel And Project Development Metrics Professional PDF
This slide show must have metrics for strategic workforce development that helps project team to have better communication and teamwork. It includes three elements such as components with there description and relevance. Pitch your topic with ease and precision using this Plan Personnel And Project Development Metrics Professional PDF. This layout presents information on Employees, Determines, Target Team. It is also available for immediate download and adjustment. So, changes can be made in the color, design, graphics or any other component to create a unique layout.
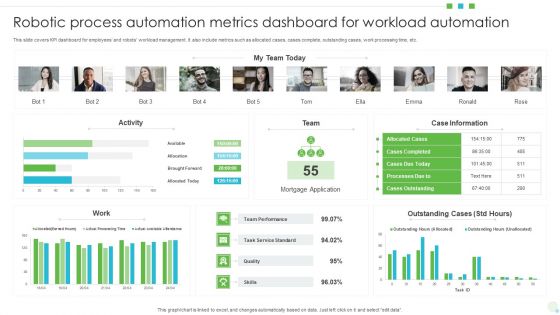
Robotic Process Automation Metrics Dashboard For Workload Automation Mockup PDF
This slide covers KPI dashboard for employees and robots workload management. It also include metrics such as allocated cases, cases complete, outstanding cases, work processing time, etc. Pitch your topic with ease and precision using this Robotic Process Automation Metrics Dashboard For Workload Automation Mockup PDF. This layout presents information on Mortgage Application, Team Performance, Case Information. It is also available for immediate download and adjustment. So, changes can be made in the color, design, graphics or any other component to create a unique layout.
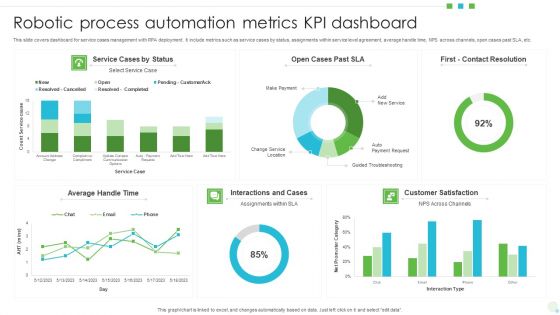
Robotic Process Automation Metrics KPI Dashboard Themes PDF
This slide covers dashboard for service cases management with RPA deployment. It include metrics such as service cases by status, assignments within service level agreement, average handle time, NPS across channels, open cases past SLA, etc. Showcasing this set of slides titled Robotic Process Automation Metrics KPI Dashboard Themes PDF. The topics addressed in these templates are Average, Service Cases, Customer Satisfaction. All the content presented in this PPT design is completely editable. Download it and make adjustments in color, background, font etc. as per your unique business setting.
Customer Relationship Management Various CRM Program Success Metrics Icons PDF
This slide covers information regarding the metrics associated customer relationship to analyze CRM program success. Coming up with a presentation necessitates that the majority of the effort goes into the content and the message you intend to convey. The visuals of a PowerPoint presentation can only be effective if it supplements and supports the story that is being told. Keeping this in mind our experts created Customer Relationship Management Various CRM Program Success Metrics Icons PDF to reduce the time that goes into designing the presentation. This way, you can concentrate on the message while our designers take care of providing you with the right template for the situation.
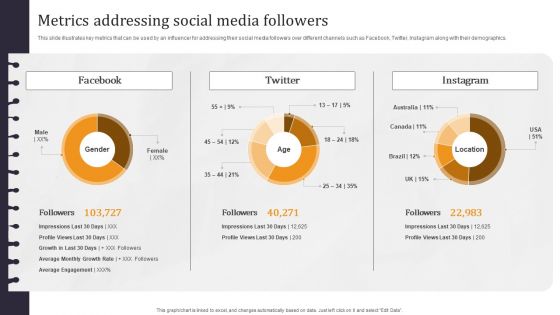
Developing Appealing Persona Metrics Addressing Social Media Followers Elements PDF
This slide illustrates key metrics that can be used by an influencer for addressing their social media followers over different channels such as Facebook, Twitter, Instagram along with their demographics. The best PPT templates are a great way to save time, energy, and resources. Slidegeeks have 100 PERCENT editable powerpoint slides making them incredibly versatile. With these quality presentation templates, you can create a captivating and memorable presentation by combining visually appealing slides and effectively communicating your message. Download Developing Appealing Persona Metrics Addressing Social Media Followers Elements PDF from Slidegeeks and deliver a wonderful presentation.

Determine Essential Pipeline Metrics Managing Sales Pipeline Health Themes PDF
This slide provides information regarding the essential pipeline metrics such as opportunity dollar size vs average won deal size, opportunity age vs. win cycle and win rate. Slidegeeks is one of the best resources for PowerPoint templates. You can download easily and regulate Determine Essential Pipeline Metrics Managing Sales Pipeline Health Themes PDF for your personal presentations from our wonderful collection. A few clicks is all it takes to discover and get the most relevant and appropriate templates. Use our Templates to add a unique zing and appeal to your presentation and meetings. All the slides are easy to edit and you can use them even for advertisement purposes.

Procurement Pricing Benchmarks Analysis Report With Key Metrics Designs PDF
This slide shows the report representing the procurement price benchmarks for various organizations. It represents analysis of market average, best-in-class and all others on the basis of procurement key metrics. Pitch your topic with ease and precision using this Procurement Pricing Benchmarks Analysis Report With Key Metrics Designs PDF. This layout presents information on Spend Under Management, Contract Complaint. It is also available for immediate download and adjustment. So, changes can be made in the color, design, graphics or any other component to create a unique layout.

User Behavior Metrics For Content Performance Analysis Pictures PDF
This slide exhibits content metrics based on consumer behavior to understand customer interaction with website. It contains five points page views, average time on page, users, new and returning visitors, bounce rate and pages per session. Persuade your audience using this User Behavior Metrics For Content Performance Analysis Pictures PDF. This PPT design covers Six stages, thus making it a great tool to use. It also caters to a variety of topics including Page Views, New And Returning Visitors. Download this PPT design now to present a convincing pitch that not only emphasizes the topic but also showcases your presentation skills.

Partner Relationship Management Performance Metrics Dashboard Pictures PDF
This slide represents the dashboard prepared with the help of a PRM software. It includes details related to partner opportunity pipeline, MDF budget, leads, demo units, co brand requests, certified partners, partners logins etc. Showcasing this set of slides titled Partner Relationship Management Performance Metrics Dashboard Pictures PDF. The topics addressed in these templates are Partner Opportunity Pipeline, MDF Budget, Performance Metrics Dashboard. All the content presented in this PPT design is completely editable. Download it and make adjustments in color, background, font etc. as per your unique business setting.

Key Metrics To Track PPC Marketing Campaigns Topics PDF
This slide exhibits metrics that helps to increase return on investment of paid campaigns. It includes five key indicators clicks, impressions, conversion rate, quality score and return on ad spend. Persuade your audience using this Key Metrics To Track PPC Marketing Campaigns Topics PDF. This PPT design covers five stages, thus making it a great tool to use. It also caters to a variety of topics including Conversion Rate, Return On Ad Spend, Impressions. Download this PPT design now to present a convincing pitch that not only emphasizes the topic but also showcases your presentation skills.
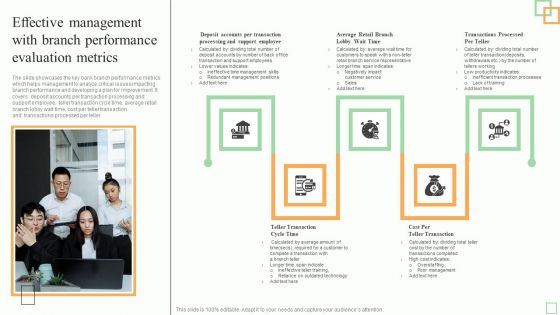
Effective Management With Branch Performance Evaluation Metrics Information PDF
The slide showcases the key bank branch performance metrics which helps management to analyze critical issues impacting branch performance and developing a plan for improvement. It covers deposit accounts per transaction processing and support employee, teller transaction cycle time, average retail branch lobby wait time, cost per teller transaction and transactions processed per teller.Presenting Effective Management With Branch Performance Evaluation Metrics Information PDF to dispense important information. This template comprises five stages. It also presents valuable insights into the topics including Support Employee, Complete Transaction, Outdated Technology. This is a completely customizable PowerPoint theme that can be put to use immediately. So, download it and address the topic impactfully.

Analysis Techniques For Sales Growth Sales Target Metrics Pictures PDF
This slide presents multiple techniques to analyse Sales Target Metrics for sales growth helpful to investigate underlying data and look for efficiencies. It includes methods such as net working capital, sales growth, affordable growth rate and break even percentage that can prove to be highly effective. Presenting Analysis Techniques For Sales Growth Sales Target Metrics Pictures PDF to dispense important information. This template comprises four stages. It also presents valuable insights into the topics including Net Working Capital, Affordable Growth Rate, Break Even Percentage. This is a completely customizable PowerPoint theme that can be put to use immediately. So, download it and address the topic impactfully.
Dashboard For Tracking Sales Target Metrics Introduction PDF
This slide presents KPI dashboard for tracking Sales Target Metrics achievement monthly and region wise helpful in adjusting activities as per ongoing performance. It includes average weekly sales revenue, average sales target, annual sales growth, regional sales performance and average revenue per unit that should be regularly tracked. Showcasing this set of slides titled Dashboard For Tracking Sales Target Metrics Introduction PDF. The topics addressed in these templates are Average Revenue, Per Unit, Average Weekly, Sales Revenue. All the content presented in this PPT design is completely editable. Download it and make adjustments in color, background, font etc. as per your unique business setting.
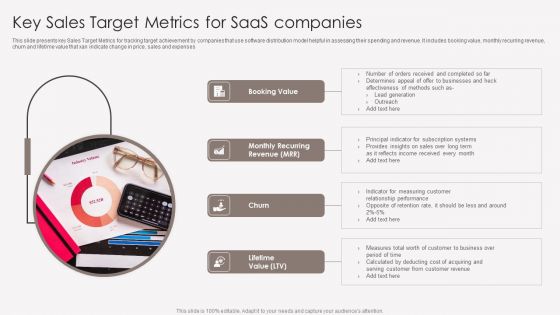
Key Sales Target Metrics For Saas Companies Portrait PDF
This slide presents key Sales Target Metrics for tracking target achievement by companies that use software distribution model helpful in assessing their spending and revenue. It includes booking value, monthly recurring revenue, churn and lifetime value that xan indicate change in price, sales and expenses. Persuade your audience using this Key Sales Target Metrics For Saas Companies Portrait PDF. This PPT design covers four stages, thus making it a great tool to use. It also caters to a variety of topics including Booking Value, Churn, Lifetime Value. Download this PPT design now to present a convincing pitch that not only emphasizes the topic but also showcases your presentation skills.
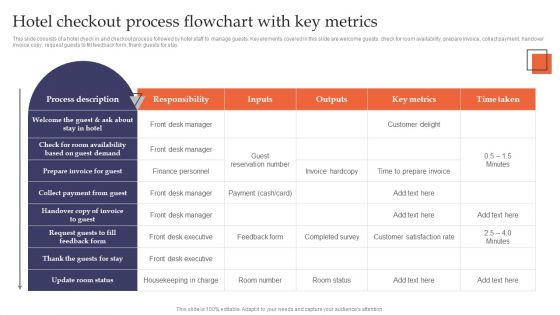
Hotel Checkout Process Flowchart With Key Metrics Structure PDF
This slide consists of a hotel check in and checkout process followed by hotel staff to manage guests. Key elements covered in this slide are welcome guests, check for room availability, prepare invoice, collect payment, handover invoice copy, request guests to fill feedback form, thank guests for stay. Showcasing this set of slides titled Hotel Checkout Process Flowchart With Key Metrics Structure PDF. The topics addressed in these templates are Responsibility, Outputs, Key Metrics. All the content presented in this PPT design is completely editable. Download it and make adjustments in color, background, font etc. as per your unique business setting.

Key Metrics In Software Sales Strategy Pictures PDF
This slide presents key metrics to be tracked in software sales plan, that helps organisations to keep track of growth and profits generated over time. It includes monthly recurring revenue, average revenue per user, customer lifetime value and lead velocity rate Presenting Key Metrics In Software Sales Strategy Pictures PDF to dispense important information. This template comprises four stages. It also presents valuable insights into the topics including Monthly Recurring Revenue, Customer Lifetime Value, Lead Velocity Rate. This is a completely customizable PowerPoint theme that can be put to use immediately. So, download it and address the topic impactfully.
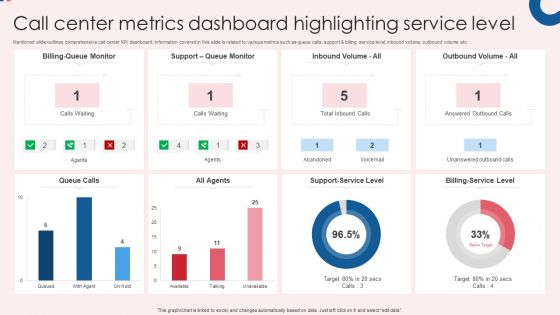
Call Center Metrics Dashboard Highlighting Service Level Infographics PDF
Mentioned slide outlines comprehensive call center KPI dashboard. Information covered in this slide is related to various metrics such as queue calls, support and billing service level, inbound volume, outbound volume etc. Pitch your topic with ease and precision using this Call Center Metrics Dashboard Highlighting Service Level Infographics PDF. This layout presents information on All Agents, Queue Calls, Billing Service Level. It is also available for immediate download and adjustment. So, changes can be made in the color, design, graphics or any other component to create a unique layout.
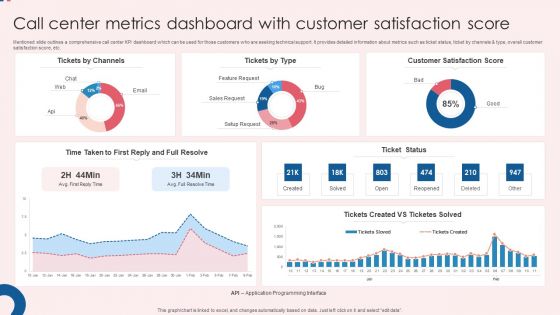
Call Center Metrics Dashboard With Customer Satisfaction Score Ideas PDF
Mentioned slide outlines a comprehensive call center KPI dashboard which can be used for those customers who are seeking technical support. It provides detailed information about metrics such as ticket status, ticket by channels and type, overall customer satisfaction score, etc. Showcasing this set of slides titled Call Center Metrics Dashboard With Customer Satisfaction Score Ideas PDF. The topics addressed in these templates are Customer Satisfaction, Score Ticket Status, Satisfaction Score. All the content presented in this PPT design is completely editable. Download it and make adjustments in color, background, font etc. as per your unique business setting.

Call Center Metrics Dashboard With First Response Time Background PDF
Mentioned slide outlines a KPI dashboard which can be used by call centers for the ticket system. Tickets created, unassigned, open, solved, escalated, tickets solved by agents, first response and full resolution time are the key metrics highlighted in the slide. Pitch your topic with ease and precision using this Call Center Metrics Dashboard With First Response Time Background PDF. This layout presents information on First Response Time, First Resolution Time, Response Time. It is also available for immediate download and adjustment. So, changes can be made in the color, design, graphics or any other component to create a unique layout.
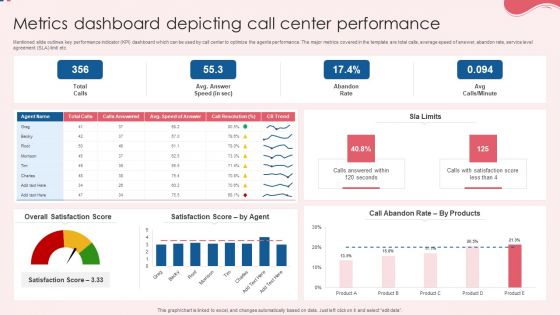
Metrics Dashboard Depicting Call Center Performance Pictures PDF
Mentioned slide outlines key performance indicator KPI dashboard which can be used by call center to optimize the agents performance. The major metrics covered in the template are total calls, average speed of answer, abandon rate, service level agreement SLA limit etc. Pitch your topic with ease and precision using this Metrics Dashboard Depicting Call Center Performance Pictures PDF. This layout presents information on Overall Satisfaction Score, Satisfaction Score, Performance. It is also available for immediate download and adjustment. So, changes can be made in the color, design, graphics or any other component to create a unique layout.

Key Performance Metrics For FY 2020 One Pager Documents
The slide shows the graphical representation of business performance. It represents the total human workforce, customer and social relationship and community partners associated with the business. Presenting you an exemplary Key Performance Metrics For FY 2020 One Pager Documents. Our one-pager comprises all the must-have essentials of an inclusive document. You can edit it with ease, as its layout is completely editable. With such freedom, you can tweak its design and other elements to your requirements. Download this Key Performance Metrics For FY 2020 One Pager Documents brilliant piece now.
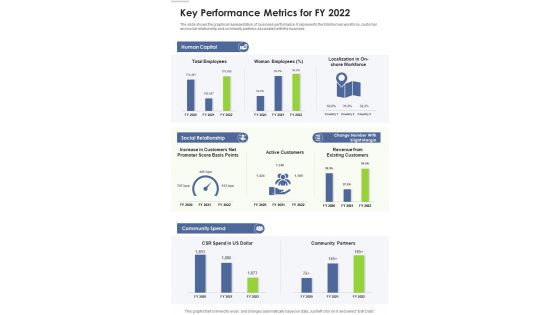
Key Performance Metrics For FY 2022 One Pager Documents
The slide shows the graphical representation of business performance. It represents the total human workforce, customer and social relationship and community partners associated with the business. Presenting you an exemplary Key Performance Metrics For FY 2022 One Pager Documents. Our one-pager comprises all the must-have essentials of an inclusive document. You can edit it with ease, as its layout is completely editable. With such freedom, you can tweak its design and other elements to your requirements. Download this Key Performance Metrics For FY 2022 One Pager Documents brilliant piece now.

Human Resource Management Competency Framework And Metrics Brochure PDF
The slide shows an ability framework of human resource management including strategy, key initiatives and HR metrics. It also displays planning, hiring, identification, conduct management, learning and development, progression, retention, staff wellness and exit. Showcasing this set of slides titled Human Resource Management Competency Framework And Metrics Brochure PDF. The topics addressed in these templates are Develop, Purchase, Development. All the content presented in this PPT design is completely editable. Download it and make adjustments in color, background, font etc. as per your unique business setting.

Track Metrics To Analyze Social Media Engagement Download PDF
This slide showcases key indicators to track and analyze social media engagement. The metrics covered are reach, impressions, audience growth rate, click-through and average engagement rate, share of voice and conversion rate. If your project calls for a presentation, then Slidegeeks is your go to partner because we have professionally designed, easy to edit templates that are perfect for any presentation. After downloading, you can easily edit Track Metrics To Analyze Social Media Engagement Download PDF and make the changes accordingly. You can rearrange slides or fill them with different images. Check out all the handy templates.
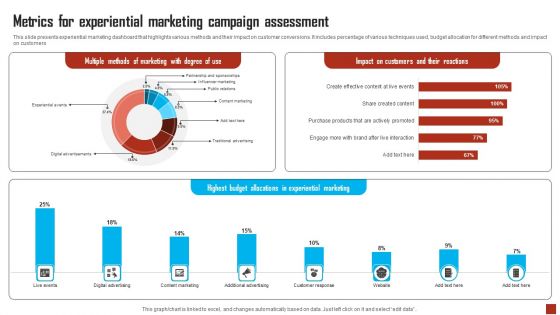
Metrics For Experiential Marketing Campaign Assessment Designs PDF
This slide presents experiential marketing dashboard that highlights various methods and their impact on customer conversions. It includes percentage of various techniques used, budget allocation for different methods and impact on customers. Showcasing this set of slides titled Metrics For Experiential Marketing Campaign Assessment Designs PDF. The topics addressed in these templates are Metrics, Experiential Marketing Campaign Assessment. All the content presented in this PPT design is completely editable. Download it and make adjustments in color, background, font etc. as per your unique business setting.

Highlighting Performance Metrics To Track Brand Awareness Designs PDF
This slide provides information regarding metrics to monitor brand awareness in terms of story reach, recommendations impressions, brand mentions, post engagement, page likes, page views, post reach, etc. The best PPT templates are a great way to save time, energy, and resources. Slidegeeks have 100 percent editable powerpoint slides making them incredibly versatile. With these quality presentation templates, you can create a captivating and memorable presentation by combining visually appealing slides and effectively communicating your message. Download Highlighting Performance Metrics To Track Brand Awareness Designs PDF from Slidegeeks and deliver a wonderful presentation.

Comparing Inventory Management Metrics With Competitors Diagrams PDF
Crafting an eye catching presentation has never been more straightforward. Let your presentation shine with this tasteful yet straightforward Comparing Inventory Management Metrics With Competitors Diagrams PDF template. It offers a minimalistic and classy look that is great for making a statement. The colors have been employed intelligently to add a bit of playfulness while still remaining professional. Construct the ideal Comparing Inventory Management Metrics With Competitors Diagrams PDF that effortlessly grabs the attention of your audience Begin now and be certain to wow your customers.
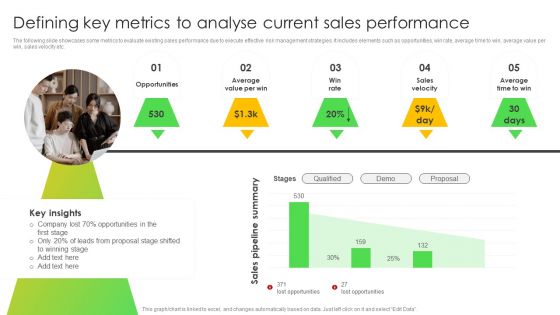
Defining Key Metrics To Analyse Current Sales Performance Background PDF
The following slide showcases some metrics to evaluate existing sales performance due to execute effective risk management strategies. It includes elements such as opportunities, win rate, average time to win, average value per win, sales velocity etc. Want to ace your presentation in front of a live audience Our Defining Key Metrics To Analyse Current Sales Performance Background PDF can help you do that by engaging all the users towards you. Slidegeeks experts have put their efforts and expertise into creating these impeccable powerpoint presentations so that you can communicate your ideas clearly. Moreover, all the templates are customizable, and easy to edit and downloadable. Use these for both personal and commercial use.
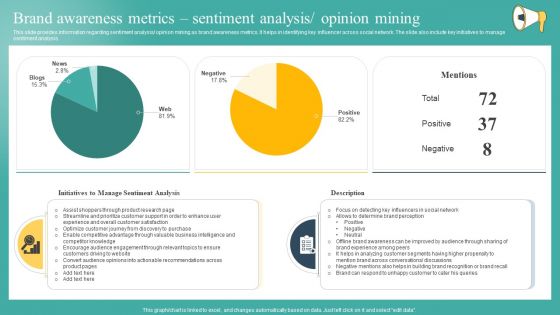
Brand Awareness Metrics Sentiment Analysis Opinion Mining Template PDF
This slide provides information regarding sentiment analysis or opinion mining as brand awareness metrics. It helps in identifying key influencer across social network. The slide also include key initiatives to manage sentiment analysis. Boost your pitch with our creative Brand Awareness Metrics Sentiment Analysis Opinion Mining Template PDF. Deliver an awe inspiring pitch that will mesmerize everyone. Using these presentation templates you will surely catch everyones attention. You can browse the ppts collection on our website. We have researchers who are experts at creating the right content for the templates. So you do not have to invest time in any additional work. Just grab the template now and use them.
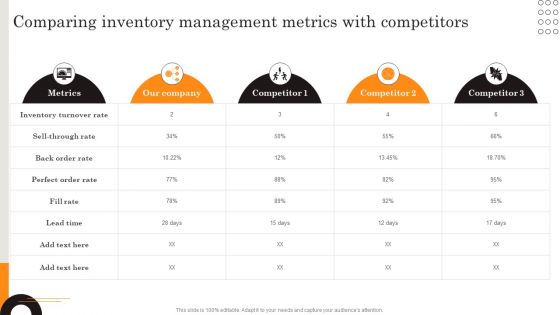
Comparing Inventory Management Metrics With Competitors Introduction PDF
If you are looking for a format to display your unique thoughts, then the professionally designed Comparing Inventory Management Metrics With Competitors Introduction PDF is the one for you. You can use it as a Google Slides template or a PowerPoint template. Incorporate impressive visuals, symbols, images, and other charts. Modify or reorganize the text boxes as you desire. Experiment with shade schemes and font pairings. Alter, share or cooperate with other people on your work. Download Comparing Inventory Management Metrics With Competitors Introduction PDF and find out how to give a successful presentation. Present a perfect display to your team and make your presentation unforgettable.

Brand Advertisement Plan Dashboard With Advertising Metrics Inspiration PDF
The following slide showcases marketing plan dashboard to improve the market share of brand and increase revenue. It includes metrics such as brand awareness, commitment, attributes, market share, repeat purchase and frequency profile etc Showcasing this set of slides titled Brand Advertisement Plan Dashboard With Advertising Metrics Inspiration PDF. The topics addressed in these templates are Brand Awareness, Brand Commitment, Awareness. All the content presented in this PPT design is completely editable. Download it and make adjustments in color, background, font etc. as per your unique business setting.
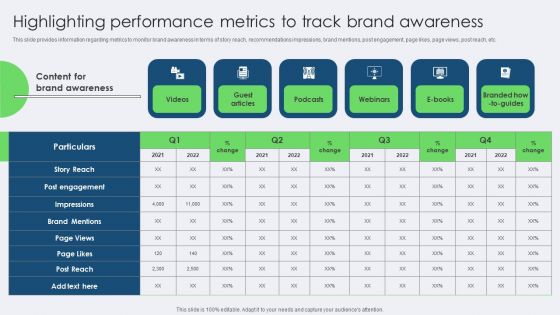
Highlighting Performance Metrics To Track Brand Awareness Portrait PDF
This slide provides information regarding metrics to monitor brand awareness in terms of story reach, recommendations impressions, brand mentions, post engagement, page likes, page views, post reach, etc. Boost your pitch with our creative Highlighting Performance Metrics To Track Brand Awareness Portrait PDF. Deliver an awe-inspiring pitch that will mesmerize everyone. Using these presentation templates you will surely catch everyones attention. You can browse the ppts collection on our website. We have researchers who are experts at creating the right content for the templates. So you do not have to invest time in any additional work. Just grab the template now and use them.

Essential Metrics For Loyalty Incentives Program Performance Microsoft PDF
This slide represents the key metrics to gauge customer satisfaction with a loyalty program. It includes information on four parameters, including the customer engagement score, net promoter score, and customer loyalty index, among others.Persuade your audience using this Essential Metrics For Loyalty Incentives Program Performance Microsoft PDF. This PPT design covers four stages, thus making it a great tool to use. It also caters to a variety of topics including Net Promoter Score, Customer Engagement Score. Download this PPT design now to present a convincing pitch that not only emphasizes the topic but also showcases your presentation skills.

Business Growth Roadmap Success Flowchart With Metrics Themes PDF
This slide presents business development success flowchart that highlights operations and contribution of inputs in producing quality output and its final impact on organization. It includes metrics to track each phase such as industry income, interaction intensity and organizational publications. Presenting Business Growth Roadmap Success Flowchart With Metrics Themes PDF to dispense important information. This template comprises four stages. It also presents valuable insights into the topics including Important Business Research, High Quality Research Conducted, Building Opportunities. This is a completely customizable PowerPoint theme that can be put to use immediately. So, download it and address the topic impactfully.
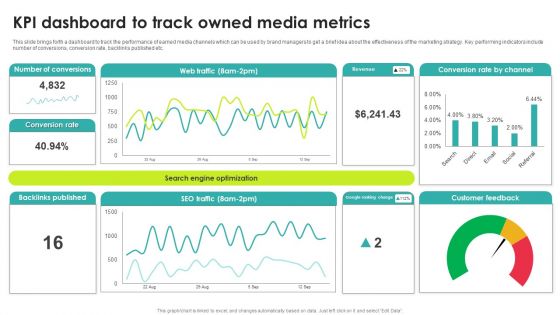
Kpi Dashboard To Track Owned Media Metrics Rules PDF
This slide brings forth a dashboard to track the performance of earned media channels which can be used by brand managers to get a brief idea about the effectiveness of the marketing strategy. Key performing indicators include number of conversions, conversion rate, backlinks published etc. Pitch your topic with ease and precision using this Kpi Dashboard To Track Owned Media Metrics Rules PDF. This layout presents information on Conversions, Backlinks Published, Metrics. It is also available for immediate download and adjustment. So, changes can be made in the color, design, graphics or any other component to create a unique layout.
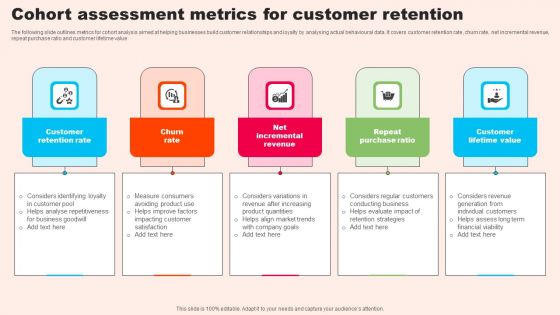
Cohort Assessment Metrics For Customer Retention Inspiration PDF
The following slide outlines metrics for cohort analysis aimed at helping businesses build customer relationships and loyalty by analysing actual behavioural data. It covers customer retention rate, churn rate, net incremental revenue, repeat purchase ratio and customer lifetime value. Presenting Cohort Assessment Metrics For Customer Retention Inspiration PDF to dispense important information. This template comprises five stages. It also presents valuable insights into the topics including Churn Rate, Customer Retention Rate, Net Incremental Revenue. This is a completely customizable PowerPoint theme that can be put to use immediately. So, download it and address the topic impactfully.

Yearly Employee Workplace Production Scorecard With Key Metrics Guidelines PDF
Deliver and pitch your topic in the best possible manner with this Yearly Employee Workplace Production Scorecard With Key Metrics Guidelines PDF. Use them to share invaluable insights on Average Hourly Rate, Increased Employee Productivity, Organization and impress your audience. This template can be altered and modified as per your expectations. So, grab it now.
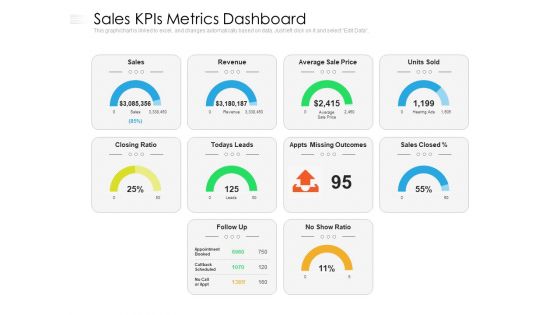
Sales Kpis Metrics Dashboard Ppt PowerPoint Presentation Gallery Demonstration PDF
Presenting this set of slides with name sales kpis metrics dashboard ppt powerpoint presentation gallery demonstration pdf. The topics discussed in these slides are sales, revenue, price. This is a completely editable PowerPoint presentation and is available for immediate download. Download now and impress your audience.
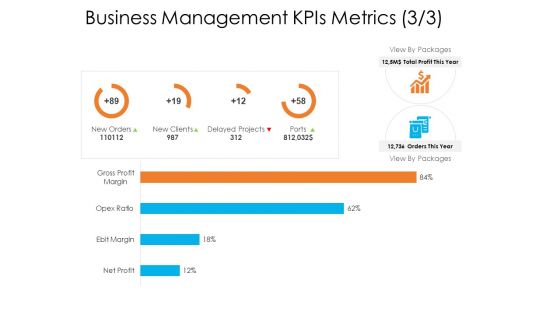
Enterprise Governance Business Management Kpis Metrics Demonstration PDF
Deliver and pitch your topic in the best possible manner with this enterprise governance business management kpis metrics demonstration pdf. Use them to share invaluable insights on new clients, delayed projects, gross profit margin and impress your audience. This template can be altered and modified as per your expectations. So, grab it now.

Business Management Kpis Metrics Delayed Projects Professional PDF
Deliver and pitch your topic in the best possible manner with this business management kpis metrics delayed projects professional pdf. Use them to share invaluable insights on gross profit margin, ebit margin, net profit and impress your audience. This template can be altered and modified as per your expectations. So, grab it now.
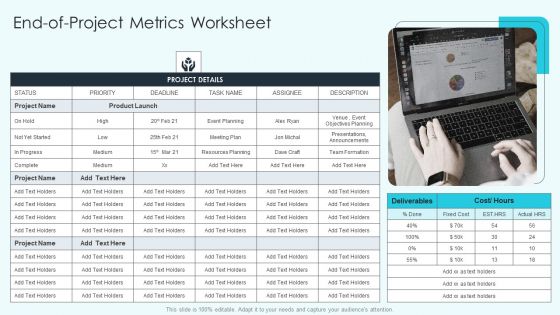
Project Administration Kpis End Of Project Metrics Worksheet Slides PDF
Deliver an awe inspiring pitch with this creative Project Administration Kpis End Of Project Metrics Worksheet Slides PDF bundle. Topics like Product Launch, Cost, Resources Planning can be discussed with this completely editable template. It is available for immediate download depending on the needs and requirements of the user.
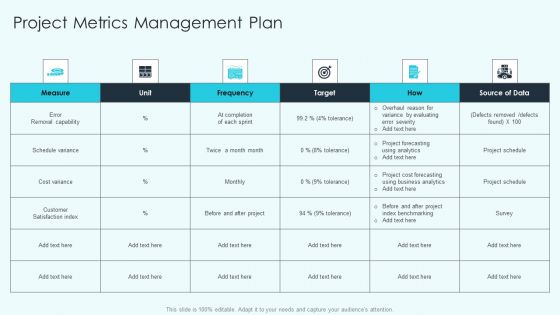
Project Administration Kpis Project Metrics Management Plan Template PDF
Deliver and pitch your topic in the best possible manner with this Project Administration Kpis Project Metrics Management Plan Template PDF. Use them to share invaluable insights on Cost Variance, Customer Satisfaction Index, Error Removal Capability and impress your audience. This template can be altered and modified as per your expectations. So, grab it now.
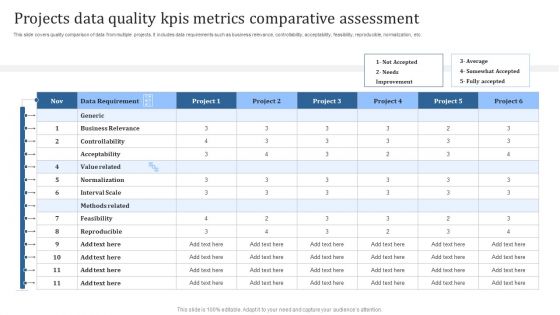
Projects Data Quality Kpis Metrics Comparative Assessment Guidelines PDF
Pitch your topic with ease and precision using this Projects Data Quality Kpis Metrics Comparative Assessment Guidelines PDF. This layout presents information on Business Relevance, Value Related, Methods Related. It is also available for immediate download and adjustment. So, changes can be made in the color, design, graphics or any other component to create a unique layout.
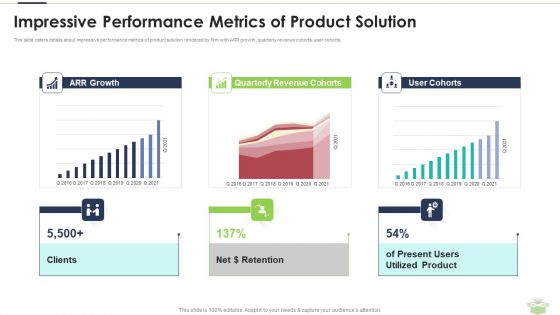
Impressive Performance Metrics Of Product Solution Rules PDF
Deliver and pitch your topic in the best possible manner with this impressive performance metrics of product solution rules pdf. Use them to share invaluable insights on revenue, growth, product and impress your audience. This template can be altered and modified as per your expectations. So, grab it now.
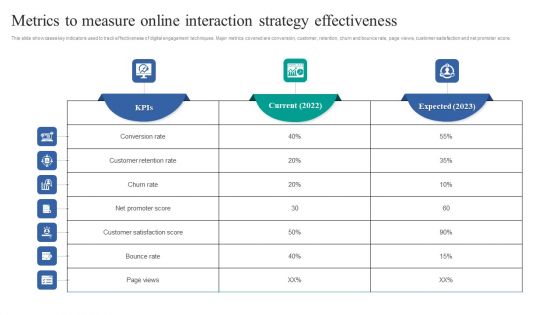
Metrics To Measure Online Interaction Strategy Effectiveness Professional PDF
Showcasing this set of slides titled Metrics To Measure Online Interaction Strategy Effectiveness Professional PDF. The topics addressed in these templates are Measure Online, Interaction Strategy, Effectiveness . All the content presented in this PPT design is completely editable. Download it and make adjustments in color, background, font etc. as per your unique business setting.
Progressive Business Performance Measurement Metrics Gross Ppt Styles Icon PDF
Presenting this set of slides with name progressive business performance measurement metrics gross ppt styles icon pdf. The topics discussed in these slides are gross profit margin, quick ratio, revenue vs expenses, current accounts payable vs receivable. This is a completely editable PowerPoint presentation and is available for immediate download. Download now and impress your audience.

Progressive Business Performance Measurement Metrics Sales Ppt Pictures Guidelines PDF
Presenting this set of slides with name progressive business performance measurement metrics sales ppt pictures guidelines pdf. The topics discussed in these slides are sales, growth, targeted, revenue, performance. This is a completely editable PowerPoint presentation and is available for immediate download. Download now and impress your audience.
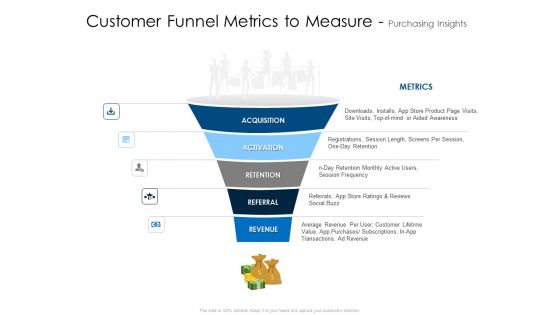
Customer Funnel Metrics To Measure Purchasing Insights Summary PDF
Presenting customer funnel metrics to measure purchasing insights summary pdf to provide visual cues and insights. Share and navigate important information on five stages that need your due attention. This template can be used to pitch topics like acquisition, activation, retention, referral, revenue. In addtion, this PPT design contains high resolution images, graphics, etc, that are easily editable and available for immediate download.

Dashboards Showing Consultancy Company Performance With Key Metrics Mockup PDF
Deliver and pitch your topic in the best possible manner with this dashboards showing consultancy company performance with key metrics mockup pdf. Use them to share invaluable insights on customers, top products, lowest customers, and impress your audience. This template can be altered and modified as per your expectations. So, grab it now.
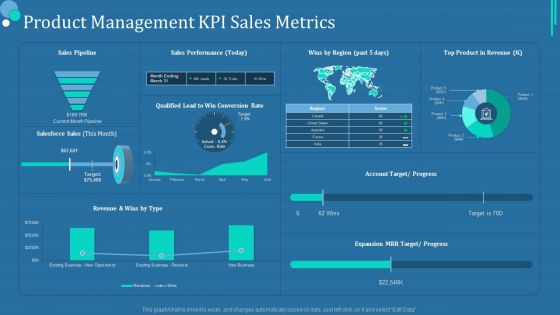
Commodity Category Analysis Product Management KPI Sales Metrics Professional PDF
Deliver an awe inspiring pitch with this creative commodity category analysis product management kpi sales metrics professional pdf bundle. Topics like sales performance, top product in revenue, account target or progress can be discussed with this completely editable template. It is available for immediate download depending on the needs and requirements of the user.
Transformation KPI Dashboard With Key Metrics And Status Icons PDF
Pitch your topic with ease and precision using this Transformation KPI Dashboard With Key Metrics And Status Icons PDF. This layout presents information on Measure, System Implemented, Innovation. It is also available for immediate download and adjustment. So, changes can be made in the color, design, graphics or any other component to create a unique layout.

Business Development Metrics And Scorecard Ppt Powerpoint Slides
This is a business development metrics and scorecard ppt powerpoint slides. This is a four stage process. The stages in this process are business development strategy formulation, assessment of business development strategy, continuous improvement and review strategy, business development, change plan and improvement in strategy.

Financial Metrics And Kpi Template Presentation Visual Aids
This is a financial metrics and kpi template presentation visual aids. This is a three stage process. The stages in this process are operating profit last 12 months, total income act vs forecast between 2009 and 2010, income by qtr by tr between 2007 and 2010.
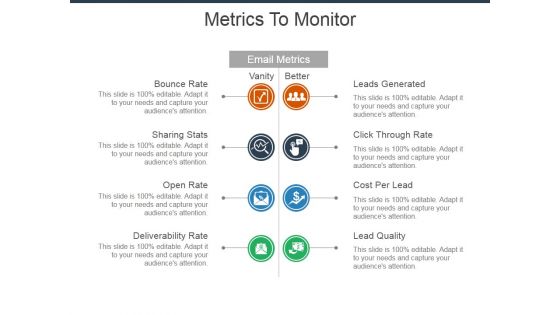
Metrics To Monitor Ppt Powerpoint Presentation Professional Graphics Design
This is a metrics to monitor ppt powerpoint presentation professional graphics design. This is a four stage process. The stages in this process are leads generated, click through rate, cost per lead, lead quality, deliverability rate, open rate, sharing stats, bounce rate.

 Home
Home