Metrics
Network Service Assessment Icon To Measure Web Speed Pictures PDF
Persuade your audience using this Network Service Assessment Icon To Measure Web Speed Pictures PDF. This PPT design covers four stages, thus making it a great tool to use. It also caters to a variety of topics including Network Service Assessment Icon To Measure Web Speed. Download this PPT design now to present a convincing pitch that not only emphasizes the topic but also showcases your presentation skills.

Product Performance Dashboard Post Revenue Building Strategy Brochure PDF
Following slide outlines company product performance KPI dashboard post implementing revenue building strategy. The KPIs covered in the slide are revenue by different months, top five customers and products by revenue, MTD overview by different product lines etc. Showcasing this set of slides titled product performance dashboard post revenue building strategy brochure pdf. The topics addressed in these templates are revenue, target, profit margin. All the content presented in this PPT design is completely editable. Download it and make adjustments in color, background, font etc. as per your unique business setting.

Implementing Effective Distribution Dashboards To Measure Performance Of Distribution Portrait PDF
This slide covers the dashboards to measure performance of various distribution strategies of the organization. This includes partner performance dashboards, top products by revenue, sales by location etc. Crafting an eye-catching presentation has never been more straightforward. Let your presentation shine with this tasteful yet straightforward Implementing Effective Distribution Dashboards To Measure Performance Of Distribution Portrait PDF template. It offers a minimalistic and classy look that is great for making a statement. The colors have been employed intelligently to add a bit of playfulness while still remaining professional. Construct the ideal Implementing Effective Distribution Dashboards To Measure Performance Of Distribution Portrait PDF that effortlessly grabs the attention of your audience Begin now and be certain to wow your customers
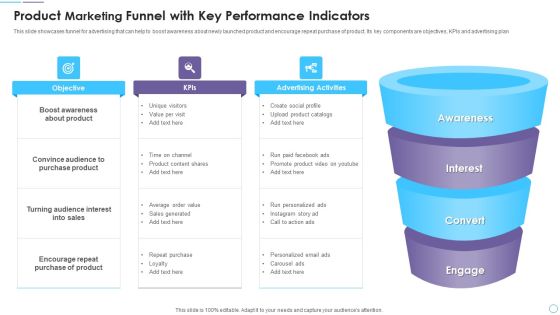
Product Marketing Funnel With Key Performance Indicators Guidelines PDF
This slide showcases funnel for advertising that can help to boost awareness about newly launched product and encourage repeat purchase of product. Its key components are objectives, KPIs and advertising plan. Presenting Product Marketing Funnel With Key Performance Indicators Guidelines PDF to dispense important information. This template comprises four stages. It also presents valuable insights into the topics including Awareness, Interest, Convert, Engage. This is a completely customizable PowerPoint theme that can be put to use immediately. So, download it and address the topic impactfully.
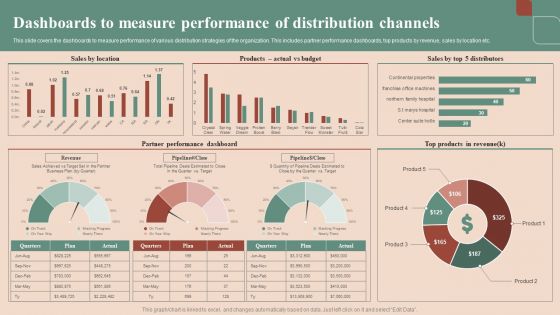
Maximizing Profit Returns With Right Distribution Source Dashboards To Measure Performance Of Distribution Channels Microsoft PDF
This slide covers the dashboards to measure performance of various distribution strategies of the organization. This includes partner performance dashboards, top products by revenue, sales by location etc. Slidegeeks is here to make your presentations a breeze with Maximizing Profit Returns With Right Distribution Source Dashboards To Measure Performance Of Distribution Channels Microsoft PDF With our easy-to-use and customizable templates, you can focus on delivering your ideas rather than worrying about formatting. With a variety of designs to choose from, youre sure to find one that suits your needs. And with animations and unique photos, illustrations, and fonts, you can make your presentation pop. So whether youre giving a sales pitch or presenting to the board, make sure to check out Slidegeeks first.
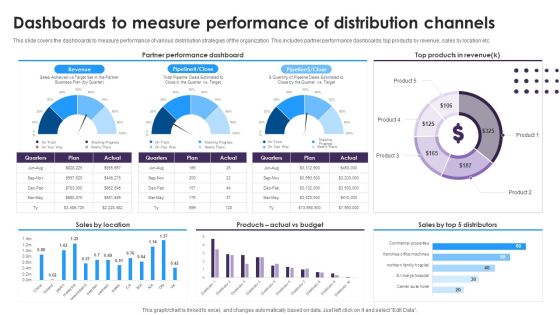
Omnichannel Distribution System To Satisfy Customer Needs Dashboards To Measure Performance Of Distribution Channels Brochure PDF
This slide covers the dashboards to measure performance of various distribution strategies of the organization. This includes partner performance dashboards, top products by revenue, sales by location etc. Present like a pro with Omnichannel Distribution System To Satisfy Customer Needs Dashboards To Measure Performance Of Distribution Channels Brochure PDF Create beautiful presentations together with your team, using our easy-to-use presentation slides. Share your ideas in real-time and make changes on the fly by downloading our templates. So whether you are in the office, on the go, or in a remote location, you can stay in sync with your team and present your ideas with confidence. With Slidegeeks presentation got a whole lot easier. Grab these presentations today.

Umbrella Branding Measures To Boost Brand Awareness Improving Corporate Performance Through Leveraged Clipart PDF
This slide provides information regarding ways through which brand performance can be improved such as decoding customer mindset, revamping brand storytelling, enable consistency across all touchpoints. This Umbrella Branding Measures To Boost Brand Awareness Improving Corporate Performance Through Leveraged Clipart PDF is perfect for any presentation, be it in front of clients or colleagues. It is a versatile and stylish solution for organizing your meetings. The Umbrella Branding Measures To Boost Brand Awareness Improving Corporate Performance Through Leveraged Clipart PDF features a modern design for your presentation meetings. The adjustable and customizable slides provide unlimited possibilities for acing up your presentation. Slidegeeks has done all the homework before launching the product for you. So, do not wait, grab the presentation templates today
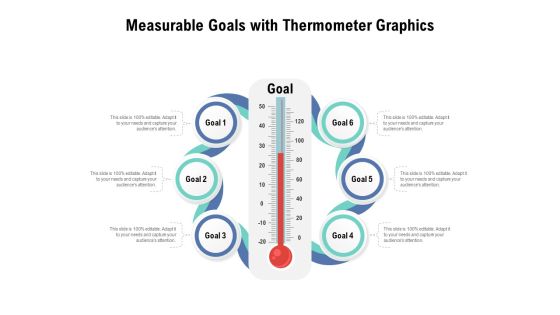
Measurable Goals With Thermometer Graphics Ppt PowerPoint Presentation Gallery Examples PDF
Presenting this set of slides with name measurable goals with thermometer graphics ppt powerpoint presentation gallery examples pdf. This is a six stage process. The stages in this process are measurable goals with thermometer graphics. This is a completely editable PowerPoint presentation and is available for immediate download. Download now and impress your audience.
Vector Illustration Of Measurement Scale Icon Ppt PowerPoint Presentation Infographics Influencers PDF
Presenting this set of slides with name vector illustration of measurement scale icon ppt powerpoint presentation infographics influencers pdf. This is a one stage process. The stage in this process is vector illustration of measurement scale icon. This is a completely editable PowerPoint presentation and is available for immediate download. Download now and impress your audience.

Cios Guide To Optimize Determine IT Staff Performance Measurement Topics PDF
This slide provides information regarding IT staff performance measurement in terms of cost, quality, productivity and service level. Are you in need of a template that can accommodate all of your creative concepts This one is crafted professionally and can be altered to fit any style. Use it with Google Slides or PowerPoint. Include striking photographs, symbols, depictions, and other visuals. Fill, move around, or remove text boxes as desired. Test out color palettes and font mixtures. Edit and save your work, or work with colleagues. Download Cios Guide To Optimize Determine IT Staff Performance Measurement Topics PDF and observe how to make your presentation outstanding. Give an impeccable presentation to your group and make your presentation unforgettable.
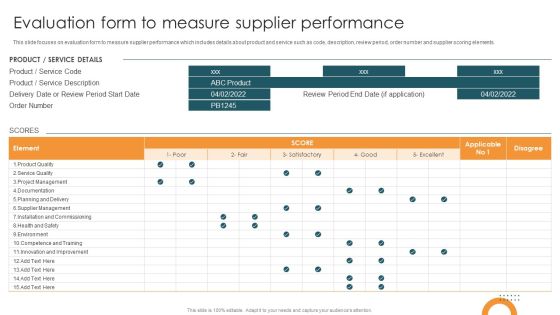
Vendor Relation Management Techniques Evaluation Form To Measure Supplier Performance Rules PDF
This slide focuses on evaluation form to measure supplier performance which includes details about product and service such as code, description, review period, order number and supplier scoring elements. Are you in need of a template that can accommodate all of your creative concepts This one is crafted professionally and can be altered to fit any style. Use it with Google Slides or PowerPoint. Include striking photographs, symbols, depictions, and other visuals. Fill, move around, or remove text boxes as desired. Test out color palettes and font mixtures. Edit and save your work, or work with colleagues. Download Vendor Relation Management Techniques Evaluation Form To Measure Supplier Performance Rules PDF and observe how to make your presentation outstanding. Give an impeccable presentation to your group and make your presentation unforgettable.
Hourglass To Measure The Passage Of Time Ppt PowerPoint Presentation Icon Model PDF
Persuade your audience using this hourglass to measure the passage of time ppt powerpoint presentation icon model pdf. This PPT design covers four stages, thus making it a great tool to use. It also caters to a variety of topics including hourglass to measure the passage of time. Download this PPT design now to present a convincing pitch that not only emphasizes the topic but also showcases your presentation skills.
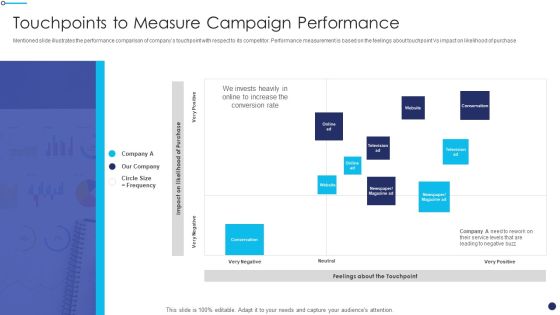
Effective Sales Technique For New Product Launch Touchpoints To Measure Campaign Microsoft PDF
Mentioned slide illustrates the performance comparison of companys touchpoint with respect to its competitor. Performance measurement is based on the feelings about touchpoint Vs impact on likelihood of purchase.Deliver and pitch your topic in the best possible manner with this Effective Sales Technique For New Product Launch Touchpoints To Measure Campaign Microsoft PDF Use them to share invaluable insights on Invests Heavily, Increase Conversion, Leading Negative and impress your audience. This template can be altered and modified as per your expectations. So, grab it now.
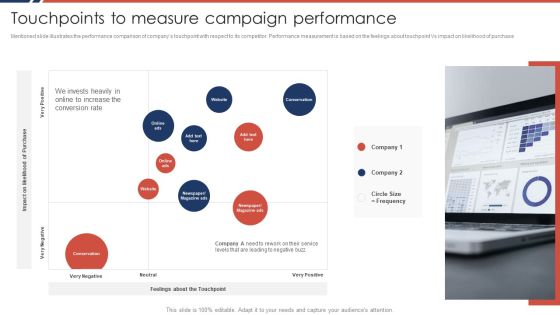
Effective Sales Plan For New Product Introduction In Market Touchpoints To Measure Rules PDF
Mentioned slide illustrates the performance comparison of companys touchpoint with respect to its competitor. Performance measurement is based on the feelings about touchpoint Vs impact on likelihood of purchase.Deliver and pitch your topic in the best possible manner with this Effective Sales Plan For New Product Introduction In Market Touchpoints To Measure Rules PDF Use them to share invaluable insights on Impact Likelihood, Invests Heavily, Increase Conversion and impress your audience. This template can be altered and modified as per your expectations. So, grab it now.
Measurement Of Capacity Planning Vector Icon Ppt Powerpoint Presentation Infographics Aids
Presenting this set of slides with name measurement of capacity planning vector icon ppt powerpoint presentation infographics aids. This is a three stage process. The stages in this process are project resource, capacity management, capacity planning. This is a completely editable PowerPoint presentation and is available for immediate download. Download now and impress your audience.

Manufacturing Operation Quality Improvement Practices Tools Templates Production Rate Key Performance Portrait PDF
The following slide displays the Kpis of manufacturing and operations these Kpis can be defect density, rate of production and rate of return etc. Deliver and pitch your topic in the best possible manner with this manufacturing operation quality improvement practices tools templates production rate key performance portrait pdf. Use them to share invaluable insights on production rate key performance indicators and impress your audience. This template can be altered and modified as per your expectations. So, grab it now.

Maslow Pyramid For Online Marketing Kpis Structure PDF
The slide shows Maslow pyramid for online marketing KPIs. It highlights Loyalty , Sales, online advertising and traffic KPIs. Presenting Maslow Pyramid For Online Marketing Kpis Structure PDF to dispense important information. This template comprises four stages. It also presents valuable insights into the topics including Loyalty Kpis, Sales Kpis, Online Advertising Kpis. This is a completely customizable PowerPoint theme that can be put to use immediately. So, download it and address the topic impactfully.

KPIS Marketing Department Ppt PowerPoint Presentation Slides Master Slide Cpb
This is a kpis marketing department ppt powerpoint presentation slides master slide cpb. This is a three stage process. The stages in this process are kpis marketing department.

Instigating Efficient Value Process Vendor Performance Measurement Dashboard Template PDF
Mentioned slide portray vendor performance measurement dashboard. It covers KPIs such as defect rate, on time supplies, supplier availability and lead time. Deliver and pitch your topic in the best possible manner with this instigating efficient value process vendor performance measurement dashboard template pdf. Use them to share invaluable insights on vendor performance measurement dashboard and impress your audience. This template can be altered and modified as per your expectations. So, grab it now.

Developing Effective Stakeholder Communication Measuring Your Communication Success Summary PDF
The following slide displays key KPIs that can be utilized by the organization to measure their communication strategy performance. It displays the various KPIs such as Employee engagement rate, Employee Feedback, adoption rate etc. Whether you have daily or monthly meetings, a brilliant presentation is necessary. Developing Effective Stakeholder Communication Measuring Your Communication Success Summary PDF can be your best option for delivering a presentation. Represent everything in detail using Developing Effective Stakeholder Communication Measuring Your Communication Success Summary PDF and make yourself stand out in meetings. The template is versatile and follows a structure that will cater to your requirements. All the templates prepared by Slidegeeks are easy to download and edit. Our research experts have taken care of the corporate themes as well. So, give it a try and see the results.
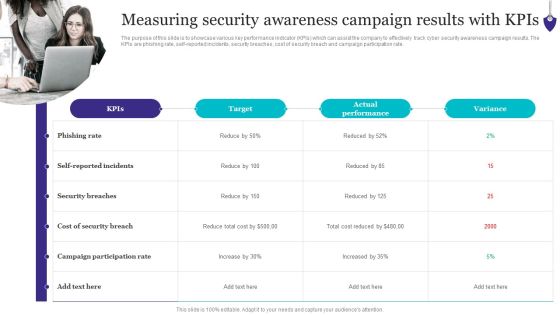
Organizing Security Awareness Measuring Security Awareness Campaign Results Download PDF
The purpose of this slide is to showcase various key performance indicator KPIs which can assist the company to effectively track cyber security awareness campaign results. The KPIs are phishing rate, self-reported incidents, security breaches, cost of security breach and campaign participation rate. Explore a selection of the finest Organizing Security Awareness Measuring Security Awareness Campaign Results Download PDF here. With a plethora of professionally designed and pre-made slide templates, you can quickly and easily find the right one for your upcoming presentation. You can use our Organizing Security Awareness Measuring Security Awareness Campaign Results Download PDF to effectively convey your message to a wider audience. Slidegeeks has done a lot of research before preparing these presentation templates. The content can be personalized and the slides are highly editable. Grab templates today from Slidegeeks.
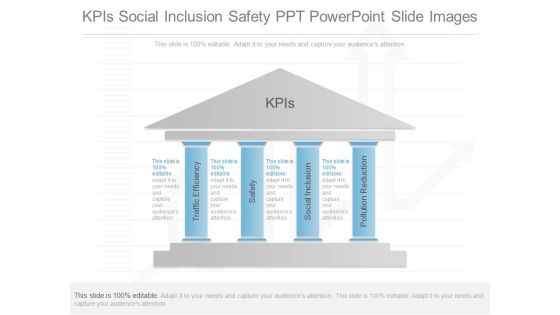
Kpis Social Inclusion Safety Ppt Powerpoint Slide Images
This is a kpis social inclusion safety ppt powerpoint slide images. This is a four stage process. The stages in this process are traffic efficiency, safety, social inclusion, pollution reduction, kpis.

Channel Kpis Template 1 Ppt PowerPoint Presentation Infographic Template Elements
This is a channel kpis template 1 ppt powerpoint presentation infographic template elements. This is a four stage process. The stages in this process are channel kpis, sales density, personnel cost, real estate cost, inventory turnover.

Channel Kpis Template 2 Ppt PowerPoint Presentation Show Designs
This is a channel kpis template 2 ppt powerpoint presentation show designs. This is a four stage process. The stages in this process are channel kpis, inspiration, evaluation, purchase, stationary pos.
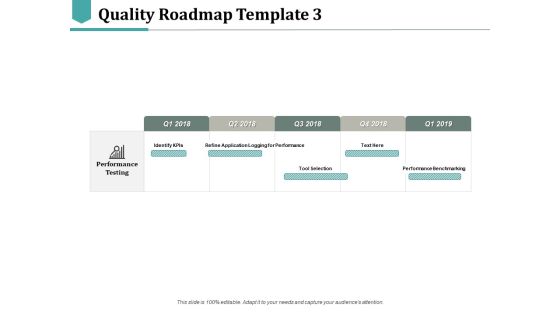
Quality Roadmap Identify Kpis Ppt PowerPoint Presentation Pictures Slideshow
This is a quality roadmap identify kpis ppt powerpoint presentation pictures slideshow. This is a five stage process. The stages in this process are identify kpis, tool selection, performance benchmarking.
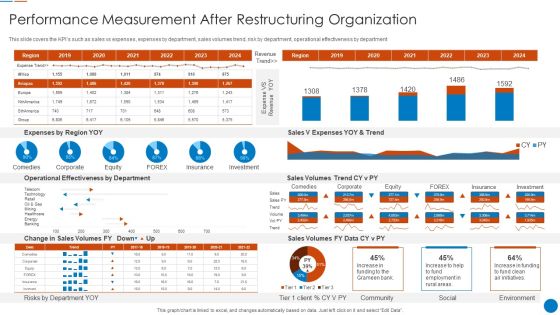
Organizational Restructuring Process Performance Measurement After Restructuring Organization Download PDF
This slide covers the KPIs such as sales vs expenses, expenses by department, sales volumes trend, risk by department, operational effectiveness by department Deliver an awe inspiring pitch with this creative Organizational Restructuring Process Performance Measurement After Restructuring Organization Download PDF bundle. Topics like Operational Effectiveness Department, Expenses By Region, Sales Volumes can be discussed with this completely editable template. It is available for immediate download depending on the needs and requirements of the user.

Business Restructuring Performance Measurement After Business Restructuring Themes PDF
This slide covers the KPIs such as sales vs expenses, expenses by department, sales volumes trend, risk by department, operational effectiveness by department. Deliver an awe inspiring pitch with this creative Business Restructuring Performance Measurement After Business Restructuring Themes PDF bundle. Topics like Sales V Expenses, YOY And Trend, Expenses Region YOY can be discussed with this completely editable template. It is available for immediate download depending on the needs and requirements of the user.

Measuring Sprint Progress Using Agile Dashboard Graphics PDF
Mentioned slide showcases agile dashboard that can be used by project manager to track sprint progress. KPIs covered in the slide are overall sprint progress, statistics by priority and statistics by status.Deliver an awe inspiring pitch with this creative Measuring Sprint Progress Using Agile Dashboard Graphics PDF bundle. Topics like Statistics By Priority, Statistics Status, Responsible Person can be discussed with this completely editable template. It is available for immediate download depending on the needs and requirements of the user.
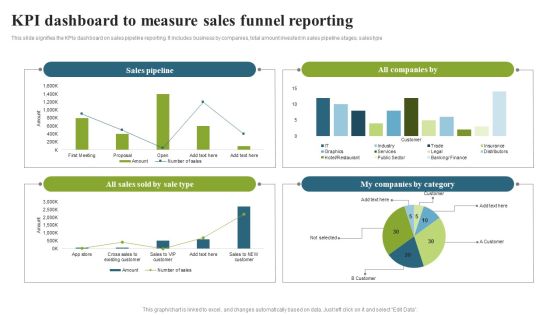
KPI Dashboard To Measure Sales Funnel Reporting Template PDF
This slide signifies the KPIs dashboard on sales pipeline reporting. It includes business by companies, total amount invested in sales pipeline stages, sales type. Showcasing this set of slides titled KPI Dashboard To Measure Sales Funnel Reporting Template PDF. The topics addressed in these templates are Sales Pipeline, Companies Category, Sales Sold. All the content presented in this PPT design is completely editable. Download it and make adjustments in color, background, font etc. as per your unique business setting.
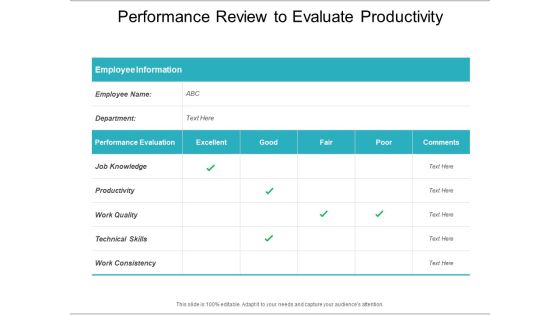
Performance Review To Evaluate Productivity Ppt PowerPoint Presentation Slides Images
Presenting this set of slides with name performance review to evaluate productivity ppt powerpoint presentation slides images. The topics discussed in these slides are self assessment, performance evaluation process, measure employee performance. This is a completely editable PowerPoint presentation and is available for immediate download. Download now and impress your audience.

Process Optimization Through Product Life Process Management Techniques Company Brochure PDF
This slide highlights KPI dashboard exhibiting overall improvement in the financial performance of company as the consequences of program implementation. Deliver and pitch your topic in the best possible manner with this process optimization through product life process management techniques company brochure pdf Use them to share invaluable insights on showing increase, average purchase value, quarterly scorecard and impress your audience. This template can be altered and modified as per your expectations. So, grab it now.
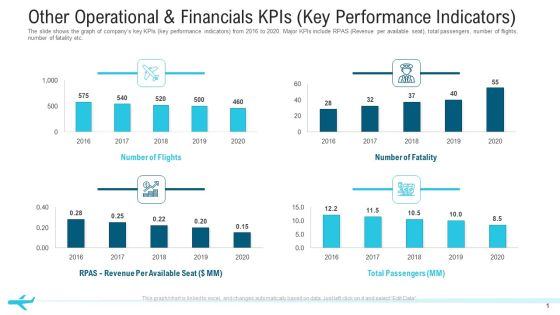
Other Operational And Financials Kpis Key Performance Indicators Structure PDF
The slide shows the graph of companys key KPIs key performance indicators from 2016 to 2020. Major KPIs include RPAS Revenue per available seat, total passengers, number of flights, number of fatality etc.Deliver an awe-inspiring pitch with this creative other operational and financials KPIs key performance indicators structure pdf. bundle. Topics like total passengers, number of flights,2016 to 2020 can be discussed with this completely editable template. It is available for immediate download depending on the needs and requirements of the user.

Dashboard For Tracking Social Media Kpis Mockup PDF
This slide shows dashboard for tracking social media key performance indicators KPIs. It provides details about average social engagement, reactions, comments, shares, clicks, thumbnail, platform, post message, etc. Deliver and pitch your topic in the best possible manner with this Dashboard For Tracking Social Media Kpis Mockup PDF. Use them to share invaluable insights on Social Engagements, Dashboard, Tracking Social Media KPIS and impress your audience. This template can be altered and modified as per your expectations. So, grab it now.
Organization Demand Administration Kpis And Priorities Icons PDF
The below slide showcases the KPIs to enhance forecast accuracy and gain competitive advantage in demand management. It mainly constitutes of techniques, KPIs and priorities. Showcasing this set of slides titled Organization Demand Administration Kpis And Priorities Icons PDF. The topics addressed in these templates are Techniques To Advance, Demand Management. All the content presented in this PPT design is completely editable. Download it and make adjustments in color, background, font etc. as per your unique business setting.

Web Marketing Kpis Diagram Sample Of Ppt Presentation
This is a web marketing kpis diagram sample of ppt presentation. This is a four stage process. The stages in this process are system, synergy, site, scope.

Kpis For Lean Content Marketing Powerpoint Slide Themes
This is a kpis for lean content marketing powerpoint slide themes. This is a four stage process. The stages in this process are volume, amplification, traffic, leads.
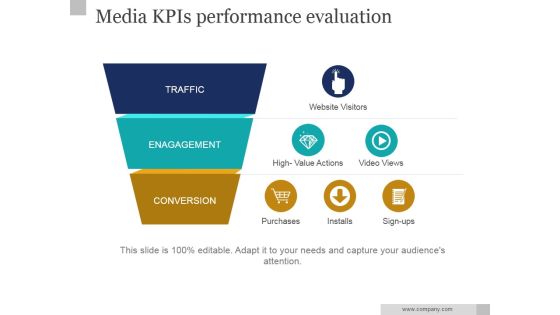
Media Kpis Performance Evaluation Ppt PowerPoint Presentation Background Images
This is a media kpis performance evaluation ppt powerpoint presentation background images. This is a three stage process. The stages in this process are leads, funnel, business, filter.

Media Kpis Performance Evaluation Ppt PowerPoint Presentation Information
This is a media kpis performance evaluation ppt powerpoint presentation information. This is a three stage process. The stages in this process are traffic, engagement, conversion.

Crm Dashboard Kpis Ppt PowerPoint Presentation Inspiration Brochure
This is a crm dashboard kpis ppt powerpoint presentation inspiration brochure. This is a three stage process. The stages in this process are acquisition, active subscribers, revenue.

Media Kpis Performance Evaluation Ppt PowerPoint Presentation Pictures Show
This is a media kpis performance evaluation ppt powerpoint presentation pictures show. This is a three stage process. The stages in this process are traffic, engagement, conversion.

Crm Dashboard Kpis Ppt PowerPoint Presentation Infographic Template Designs
This is a crm dashboard kpis ppt powerpoint presentation infographic template designs. This is a three stage process. The stages in this process are active subscribers, acquisition, revenue.
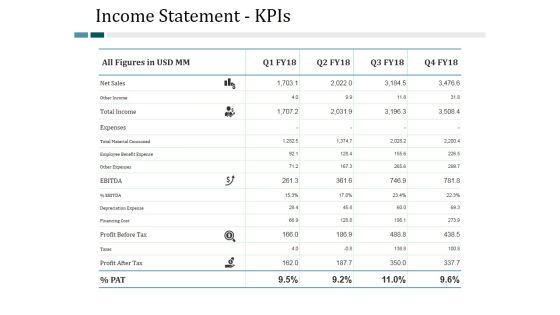
Income Statement Kpis Ppt PowerPoint Presentation Slides Show
This is a income statement kpis ppt powerpoint presentation slides show. This is a four stage process. The stages in this process are business, management, analysis, finance, strategy.

Channel Kpis Ppt PowerPoint Presentation Infographic Template Topics
This is a channel kpis ppt powerpoint presentation infographic template topics. This is a four stage process. The stages in this process are business, timeline, strategy, finance, planning.

Cash Flow Statement Kpis Ppt PowerPoint Presentation Clipart
This is a cash flow statement kpis ppt powerpoint presentation clipart. This is a four stage process. The stages in this process are business, marketing, finance, graph, strategy.

Balance Sheet Kpis Ppt PowerPoint Presentation File Picture
This is a balance sheet kpis ppt powerpoint presentation file picture. This is a four stage process. The stages in this process are business, marketing, finance, graph, cagr.

Business Growth Kpis Ppt PowerPoint Presentation File Good
This is a business growth kpis ppt powerpoint presentation file good. This is a five stage process. The stages in this process are cost reduction strategies.
Kpis And Dashboard Ppt Powerpoint Presentation Outline Styles
This is a kpis and dashboard ppt powerpoint presentation outline styles. This is a two stage process. The stages in this process are business, management, planning, strategy, marketing.

Balance Sheet Kpis Ppt Powerpoint Presentation Outline Shapes
This is a balance sheet kpis ppt powerpoint presentation outline shapes. This is a four stage process. The stages in this process are business, management, planning, strategy, marketing.

P And L Kpis Ppt Powerpoint Presentation Styles
This is a p and l kpis ppt powerpoint presentation styles. This is a four stage process. The stages in this process are finance, marketing, management, investment, analysis.
Kpis And Dashboard Ppt PowerPoint Presentation Icon Grid
This is a kpis and dashboard ppt powerpoint presentation icon grid. This is a two stage process. The stages in this process are icons, management, analysis, strategy, marketing.
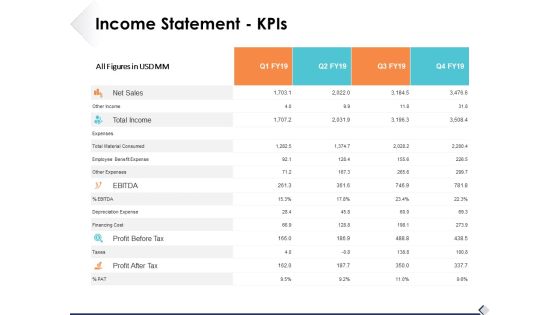
Income Statement Kpis Ppt PowerPoint Presentation Professional Template
This is a income statement kpis ppt powerpoint presentation professional template. This is a four stage process. The stages in this process are business, management, strategy, analysis, icons.

Balance Sheet Kpis Ppt PowerPoint Presentation Summary Layouts
This is a balance sheet kpis ppt powerpoint presentation summary layouts. This is a four stage process. The stages in this process are business, icons, management, strategy, analysis.
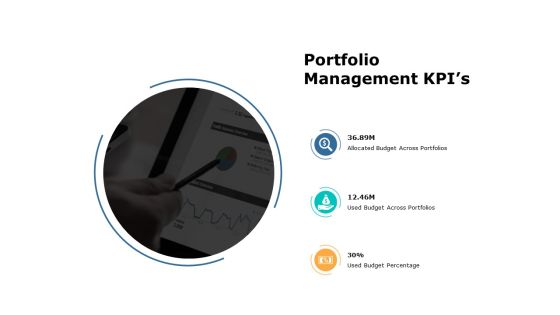
Portfolio Management Kpis Ppt PowerPoint Presentation Summary Gallery
This is a portfolio management kpis ppt powerpoint presentation summary gallery. This is a three stage process. The stages in this process are marketing, business, management.
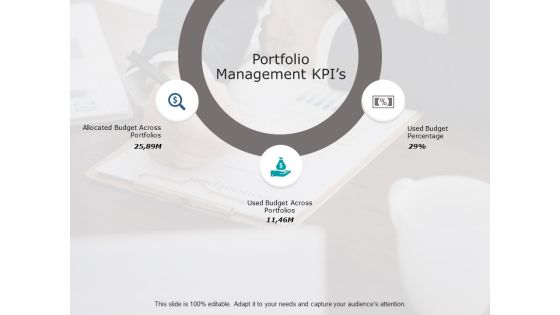
Portfolio Management Kpis Ppt PowerPoint Presentation Infographic Template Smartart
This is a portfolio management kpis ppt powerpoint presentation infographic template smartart. This is a three stage process. The stages in this process are business, management, marketing, process.
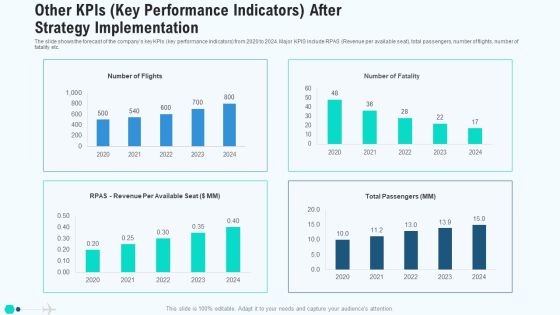
Other Kpis Key Performance Indicators After Strategy Implementation Mockup PDF
The slide shows the forecast of the companys key KPIs key performance indicators from 2020 to 2024. Major KPIS include RPAS Revenue per available seat, total passengers, number of flights, number of fatality etc. Deliver and pitch your topic in the best possible manner with this other kpis key performance indicators after strategy implementation mockup pdf. Use them to share invaluable insights on other kpis key performance indicators after strategy implementation and impress your audience. This template can be altered and modified as per your expectations. So, grab it now.

Other Operational And Financials Kpis Key Performance Indicators Clipart PDF
The slide shows the graph of companys key KPIs key performance indicators from 2017 to 2021. Major KPIs include RPAS Revenue per available seat, total passengers, number of flights, number of fatality etc. Deliver an awe inspiring pitch with this creative other operational and financials kpis key performance indicators clipart pdf bundle. Topics like other operational and financials kpis key performance indicators can be discussed with this completely editable template. It is available for immediate download depending on the needs and requirements of the user.
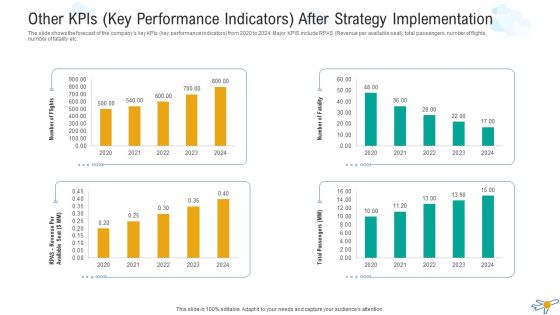
Other Kpis Key Performance Indicators After Strategy Implementation Microsoft PDF
The slide shows the forecast of the companys key KPIs key performance indicators from 2020 to 2024. Major KPIS include RPAS Revenue per available seat, total passengers, number of flights, number of fatality etc. Deliver and pitch your topic in the best possible manner with this other kpis key performance indicators after strategy implementation microsoft pdf. Use them to share invaluable insights on other kpis key performance indicators after strategy implementation and impress your audience. This template can be altered and modified as per your expectations. So, grab it now.
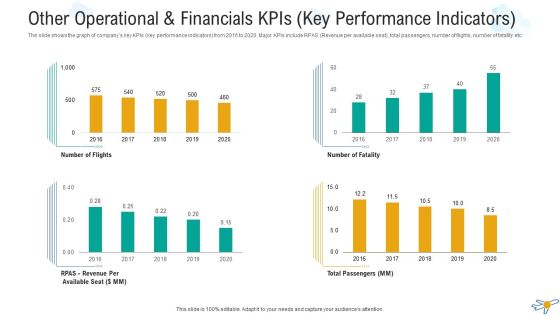
Other Operational And Financials Kpis Key Performance Indicators Professional PDF
The slide shows the graph of companys key KPIs key performance indicators from 2016 to 2020. Major KPIs include RPAS Revenue per available seat, total passengers, number of flights, number of fatality etc. Deliver an awe-inspiring pitch with this creative other operational and financials kpis key performance indicators professional pdf bundle. Topics like other operational and financials kpis key performance indicators can be discussed with this completely editable template. It is available for immediate download depending on the needs and requirements of the user.

Other Kpis Key Performance Indicators After Strategy Implementation Infographics PDF
The slide shows the forecast of the companys key KPIs key performance indicators from 2020 to 2024. Major KPIS include RPAS Revenue per available seat, total passengers, number of flights, number of fatality etc. Deliver and pitch your topic in the best possible manner with this other kpis key performance indicators after strategy implementation infographics pdf. Use them to share invaluable insights on other kpis key performance indicators after strategy implementation and impress your audience. This template can be altered and modified as per your expectations. So, grab it now.
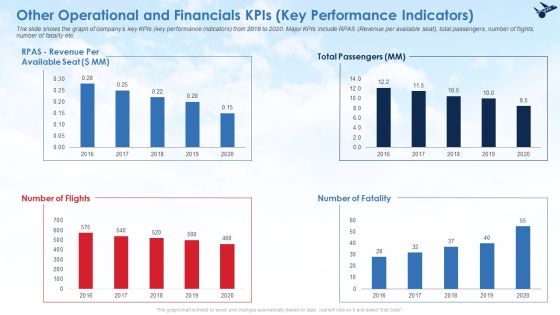
Other Operational And Financials Kpis Key Performance Indicators Ideas PDF
The slide shows the graph of companys key KPIs key performance indicators from 2016 to 2020. Major KPIs include RPAS Revenue per available seat, total passengers, number of flights, number of fatality etc. Deliver an awe inspiring pitch with this creative other operational and financials kpis key performance indicators ideas pdf bundle. Topics like other operational and financials kpis key performance indicators can be discussed with this completely editable template. It is available for immediate download depending on the needs and requirements of the user.

Advanced Human Resource Value Chain With Kpis Icons PDF
This slide shows advanced HR value chain with KPIs to demonstrate its role in achieving goals. It includes aspects such as HR enablers, activities, outcomes, strategic focus , and KPI for financial, process and customer. Showcasing this set of slides titled Advanced Human Resource Value Chain With Kpis Icons PDF. The topics addressed in these templates are Strategic Focus, Process Kpis, Customer Kpis. All the content presented in this PPT design is completely editable. Download it and make adjustments in color, background, font etc. as per your unique business setting.

Checklist To Align Business Service Delivery With Kpis Demonstration PDF
This slide define the checklists and guidelines to align business service delivery with KPIs and it includes defining KPIs, KPI discussion, IT culture development and integration of KPIs to consolidated dashboards. Slidegeeks is one of the best resources for PowerPoint templates. You can download easily and regulate Checklist To Align Business Service Delivery With Kpis Demonstration PDF for your personal presentations from our wonderful collection. A few clicks is all it takes to discover and get the most relevant and appropriate templates. Use our Templates to add a unique zing and appeal to your presentation and meetings. All the slides are easy to edit and you can use them even for advertisement purposes.
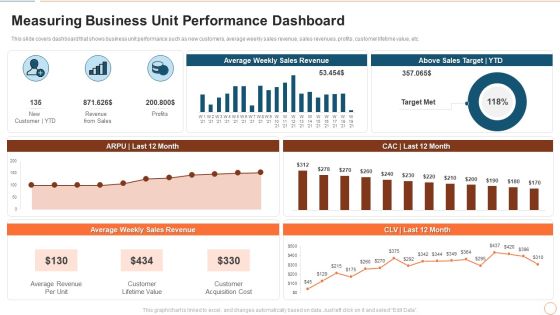
Illustrating Product Leadership Plan Incorporating Innovative Techniques Measuring Business Unit Professional PDF
This slide covers dashboard that shows business unit performance such as new customers, average weekly sales revenue, sales revenues, profits, customer lifetime value, etc. Deliver an awe inspiring pitch with this creative illustrating product leadership plan incorporating innovative techniques measuring business unit professional pdf bundle. Topics like average revenue per unit, customer lifetime value, customer acquisition cost can be discussed with this completely editable template. It is available for immediate download depending on the needs and requirements of the user.

Formulating Competitive Plan Of Action For Effective Product Leadership Measuring Business Unit Slides PDF
This slide covers dashboard that shows business unit performance such as new customers, average weekly sales revenue, sales revenues, profits, customer lifetime value, etc. Deliver an awe inspiring pitch with this creative formulating competitive plan of action for effective product leadership measuring business unit slides pdf bundle. Topics like average revenue per unit, customer lifetime value, customer acquisition cost can be discussed with this completely editable template. It is available for immediate download depending on the needs and requirements of the user.
Online Advertising KPIS Ppt PowerPoint Presentation Infographics Cpb
Presenting this set of slides with name online advertising kpis ppt powerpoint presentation infographics cpb. This is a three stage process. The stages in this process are online advertising kpis. This is a completely editable PowerPoint presentation and is available for immediate download. Download now and impress your audience.
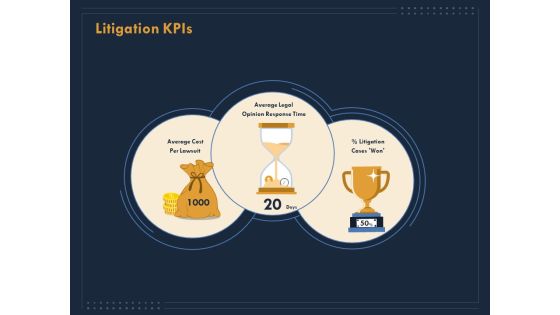
Enterprise Review Litigation Kpis Ppt Gallery Graphics Download PDF
Presenting enterprise review litigation kpis ppt gallery graphics download pdf to provide visual cues and insights. Share and navigate important information on three stages that need your due attention. This template can be used to pitch topics like litigation kpis. In addtion, this PPT design contains high resolution images, graphics, etc, that are easily editable and available for immediate download.
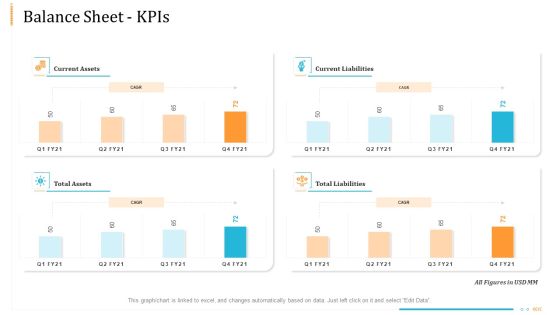
Enterprise Examination And Inspection Balance Sheet Kpis Designs PDF
Deliver and pitch your topic in the best possible manner with this enterprise examination and inspection balance sheet KPIs designs pdf. Use them to share invaluable insights on current assets, total liabilities, balance sheet KPIs and impress your audience. This template can be altered and modified as per your expectations. So, grab it now.
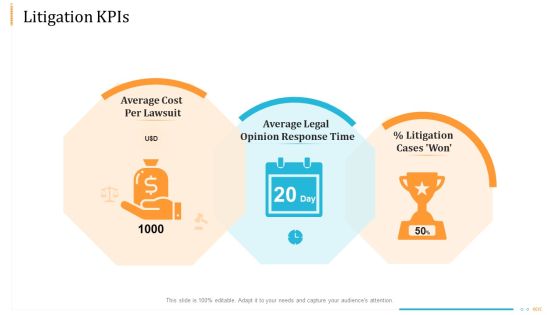
Enterprise Examination And Inspection Litigation Kpis Guidelines PDF
This is a enterprise examination and inspection litigation KPIs guidelines pdf template with various stages. Focus and dispense information on three stages using this creative set, that comes with editable features. It contains large content boxes to add your information on topics like litigation KPIs. You can also showcase facts, figures, and other relevant content using this PPT layout. Grab it now.
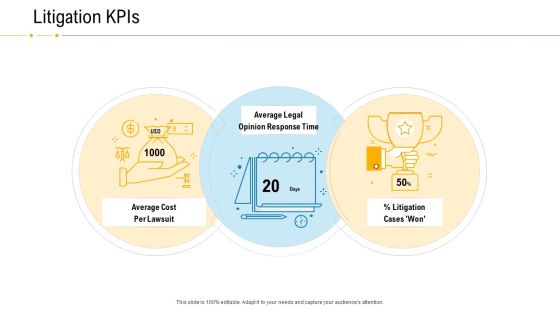
Financial Due Diligence For Business Organization Litigation Kpis Professional PDF
Presenting financial due diligence for business organization litigation kpis professional pdf to provide visual cues and insights. Share and navigate important information on three stages that need your due attention. This template can be used to pitch topics like litigation kpis. In addtion, this PPT design contains high resolution images, graphics, etc, that are easily editable and available for immediate download.
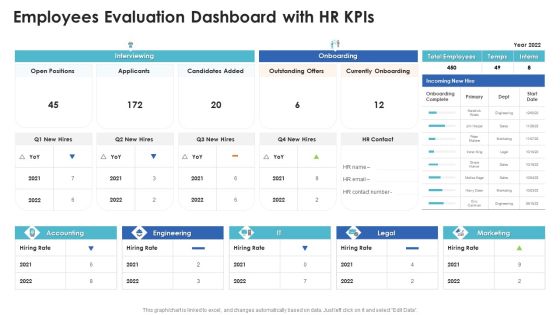
Employees Evaluation Dashboard With Hr Kpis Topics PDF
Showcasing this set of slides titled employees evaluation dashboard with hr kpis topics pdf. The topics addressed in these templates are employees evaluation dashboard with hr kpis. All the content presented in this PPT design is completely editable. Download it and make adjustments in color, background, font etc. as per your unique business setting.
Employee Competency Management With Kpis Icon Slides PDF
Persuade your audience using this employee competency management with kpis icon slides pdf. This PPT design covers four stages, thus making it a great tool to use. It also caters to a variety of topics including employee competency management with kpis icon. Download this PPT design now to present a convincing pitch that not only emphasizes the topic but also showcases your presentation skills.

Sales Pipeline Analysis Dashboard With Kpis Structure PDF
Showcasing this set of slides titled sales pipeline analysis dashboard with kpis structure pdf. The topics addressed in these templates are sales pipeline analysis dashboard with kpis. All the content presented in this PPT design is completely editable. Download it and make adjustments in color, background, font etc. as per your unique business setting.
Quarterly Employee Engagement Analysis Kpis Icon Themes PDF
Persuade your audience using this Quarterly Employee Engagement Analysis Kpis Icon Themes PDF. This PPT design covers three stages, thus making it a great tool to use. It also caters to a variety of topics including Quarterly Employee Engagement, Analysis Kpis Icon. Download this PPT design now to present a convincing pitch that not only emphasizes the topic but also showcases your presentation skills.

Business Program Kpis Dashboard Icon Ppt Portfolio Aids PDF
Presenting Business Program Kpis Dashboard Icon Ppt Portfolio Aids PDF to dispense important information. This template comprises three stages. It also presents valuable insights into the topics including Business Program, Kpis Dashboard, Icon. This is a completely customizable PowerPoint theme that can be put to use immediately. So, download it and address the topic impactfully.

Employee Development Program Assessment Kpis Icon Ppt Ideas Shapes PDF
Showcasing this set of slides titled Employee Development Program Assessment Kpis Icon Ppt Ideas Shapes PDF. The topics addressed in these templates are Employee Development, Program Assessment, Kpis Icon. All the content presented in this PPT design is completely editable. Download it and make adjustments in color, background, font etc. as per your unique business setting.

Dashboard Icon For Marketing Communication Kpis Performance Assessment Summary PDF
Presenting Dashboard Icon For Marketing Communication Kpis Performance Assessment Summary PDF to dispense important information. This template comprises four stages. It also presents valuable insights into the topics including Dashboard Icon, Marketing Communication, Kpis Performance, Assessment. This is a completely customizable PowerPoint theme that can be put to use immediately. So, download it and address the topic impactfully.
Organizations Information Safety Key Kpis Icon Elements PDF
Persuade your audience using this Organizations Information Safety Key Kpis Icon Elements PDF. This PPT design covers Three stages, thus making it a great tool to use. It also caters to a variety of topics including Organizations Information, Safety Key Kpis . Download this PPT design now to present a convincing pitch that not only emphasizes the topic but also showcases your presentation skills.

E Mail Marketing Campaign Outcomes Kpis Result Analysis Mockup PDF
Showcasing this set of slides titled E Mail Marketing Campaign Outcomes Kpis Result Analysis Mockup PDF. The topics addressed in these templates are Marketing Campaign, Outcomes Kpis, Result Analysis. All the content presented in this PPT design is completely editable. Download it and make adjustments in color, background, font etc. as per your unique business setting.

Icons Sldie Enhancing Client Experience By Evaluating Kpis Graphics PDF
Help your business to create an attention-grabbing presentation using our Icons Sldie Enhancing Client Experience By Evaluating Kpis Graphics PDF set of slides. The slide contains innovative icons that can be flexibly edited. Choose this Icons Sldie Enhancing Client Experience By Evaluating Kpis Graphics PDF template to create a satisfactory experience for your customers. Go ahead and click the download button.
Icon For Comparing Industrial Sector On Similar Kpis Template PDF
Presenting Icon For Comparing Industrial Sector On Similar Kpis Template PDF to dispense important information. This template comprises three stages. It also presents valuable insights into the topics including Comparing Industrial, Sector Similar Kpis. This is a completely customizable PowerPoint theme that can be put to use immediately. So, download it and address the topic impactfully.
Key Kpis For Manufacturing Companies Icon Infographics PDF
Pitch your topic with ease and precision using this Key Kpis For Manufacturing Companies Icon Infographics PDF. This layout presents information on Key Kpis For Manufacturing, Companies Icon. It is also available for immediate download and adjustment. So, changes can be made in the color, design, graphics or any other component to create a unique layout.
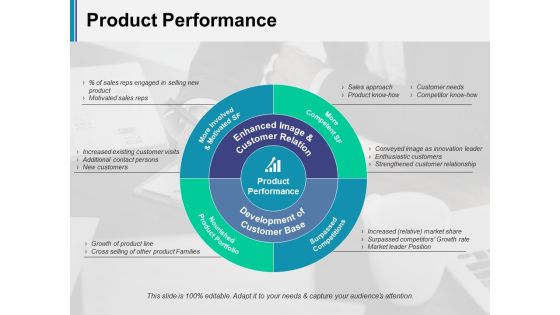
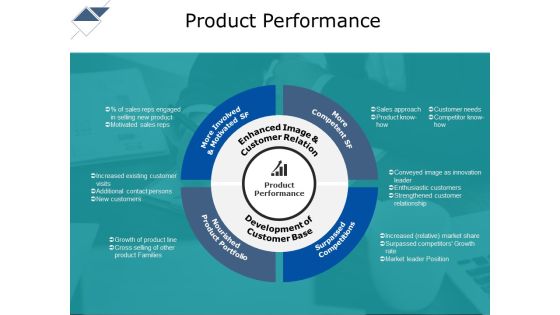
Product Performance Ppt Powerpoint Presentation Slides Styles
This is a product performance ppt powerpoint presentation slides styles. This is a four stage process. The stages in this process are product performance, surpassed competitions, nourished product portfolio, ore involved and motivated sf, development of customer base.
Product Performance Ppt PowerPoint Presentation Styles Pictures
This is a product performance ppt powerpoint presentation styles pictures. This is a four stage process. The stages in this process are product performance, sales approach, product, customer needs.
Other Kpis Key Performance Indicators After Strategy Implementation Professional PDF
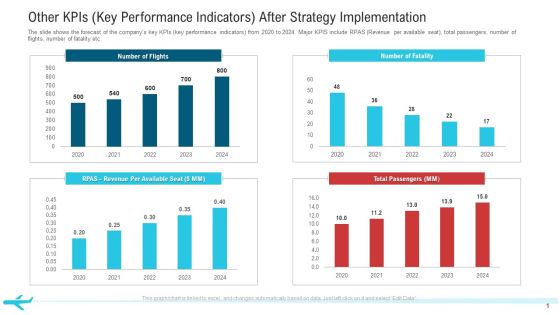
The slide shows the forecast of the companys key KPIs key performance indicators from 2020 to 2024. Major KPIS include RPAS Revenue per available seat, total passengers, number of flights, number of fatality etc.Deliver and pitch your topic in the best possible manner with this other KPIs key performance indicators after strategy implementation professional pdf. Use them to share invaluable insights on total passengers, number of flights, 2020 to 2024 and impress your audience. This template can be altered and modified as per your expectations. So, grab it now.

Post Implementation Other Operation And Financial Kpis Summary PDF
The slide provides five years graphs 2022F to 2026F forecasted number of major KPIs key performance indicators, that might help to track the performance of ABC Railway. Covered KPIs include Revenue, Total Passengers, operating income, customer satisfaction rate etc.Deliver and pitch your topic in the best possible manner with this post implementation other operation and financial KPIs summary pdf. Use them to share invaluable insights on total passengers, operating income, revenue, 2022 to 2026 and impress your audience. This template can be altered and modified as per your expectations. So, grab it now.

Post Implementation Other Operation And Financial Kpis Inspiration PDF
The slide provides five years graphs 2022F-2026F forecasted number of major KPIs key performance indicators, that might help to track the performance of ABC Railway. Covered KPIs include Revenue, Total Passengers, operating income, customer satisfaction rate etc. Deliver and pitch your topic in the best possible manner with this post implementation other operation and financial kpis inspiration pdf. Use them to share invaluable insights on revenue, operating income, customer satisfaction and impress your audience. This template can be altered and modified as per your expectations. So, grab it now.

5 Kpis Of Managing Business Relations Elements PDF
This slide provides information about 5 key performance indicators KPIs of business relationship management which is customer satisfaction, percentage of questionnaire returned, number of complaints, etc. These KPIs will help businesses in improvement of their as well as employee performance. Presenting 5 kpis of managing business relations elements pdf to dispense important information. This template comprises five stages. It also presents valuable insights into the topics including customer satisfaction, determined surveys. This is a completely customizable PowerPoint theme that can be put to use immediately. So, download it and address the topic impactfully.

Kpis For E Commerce Project Management Ppt Styles Outline PDF
Mentioned slide showcase various KPIs which can be used by a firm for e-Commerce project management. Total sales, number of orders, total customers, number of items, shopping cart abandonment rate and conversion rate are the KPIs highlighted in the slide. Showcasing this set of slides titled Kpis For E Commerce Project Management Ppt Styles Outline PDF. The topics addressed in these templates are Total Number Order, Number Customer, Total Number Items. All the content presented in this PPT design is completely editable. Download it and make adjustments in color, background, font etc. as per your unique business setting.

Major Kpis For Stock Performance Management Guidelines PDF
This slide shows important KPIs for inventory performance management for presenting all aspects related to inventory in defined manner. It include KPIs like perfect order management, inventory turnover and carrying cost etc. Presenting Major Kpis For Stock Performance Management Guidelines PDF to dispense important information. This template comprises Four stages. It also presents valuable insights into the topics including Perfect Order Performance, Inventory Turnover, Carrying Cost. This is a completely customizable PowerPoint theme that can be put to use immediately. So, download it and address the topic impactfully.

Dashboard To Track Kpis In Project Launch Strategy Pictures PDF
The following slide brings forth a dashboard to track important key performance indicators in a project rollout strategy with the purpose of tracking projects in real time with live data. The KPIs are tasks, progress, time, cost and workload. Showcasing this set of slides titled Dashboard To Track Kpis In Project Launch Strategy Pictures PDF. The topics addressed in these templates are Expenses, Project Launch Strategy, Dashboard To Track Kpis. All the content presented in this PPT design is completely editable. Download it and make adjustments in color, background, font etc. as per your unique business setting.

Growth Stage In Product Lifecycle With Tracking Kpis Diagrams PDF
This slide covers summary of growth stage in PLC to provide insights on KPIs essential for tracking product. It includes tracking KPIs. Want to ace your presentation in front of a live audience Our Growth Stage In Product Lifecycle With Tracking Kpis Diagrams PDF can help you do that by engaging all the users towards you. Slidegeeks experts have put their efforts and expertise into creating these impeccable powerpoint presentations so that you can communicate your ideas clearly. Moreover, all the templates are customizable, and easy to edit and downloadable. Use these for both personal and commercial use.

Operational Marketing Tactical Plan Kpis To Track Performance Background PDF
This slide provides KPIs to determine the overall effectiveness of the companys marketing plan. These include KPIs such as cost per lead, cost per customer acquisition, marketing rate of investment, sales qualified leads, and sales revenue. Presenting Operational Marketing Tactical Plan Kpis To Track Performance Background PDF to dispense important information. This template comprises five stages. It also presents valuable insights into the topics including Cost Per Lead, Cost Per Customer Acquisition, Sales Qualified Leads. This is a completely customizable PowerPoint theme that can be put to use immediately. So, download it and address the topic impactfully.
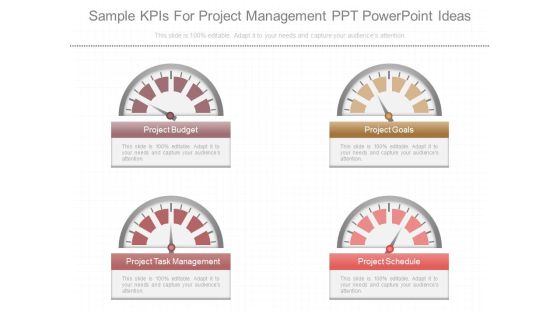
Sample Kpis For Project Management Ppt Powerpoint Ideas
This is a sample kpis for project management ppt powerpoint ideas. This is a four stage process. The stages in this process are project budget, project goals, project task management, project schedule.
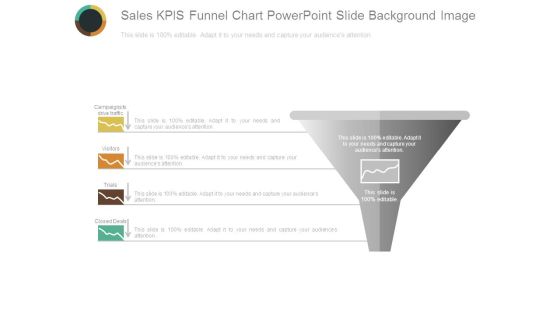
Sales Kpis Funnel Chart Powerpoint Slide Background Image
This is a sales kpis funnel chart powerpoint slide background image. This is a one stage process. The stages in this process are campaigns to drive traffic, visitors, trials, closed deals, sales.

Media Kpis Performance Evaluation Process Powerpoint Slide Backgrounds
This is a media kpis performance evaluation process powerpoint slide backgrounds. This is a three stage process. The stages in this process are traffic, engagement, conversion, purchases, installs, sign ups, video views, high value actions, website visitors.

Kpis For Media Campaigns Evaluation Ppt PowerPoint Presentation Deck
This is a kpis for media campaigns evaluation ppt powerpoint presentation deck. This is a three stage process. The stages in this process are traffic, engagement, conversion, website visitors.
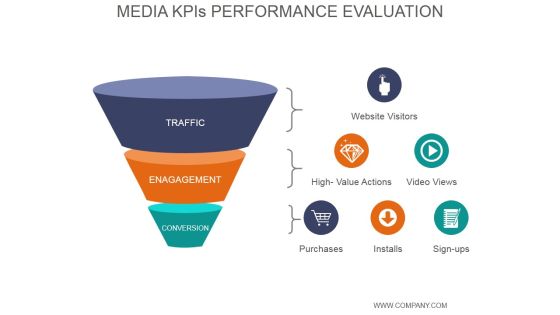
Media Kpis Performance Evaluation Ppt PowerPoint Presentation Tips
This is a media kpis performance evaluation ppt powerpoint presentation tips. This is a three stage process. The stages in this process are traffic, engagement, conversion, purchases, installs, sign ups, high value actions, video views, website visitors.

Media Kpis Performance Evaluation Ppt PowerPoint Presentation Topics
This is a media kpis performance evaluation ppt powerpoint presentation topics. This is a three stage process. The stages in this process are traffic, engagement, conversion, website, visitors, high value actions, video views, purchases, installs, sign ups.

Pandl Kpis Tabular Form Ppt PowerPoint Presentation Visual Aids
This is a pandl kpis tabular form ppt powerpoint presentation visual aids. This is a four stage process. The stages in this process are revenue, cogs, operating profit, net profit.

Cash Flow Statement Kpis Ppt PowerPoint Presentation Deck
This is a cash flow statement kpis ppt powerpoint presentation deck. This is a four stage process. The stages in this process are operations, financing activities, investing activities, net increase in cash.

Balance Sheet Kpis Ppt PowerPoint Presentation Model Example Topics
This is a balance sheet kpis ppt powerpoint presentation model example topics. This is a four stage process. The stages in this process are shareholders equity, trade payables, other current liabilities, short term provisions, current liabilities, total liabilities.
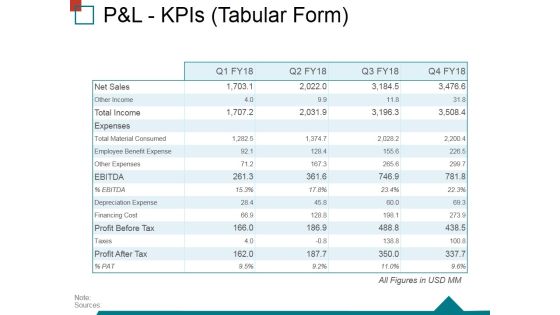
Pandl Kpis Tabular Form Ppt PowerPoint Presentation Ideas Structure
This is a pandl kpis tabular form ppt powerpoint presentation ideas structure. This is a four stage process. The stages in this process are operating profit, revenue, cogs, net profit.

Customer Service Kpis Template 2 Ppt PowerPoint Presentation Show Structure
This is a customer service kpis template 2 ppt powerpoint presentation show structure. This is a four stage process. The stages in this process are tickets by week, tickets by group, tickets by time of the day, tickets by medium.
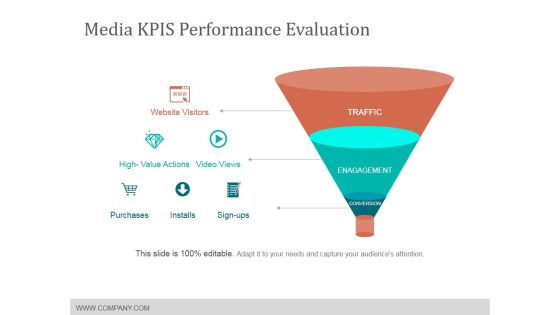
Media Kpis Performance Evaluation Ppt PowerPoint Presentation File Templates
This is a media kpis performance evaluation ppt powerpoint presentation file templates. This is a three stage process. The stages in this process are website visitors, purchases, installs, sign ups.

Balance Sheet Kpis Template 2 Ppt PowerPoint Presentation Ideas Graphics
This is a balance sheet kpis template 2 ppt powerpoint presentation ideas graphics. This is a four stage process. The stages in this process are current assets, current liabilities, total assets, total liabilities.

Balance Sheet Kpis Template 3 Ppt PowerPoint Presentation Slides Brochure
This is a balance sheet kpis template 3 ppt powerpoint presentation slides brochure. This is a four stage process. The stages in this process are current assets, current liabilities, total liabilities, total assets.

Balance Sheet Kpis Tabular Form Ppt PowerPoint Presentation Professional Display
This is a balance sheet kpis tabular form ppt powerpoint presentation professional display. This is a four stage process. The stages in this process are current assets, current liabilities, total assets, total liabilities.

Balance Sheet Kpis Template Ppt PowerPoint Presentation Slides Inspiration
This is a balance sheet kpis template ppt powerpoint presentation slides inspiration. This is a four stage process. The stages in this process are shareholders equity, short term borrowings, trade payables, other current liabilities.

Balance Sheet Kpis Ppt PowerPoint Presentation Infographics Example File
This is a balance sheet kpis ppt powerpoint presentation infographics example file. This is a four stage process. The stages in this process are current investments, inventories, trade receivables, cash and bank balances, current assets.
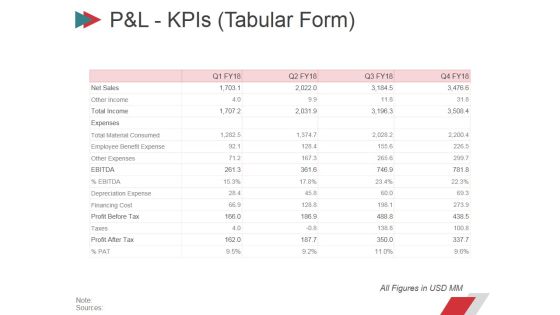
Pandl Kpis Tabular Form Ppt PowerPoint Presentation Summary Layout
This is a pandl kpis tabular form ppt powerpoint presentation summary layout. This is a four stage process. The stages in this process are revenue, cogs, operating profit, net profit.

Balance Sheet Kpis Template 1 Ppt PowerPoint Presentation Diagram Ppt
This is a balance sheet kpis template 1 ppt powerpoint presentation diagram ppt. This is a four stage process. The stages in this process are non current investments, current investments, inventories, trade receivables, trade receivables.

Balance Sheet Kpis Template 2 Ppt PowerPoint Presentation Portfolio Portrait
This is a balance sheet kpis template 2 ppt powerpoint presentation portfolio portrait. This is a four stage process. The stages in this process are shareholders equity, non current liabilities, short term borrowings, trade payables, other current liabilities.

Balance Sheet Kpis Template 2 Ppt PowerPoint Presentation Portfolio Example
This is a balance sheet kpis template 2 ppt powerpoint presentation portfolio example. This is a four stage process. The stages in this process are non current investments, long term loans and advances, other non current assets, current investments, inventories.

Balance Sheet Kpis Continued Ppt PowerPoint Presentation Templates
This is a balance sheet kpis continued ppt powerpoint presentation templates. This is a four stage process. The stages in this process are long term loans and advances, current investments, inventories, trade receivables, cash and bank balances.

Balance Sheet Kpis Tabular Form Ppt PowerPoint Presentation Infographics Good
This is a balance sheet kpis tabular form ppt powerpoint presentation infographics good. This is a four stage process. The stages in this process are current assets, current liabilities, total assets, total liabilities.

Balance Sheet Kpis Ppt PowerPoint Presentation Portfolio Microsoft
This is a balance sheet kpis ppt powerpoint presentation portfolio microsoft. This is a four stage process. The stages in this process are shareholders equity, non current liabilities, short term borrowings, trade payables, other current liabilities.

Pandl Kpis Tabular Form Ppt PowerPoint Presentation File Design Templates
This is a pandl kpis tabular form ppt powerpoint presentation file design templates. This is a four stage process. The stages in this process are revenue, cogs, operating profit, net profit.

Pandl Kpis Ppt PowerPoint Presentation Infographic Template Layout
This is a pandl kpis ppt powerpoint presentation infographic template layout. This is a four stage process. The stages in this process are net sales, other income, total income, expenses, total material consumed.

Balance Sheet Kpis Ppt PowerPoint Presentation Ideas Graphics Pictures
This is a balance sheet kpis ppt powerpoint presentation ideas graphics pictures. This is a four stage process. The stages in this process are trade payables, other current liabilities, short term provisions, current liabilities, total liabilities.
Pandl Kpis Tabular Form Ppt PowerPoint Presentation Gallery Icon
This is a pandl kpis tabular form ppt powerpoint presentation gallery icon. This is a four stage process. The stages in this process are revenue, cogs, operating profit, net profit.

P And L Kpis Ppt PowerPoint Presentation Portfolio Slide
This is a p and l kpis ppt powerpoint presentation portfolio slide. This is a four stage process. The stages in this process are ebitda, profit before tax, profit after tax, expenses, net sales.
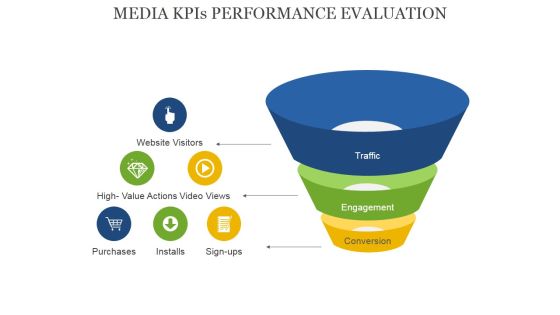
Media Kpis Performance Evaluation Ppt PowerPoint Presentation Professional Demonstration
This is a media kpis performance evaluation ppt powerpoint presentation professional demonstration. This is a three stage process. The stages in this process are website visitors, high value actions, purchases, installs, sign ups, conversion.

Channel Kpis Template Ppt PowerPoint Presentation Show Portfolio
This is a channel kpis template ppt powerpoint presentation show portfolio. This is a four stage process. The stages in this process are sales density, personnel cost, real estate cost, inventory turnover.

Balance Sheet Kpis Ppt PowerPoint Presentation Infographics Inspiration
This is a balance sheet kpis ppt powerpoint presentation infographics inspiration. This is a four stage process. The stages in this process are shareholders equity, trade payables, other current liabilities, current liabilities.
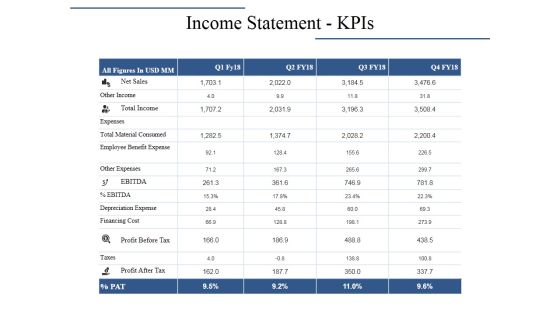
Income Statement Kpis Ppt PowerPoint Presentation Layouts Graphics Pictures
This is a income statement kpis ppt powerpoint presentation layouts graphics pictures. This is a four stage process. The stages in this process are net sales, total income, other income, profit before tax, expenses.

Balance Sheet Kpis Ppt PowerPoint Presentation Show Designs
This is a balance sheet kpis ppt powerpoint presentation show designs. This is a four stage process. The stages in this process are shareholders equity, non current liabilities, trade payables, total liabilities.
Income Statement Kpis Ppt PowerPoint Presentation Icon Background Images
This is a income statement kpis ppt powerpoint presentation icon background images. This is a four stage process. The stages in this process are net sales, other income, expenses, other expenses, total material consumed.

Balance Sheet Kpis Ppt PowerPoint Presentation Gallery Brochure
This is a balance sheet kpis ppt powerpoint presentation gallery brochure. This is a four stage process. The stages in this process are shareholders equity, non current liabilities, short term borrowings, trade payables, other current liabilities.

Income Statement Kpis Ppt PowerPoint Presentation Styles Clipart Images
This is a income statement kpis ppt powerpoint presentation styles clipart images. This is a four stage process. The stages in this process are net sales, other income, total income, expenses, total material consumed.

Cash Flow Statement Kpis Ppt PowerPoint Presentation File Styles
This is a cash flow statement kpis ppt powerpoint presentation file styles. This is a four stage process. The stages in this process are management, business, marketing, compere, strategy.

Cash Flow Statement Kpis Template 1 Ppt PowerPoint Presentation Templates
This is a cash flow statement kpis template 1 ppt powerpoint presentation templates. This is a four stage process. The stages in this process are cash flow from operations, cash flow from investing activities, cash flow from financing activities.

Cash Flow Statement Kpis Ppt PowerPoint Presentation Summary Graphics
This is a cash flow statement kpis ppt powerpoint presentation summary graphics. This is a four stage process. The stages in this process are business, compare sheet, management, analysis, strategy.
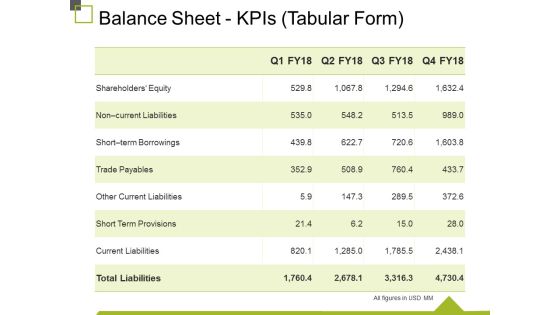
Balance Sheet Kpis Tabular Form Ppt PowerPoint Presentation Gallery Example
This is a balance sheet kpis tabular form ppt powerpoint presentation gallery example. This is a four stage process. The stages in this process are trade payables, other current liabilities, short term provisions, current liabilities, total liabilities.

Balance Sheet Kpis Ppt PowerPoint Presentation Visual Aids Inspiration
This is a balance sheet kpis ppt powerpoint presentation visual aids inspiration. This is a four stage process. The stages in this process are current assets, current liabilities, total liabilities, total assets, business.

Cash Flow Statement Kpis Ppt PowerPoint Presentation Ideas Graphics
This is a cash flow statement kpis ppt powerpoint presentation ideas graphics. This is a four stage process. The stages in this process are operation, financing activities, net increase in cash, investing activities, business.
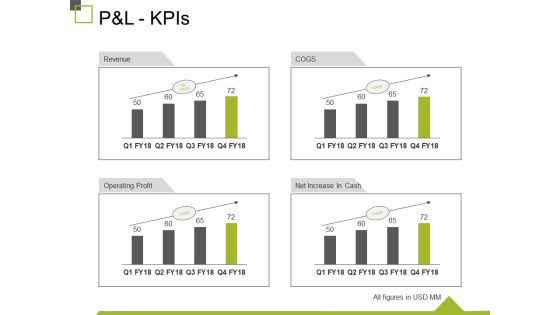
P And L Kpis Ppt PowerPoint Presentation Show Design Inspiration
This is a p and l kpis ppt powerpoint presentation show design inspiration. This is a four stage process. The stages in this process are revenue, operating profit, cogs, net increase in cash, business.

Balance Sheet Kpis Template 1 Ppt PowerPoint Presentation Gallery Visuals
This is a balance sheet kpis template 1 ppt powerpoint presentation gallery visuals. This is a four stage process. The stages in this process are business, table, management, analysis, success.

Balance Sheet Kpis Template 2 Ppt PowerPoint Presentation Ideas Show
This is a balance sheet kpis template 2 ppt powerpoint presentation ideas show. This is a four stage process. The stages in this process are current assets, total assets, total liabilities, current liabilities.
Balance Sheet Kpis Tabular Form Ppt PowerPoint Presentation Show Icons
This is a balance sheet kpis tabular form ppt powerpoint presentation show icons. This is a four stage process. The stages in this process are current assets, total assets, total liabilities, current liabilities.

Balance Sheet Kpis Ppt PowerPoint Presentation Styles Clipart
This is a balance sheet kpis ppt powerpoint presentation styles clipart. This is a four stage process. The stages in this process are current liabilities, short term provisions, other current liabilities, trade payables, shareholders equity.

Pandl Kpis Tabular Form Ppt PowerPoint Presentation Pictures Visual Aids
This is a pandl kpis tabular form ppt powerpoint presentation pictures visual aids. This is a four stage process. The stages in this process are revenue, operating profit, cogs, net profit.
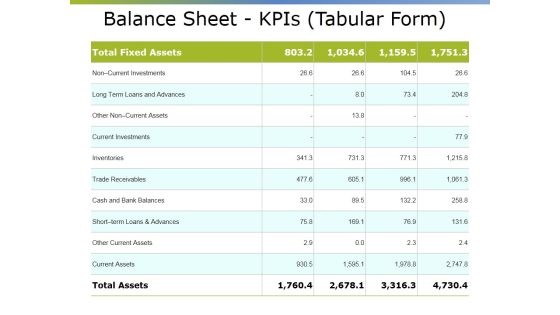
Balance Sheet Kpis Tabular Form Ppt PowerPoint Presentation Outline Gridlines
This is a balance sheet kpis tabular form ppt powerpoint presentation outline gridlines. This is a four stage process. The stages in this process are long term loans and advances, current investments, inventories, trade receivables, cash and bank balances.

Balance Sheet Kpis Template 1 Ppt PowerPoint Presentation Gallery Ideas
This is a balance sheet kpis template 1 ppt powerpoint presentation gallery ideas. This is a four stage process. The stages in this process are total fixed assets, non current investments, long term loans and advances, current investments, inventories.

Balance Sheet Kpis Template Ppt PowerPoint Presentation Summary Portfolio
This is a balance sheet kpis template ppt powerpoint presentation summary portfolio. This is a four stage process. The stages in this process are current liabilities, short term provisions, other current liabilities, trade payables, total liabilities.

Balance Sheet Kpis Ppt PowerPoint Presentation Layouts Design Ideas
This is a balance sheet kpis ppt powerpoint presentation layouts design ideas. This is a four stage process. The stages in this process are current assets, current liabilities, total assets, total liabilities.
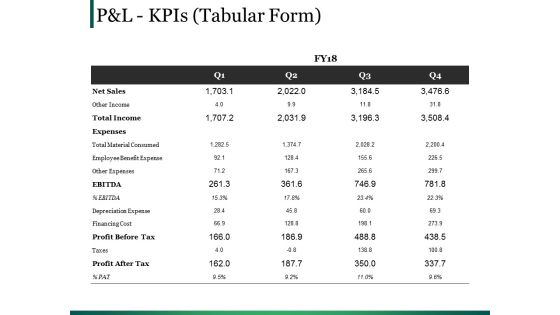
Pandl Kpis Template 1 Ppt PowerPoint Presentation Infographics Tips
This is a pandl kpis template 1 ppt powerpoint presentation infographics tips. This is a four stage process. The stages in this process are ebitda, total income, table, cost, management.
Pandl Kpis Template Ppt PowerPoint Presentation Model Icon
This is a pandl kpis template ppt powerpoint presentation model icon. This is a four stage process. The stages in this process are revenue, cogs, operating profit, net profit.

Balance Sheet Kpis Ppt PowerPoint Presentation Infographics Good
This is a balance sheet kpis ppt powerpoint presentation infographics good. This is a four stage process. The stages in this process are current assets, current liabilities, total assets, total liabilities.
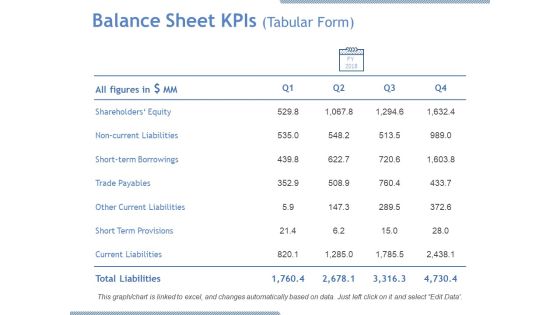
Balance Sheet Kpis Tabular Form Ppt PowerPoint Presentation Gallery Examples
This is a balance sheet kpis tabular form ppt powerpoint presentation gallery examples. This is a four stage process. The stages in this process are shareholders equity, trade payables, short term provisions, current liabilities, total liabilities.

Balance Sheet Kpis Ppt PowerPoint Presentation Infographic Template Inspiration
This is a balance sheet kpis ppt powerpoint presentation infographic template inspiration. This is a four stage process. The stages in this process are current assets, current liabilities, total assets, total liabilities.

Cash Flow Statement Kpis Ppt PowerPoint Presentation Model Samples
This is a cash flow statement kpis ppt powerpoint presentation model samples. This is a four stage process. The stages in this process are operations, financing activities, investing activities, increase in cash.

Litigation Kpis Ppt PowerPoint Presentation Layouts Clipart Images
This is a litigation kpis ppt powerpoint presentation layouts clipart images. This is a three stage process. The stages in this process are average cost per lawsuit, litigation cases won, average legal opinion response time.

P And L Kpis Ppt PowerPoint Presentation Designs Download
This is a p and l kpis ppt powerpoint presentation designs download. This is a four stage process. The stages in this process are revenue, cogs, operating profit, net profit.

Balance Sheet Kpis Template Ppt PowerPoint Presentation Gallery Inspiration
This is a balance sheet kpis template ppt powerpoint presentation gallery inspiration. This is a four stage process. The stages in this process are all figures in, non current liabilities, short term borrowings, trade payables, other current liabilities.

Balance Sheet Kpis Ppt PowerPoint Presentation Inspiration Information
This is a balance sheet kpis ppt powerpoint presentation inspiration information. This is a four stage process. The stages in this process are long term loans and advances, current investments, inventories, trade receivables.

Cash Flow Statement Kpis Template Ppt PowerPoint Presentation Pictures Diagrams
This is a cash flow statement kpis template ppt powerpoint presentation pictures diagrams. This is a four stage process. The stages in this process are operations, financing activities, investing activities, net increase in cash.
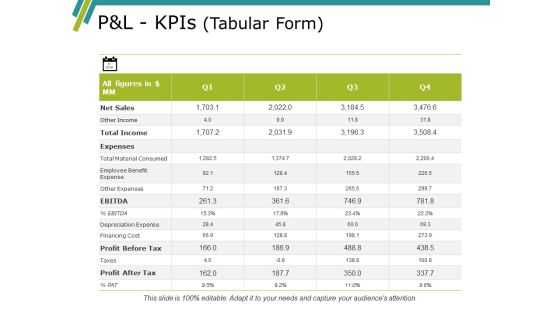
Pandl Kpis Template Ppt PowerPoint Presentation Gallery Summary
This is a pandl kpis template ppt powerpoint presentation gallery summary. This is a four stage process. The stages in this process are revenue, cogs, operating profit, net profit.
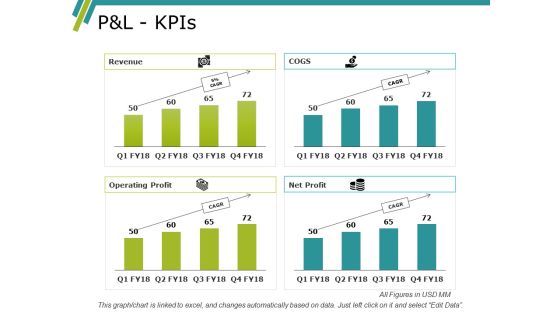
Pandl Kpis Ppt PowerPoint Presentation Slides Designs Download
This is a pandl kpis ppt powerpoint presentation slides designs download. This is a four stage process. The stages in this process are net sales, table, planning, cost, management.

Balance Sheet Kpis Tabular Formcont Ppt PowerPoint Presentation Infographics Visuals
This is a balance sheet kpis tabular formcont ppt powerpoint presentation infographics visuals. This is a four stage process. The stages in this process are noncurrent, investments, long term loans and advances, current investments, inventories.

Balance Sheet Kpis Ppt PowerPoint Presentation Infographic Template Designs
This is a balance sheet kpis ppt powerpoint presentation infographic template designs. This is a four stage process. The stages in this process are business, marketing, finance, graph, strategy.

Pandl Kpis Tabular Form Ppt PowerPoint Presentation Outline Background
This is a pandl kpis tabular form ppt powerpoint presentation outline background. This is a four stage process. The stages in this process are net sales, expenses, ebitda, profit before tax, profit after tax.
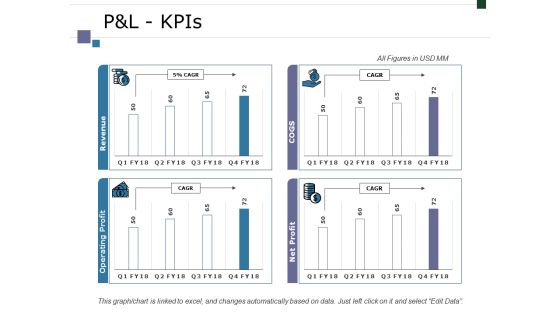
Pandl Kpis Ppt PowerPoint Presentation Infographic Template Graphics Tutorials
This is a pandl kpis ppt powerpoint presentation infographic template graphics tutorials. This is a four stage process. The stages in this process are business, marketing, finance, graph, strategy.

Balance Sheet Kpis Continue Ppt PowerPoint Presentation Slides File Formats
This is a balance sheet kpis continue ppt powerpoint presentation slides file formats. This is a four stage process. The stages in this process are balance sheet, finance, marketing, strategy, business.

Balance Sheet Kpis Template 1 Ppt PowerPoint Presentation Pictures Grid
This is a balance sheet kpis template 1 ppt powerpoint presentation pictures grid. This is a four stage process. The stages in this process are current assets, current liabilities, total assets, total liabilities.

Balance Sheet Kpis Template 2 Ppt PowerPoint Presentation Portfolio Icons
This is a balance sheet kpis template 2 ppt powerpoint presentation portfolio icons. This is a four stage process. The stages in this process are balance sheet, finance, marketing, strategy, business.
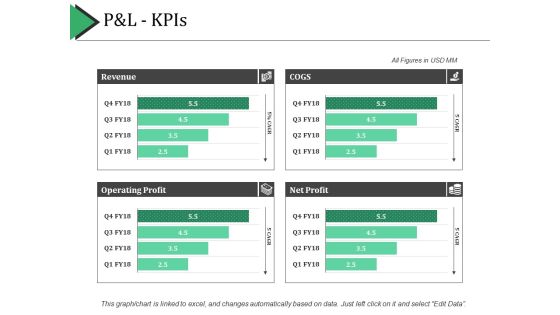
P And L Kpis Ppt PowerPoint Presentation Show Example Introduction
This is a p and l kpis ppt powerpoint presentation show example introduction. This is a four stage process. The stages in this process are revenue, cogs, net profit, operating profit.

Balance Sheet Kpis Ppt PowerPoint Presentation Model Layout Ideas
This is a balance sheet kpis ppt powerpoint presentation model layout ideas. This is a four stage process. The stages in this process are current assets, current liabilities, total assets, total liabilities.
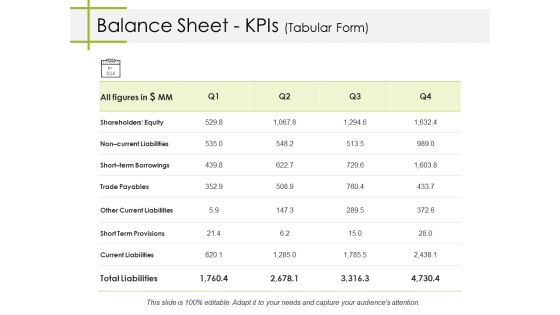
Balance Sheet Kpis Tabular Form Ppt PowerPoint Presentation Pictures Gridlines
This is a balance sheet kpis tabular form ppt powerpoint presentation pictures gridlines. This is a four stage process. The stages in this process are trade payables, other current liabilities, short term provisions, current liabilities, short term borrowings.

Balance Sheet Kpis Ppt PowerPoint Presentation Summary Designs Download
This is a balance sheet kpis ppt powerpoint presentation summary designs download. This is a four stage process. The stages in this process are current assets, current liabilities, total liabilities, operating profit, business.

Cash Flow Statement Kpis Ppt PowerPoint Presentation Styles Themes
This is a cash flow statement kpis ppt powerpoint presentation styles themes. This is a four stage process. The stages in this process are business, operations, operating profit, total liabilities, current liabilities.
Pandl Kpis Tabular Form Ppt PowerPoint Presentation Icon
This is a pandl kpis tabular form ppt powerpoint presentation icon. This is a four stage process. The stages in this process are business, net sales, total income, expenses, profit before tax, profit after tax.

Cash Flow Statement Kpis Ppt PowerPoint Presentation Pictures Graphics
This is a cash flow statement kpis ppt powerpoint presentation pictures graphics. This is a four stage process. The stages in this process are business, marketing, graph, finance, strategy.
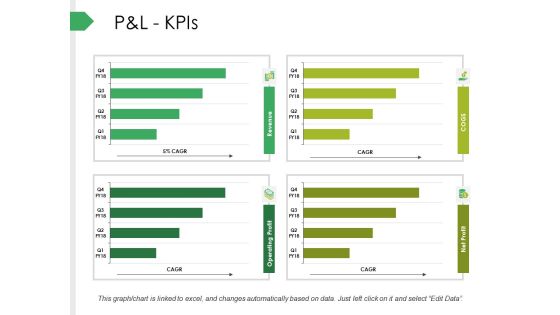
P And L Kpis Ppt PowerPoint Presentation Infographics Background
This is a p and l kpis ppt powerpoint presentation infographics background. This is a four stage process. The stages in this process are net sales, expenses, ebitda, profit before tax, profit after tax.

Balance Sheet Kpis Template 1 Ppt PowerPoint Presentation Show Inspiration
This is a balance sheet kpis template 1 ppt powerpoint presentation show inspiration. This is a four stage process. The stages in this process are business, marketing, graph, current liabilities, total liabilities.

Balance Sheet Kpis Template 2 Ppt PowerPoint Presentation Gallery Example
This is a balance sheet kpis template 2 ppt powerpoint presentation gallery example. This is a four stage process. The stages in this process are business, marketing, graph, current liabilities, total liabilities.

Balance Sheet Kpis Ppt PowerPoint Presentation Slides Download
This is a balance sheet kpis ppt powerpoint presentation slides download. This is a four stage process. The stages in this process are current assets, total assets, current liabilities, total liabilities, business.
Ecommerce Kpis Reach Act Convert Engage Ppt PowerPoint Presentation Icon
This is a ecommerce kpis reach act convert engage ppt powerpoint presentation icon. This is a five stage process. The stages in this process are kpi proposal, kpi plan, kpi scheme.
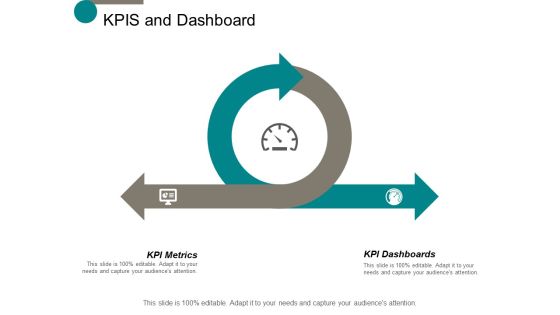
Kpis And Dashboard Ppt Powerpoint Presentation Infographic Template Portfolio
This is a kpis and dashboard ppt powerpoint presentation infographic template portfolio. This is a two stage process. The stages in this process are business, management, planning, strategy, marketing.

Balance Sheet Kpis Current Investments Ppt Powerpoint Presentation Professional Deck
This is a balance sheet kpis current investments ppt powerpoint presentation professional deck. This is a four stage process. The stages in this process are business, management, planning, strategy, marketing.

Balance Sheet Kpis Trade Payables Ppt Powerpoint Presentation Gallery Icon
This is a balance sheet kpis trade payables ppt powerpoint presentation gallery icon. This is a four stage process. The stages in this process are finance, marketing, management, investment, analysis.
 Home
Home