Manufacturing Kpi
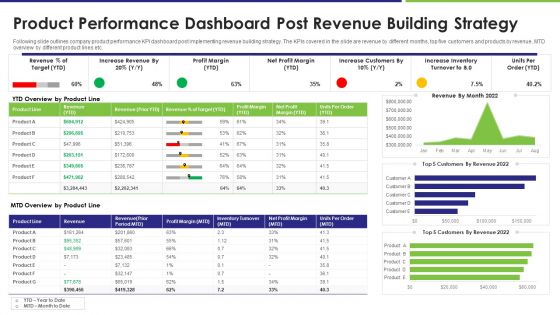
Product Performance Dashboard Post Revenue Building Strategy Brochure PDF
Following slide outlines company product performance KPI dashboard post implementing revenue building strategy. The KPIs covered in the slide are revenue by different months, top five customers and products by revenue, MTD overview by different product lines etc. Showcasing this set of slides titled product performance dashboard post revenue building strategy brochure pdf. The topics addressed in these templates are revenue, target, profit margin. All the content presented in this PPT design is completely editable. Download it and make adjustments in color, background, font etc. as per your unique business setting.
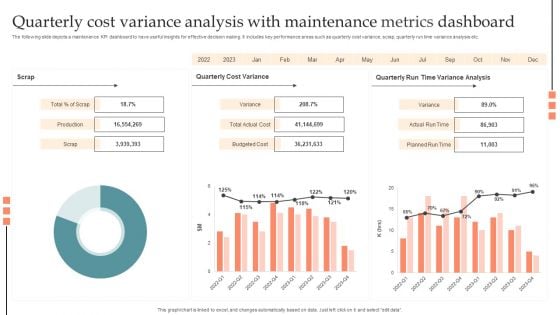
Quarterly Cost Variance Analysis With Maintenance Metrics Dashboard Information PDF
The following slide depicts a maintenance KPI dashboard to have useful insights for effective decision making. It includes key performance areas such as quarterly cost variance, scrap, quarterly run time variance analysis etc. Pitch your topic with ease and precision using this Quarterly Cost Variance Analysis With Maintenance Metrics Dashboard Information PDF. This layout presents information on Production, Budgeted Cost, Planned Run Time, Actual Run Time. It is also available for immediate download and adjustment. So, changes can be made in the color, design, graphics or any other component to create a unique layout.
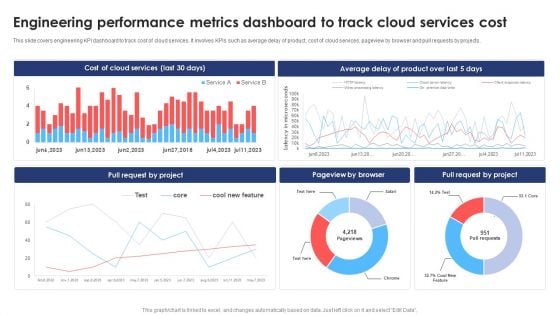
Engineering Performance Metrics Dashboard To Track Cloud Services Cost Clipart PDF
This slide covers engineering KPI dashboard to track cost of cloud services. It involves KPIs such as average delay of product, cost of cloud services, pageview by browser and pull requests by projects. Showcasing this set of slides titled Engineering Performance Metrics Dashboard To Track Cloud Services Cost Clipart PDF. The topics addressed in these templates are Cost Of Cloud Services, Average, Product. All the content presented in this PPT design is completely editable. Download it and make adjustments in color, background, font etc. as per your unique business setting.
Organizational Program To Improve Team Productivity And Efficiency Scorecard Highlighting Icons PDF
In this slide we provide a scorecard for highlighting expected team performance based on KPI parameters such as leadership, trust, communication etc. It provides rating based on current and expected skill level ranging between 1 to 5.Deliver an awe inspiring pitch with this creative organizational program to improve team productivity and efficiency scorecard highlighting icons pdf bundle. Topics like professional knowledge, communication, expected improvement variance can be discussed with this completely editable template. It is available for immediate download depending on the needs and requirements of the user.
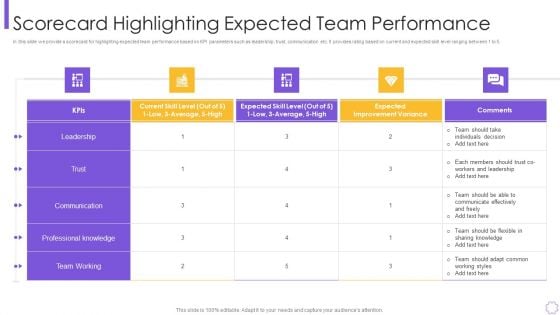
Process Optimization Through Product Life Process Management Techniques Scorecard Rules Portrait PDF
In this slide we provide a scorecard for highlighting expected team performance based on KPI parameters such as leadership, trust, communication etc. It provides rating based on current and expected skill level ranging between 1 to 5.Deliver an awe inspiring pitch with this creative process optimization through product life process management techniques scorecard rules portrait pdf bundle. Topics like professional knowledge, communication, individuals decision can be discussed with this completely editable template. It is available for immediate download depending on the needs and requirements of the user.
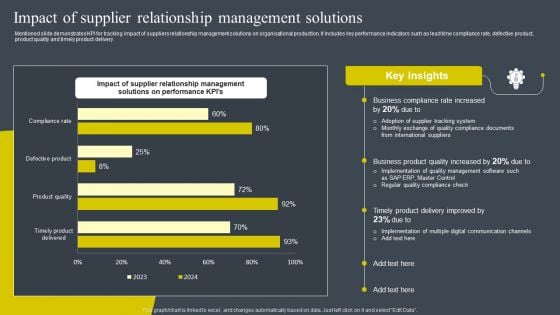
Impact Of Supplier Relationship Management Solutions Rules PDF
Mentioned slide demonstrates KPI for tracking impact of suppliers relationship management solutions on organisational production. It includes key performance indicators such as lead time compliance rate, defective product, product quality and timely product delivery. The best PPT templates are a great way to save time, energy, and resources. Slidegeeks have 100 percent editable powerpoint slides making them incredibly versatile. With these quality presentation templates, you can create a captivating and memorable presentation by combining visually appealing slides and effectively communicating your message. Download Impact Of Supplier Relationship Management Solutions Rules PDF from Slidegeeks and deliver a wonderful presentation.
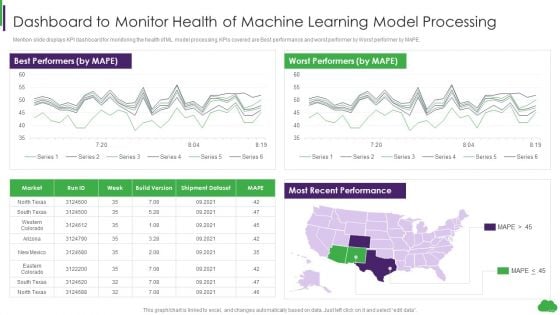
Using Ml And Devops In Product Development Process Dashboard To Monitor Health Of Machine Learning Themes PDF
Mention slide displays KPI dashboard for monitoring the health of ML model processing. KPIs covered are Best performance and worst performer by Worst performer by MAPE. Deliver and pitch your topic in the best possible manner with this Using Ml And Devops In Product Development Process Dashboard To Monitor Health Of Machine Learning Themes PDF. Use them to share invaluable insights on Learning Model Processing, Monitor Health , Dashboard and impress your audience. This template can be altered and modified as per your expectations. So, grab it now.
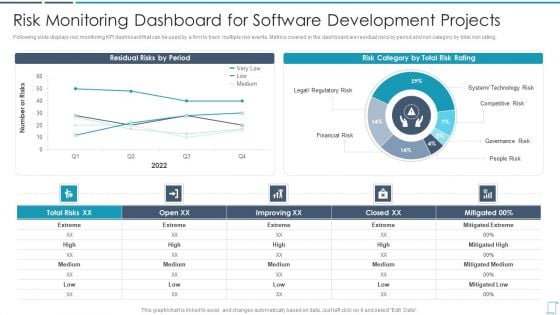
Professional Scrum Master Training IT Risk Monitoring Dashboard For Software Development Projects Icons PDF
Following slide displays risk monitoring KPI dashboard that can be used by a firm to track multiple risk events. Metrics covered in the dashboard are residual risk by period and category by total risk rating. Deliver an awe inspiring pitch with this creative professional scrum master training it risk monitoring dashboard for software development projects icons pdf bundle. Topics like financial risk, people risk, governance risk, competitive risk, system or technology can be discussed with this completely editable template. It is available for immediate download depending on the needs and requirements of the user.
Professional Scrum Master Certification Training Program IT Risk Monitoring Dashboard Background PDF
Following slide displays risk monitoring KPI dashboard that can be used by a firm to track multiple risk events. Metrics covered in the dashboard are residual risks by period and risk category by total risk rating.Deliver an awe inspiring pitch with this creative professional scrum master certification training program it risk monitoring dashboard background pdf bundle. Topics like competitive risk, governance risk, people risk can be discussed with this completely editable template. It is available for immediate download depending on the needs and requirements of the user.
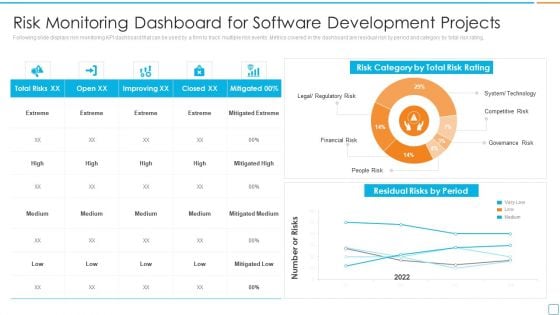
Professional Scrum Master Certification Risk Monitoring Dashboard For Software Development Portrait PDF
Following slide displays risk monitoring KPI dashboard that can be used by a firm to track multiple risk events. Metrics covered in the dashboard are residual risk by period and category by total risk rating. Deliver an awe inspiring pitch with this creative professional scrum master certification risk monitoring dashboard for software development portrait pdf bundle. Topics like residual risks by period, risk category, total risk rating can be discussed with this completely editable template. It is available for immediate download depending on the needs and requirements of the user.
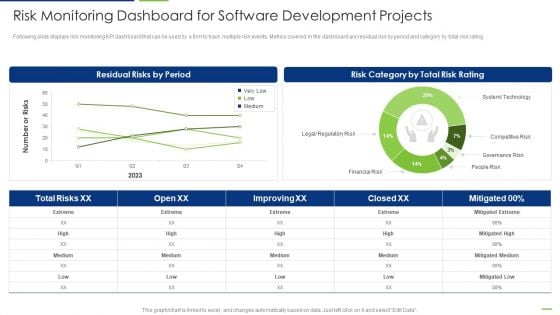
Professional Scrum Master Risk Monitoring Dashboard For Software Development Projects Designs PDF
Following slide displays risk monitoring KPI dashboard that can be used by a firm to track multiple risk events. Metrics covered in the dashboard are residual risk by period and category by total risk rating. Deliver an awe inspiring pitch with this creative Professional Scrum Master Risk Monitoring Dashboard For Software Development Projects Designs PDF bundle. Topics like Residual Risks By Period, Risk Category By Total Risk Rating, Total Risks can be discussed with this completely editable template. It is available for immediate download depending on the needs and requirements of the user.
Customer Relationship Management Software CRM Dashboard For Tracking Sales Pipeline Background PDF
This slide covers the CRM KPI dashboard for monitoring lead status in the sales funnel. It includes metrics such as open pipeline value, open pipeline by product package, pipeline value forecast, etc. Deliver and pitch your topic in the best possible manner with this Customer Relationship Management Software CRM Dashboard For Tracking Sales Pipeline Background PDF. Use them to share invaluable insights on Product Package, Pipeline Value, Value Forecast and impress your audience. This template can be altered and modified as per your expectations. So, grab it now.
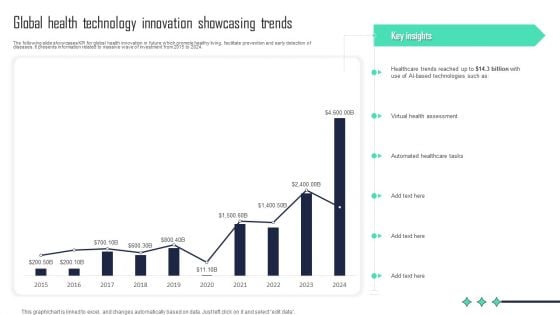
Global Health Technology Innovation Showcasing Trends Formats PDF
The following slide showcases KPI for global health innovation in future which promote healthy living, facilitate prevention and early detection of diseases. It presents information related to massive wave of investment from 2015 to 2024. Showcasing this set of slides titled Global Health Technology Innovation Showcasing Trends Formats PDF. The topics addressed in these templates are Virtual Health Assessment, Automated Healthcare Tasks, Key Insights. All the content presented in this PPT design is completely editable. Download it and make adjustments in color, background, font etc. as per your unique business setting.
Business Plan Methods Tools And Templates Set 2 OGSM Framework Model Converts Strategy Into Action Icons PDF
This slide covers the objectives, goals, strategies and measures model of a digital marketing firm. This is a business plan methods tools and templates set 2 ogsm framework model converts strategy into action icons pdf template with various stages. Focus and dispense information on four stages using this creative set, that comes with editable features. It contains large content boxes to add your information on topics like goals, strategies, kpi measure, tactical actions. You can also showcase facts, figures, and other relevant content using this PPT layout. Grab it now.

Strategic Business Plan Effective Tools Ogsm Framework Model Converts Strategy Into Action Background PDF
This slide covers the objectives, goals, strategies and measures model of a digital marketing firm. This is a strategic business plan effective tools ogsm framework model converts strategy into action background pdf template with various stages. Focus and dispense information on four stages using this creative set, that comes with editable features. It contains large content boxes to add your information on topics like goals, strategies, kpi measure, tactical actions. You can also showcase facts, figures, and other relevant content using this PPT layout. Grab it now.
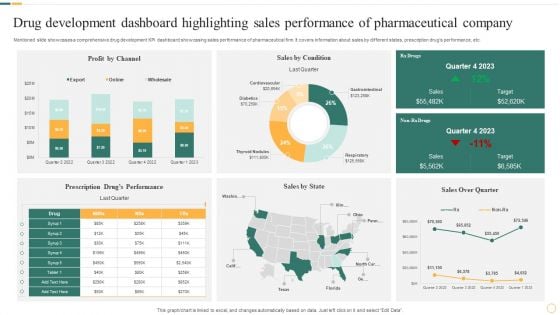
Drug Development Dashboard Highlighting Sales Performance Of Pharmaceutical Company Microsoft PDF
Mentioned slide showcases a comprehensive drug development KPI dashboard showcasing sales performance of pharmaceutical firm. It covers information about sales by different states, prescription drugs performance, etc. Pitch your topic with ease and precision using this Drug Development Dashboard Highlighting Sales Performance Of Pharmaceutical Company Microsoft PDF. This layout presents information on Sales By Condition, Profit By Channel, Sales By State. It is also available for immediate download and adjustment. So, changes can be made in the color, design, graphics or any other component to create a unique layout.
CRM System Implementation Stages CRM Dashboard For Tracking Sales Pipeline Background PDF
This slide covers the CRM KPI dashboard for monitoring lead status in the sales funnel. It includes metrics such as open pipeline value, open pipeline by product package, pipeline value forecast, etc. Deliver and pitch your topic in the best possible manner with this CRM System Implementation Stages CRM Dashboard For Tracking Sales Pipeline Background PDF. Use them to share invaluable insights on Pipeline Value, Value Forecast, Sales Opportunities and impress your audience. This template can be altered and modified as per your expectations. So, grab it now.
CRM System Deployment Plan CRM Dashboard For Tracking Sales Pipeline Pictures PDF
This slide covers the CRM KPI dashboard for monitoring lead status in the sales funnel. It includes metrics such as open pipeline value, open pipeline by product package, pipeline value forecast, etc. Deliver an awe inspiring pitch with this creative CRM System Deployment Plan CRM Dashboard For Tracking Sales Pipeline Pictures PDF bundle. Topics like Pipeline Value Forecast, Open Pipeline Value, Branding can be discussed with this completely editable template. It is available for immediate download depending on the needs and requirements of the user.
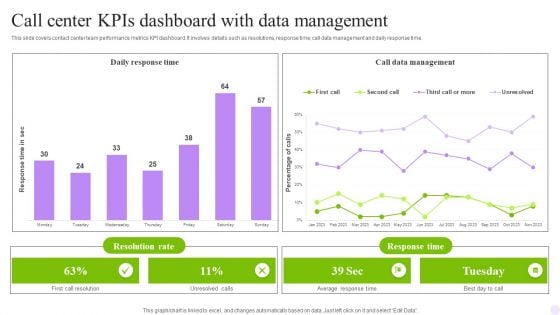
Call Center Kpis Dashboard With Data Management Infographics PDF
This slide covers contact center metrics KPI dashboard with call data details. It involves details such as total number of contacts handled, product sales, repeated calls and contact handles per day. Pitch your topic with ease and precision using this Call Center Kpis Dashboard With Data Management Infographics PDF. This layout presents information on Achieved, Contacts Handled, Repeated Calls. It is also available for immediate download and adjustment. So, changes can be made in the color, design, graphics or any other component to create a unique layout.
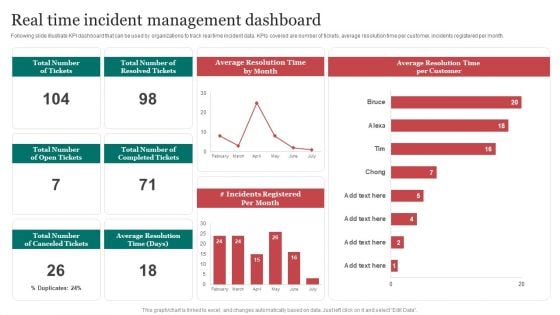
Real Time Incident Management Improving Cybersecurity With Incident Professional PDF
Following slide illustrate KPI dashboard that can be used by organizations to track real time incident data. KPIs covered are number of tickets, average resolution time per customer, incidents registered per month. The Real Time Incident Management Improving Cybersecurity With Incident Professional PDF is a compilation of the most recent design trends as a series of slides. It is suitable for any subject or industry presentation, containing attractive visuals and photo spots for businesses to clearly express their messages. This template contains a variety of slides for the user to input data, such as structures to contrast two elements, bullet points, and slides for written information. Slidegeeks is prepared to create an impression.
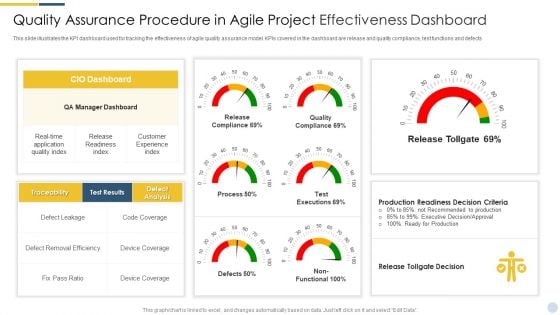
Quality Assurance Procedure In Agile Project Effectiveness Dashboard Formats PDF
This slide illustrates the KPI dashboard used for tracking the effectiveness of agile quality assurance model. KPIs covered in the dashboard are release and quality compliance, test functions and defects. Deliver and pitch your topic in the best possible manner with this quality assurance procedure in agile project effectiveness dashboard formats pdf. Use them to share invaluable insights on release tollgate decision, recommended to production, executive decision and impress your audience. This template can be altered and modified as per your expectations. So, grab it now.
Workforce Engagement And Communication Dashboard With Net Promoter Score Icons PDF
The following slide displays KPI dashboard to keep track of workforce engagement and communication at workplace to help company increase employee productivity. It includes elements such as monthly score, passive, promoters, detractors, etc. Showcasing this set of slides titled Workforce Engagement And Communication Dashboard With Net Promoter Score Icons PDF. The topics addressed in these templates are Participation Rate, Engagement Score, Overall Score. All the content presented in this PPT design is completely editable. Download it and make adjustments in color, background, font etc. as per your unique business setting.
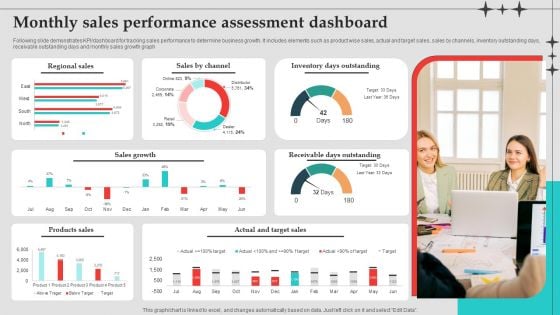
Monthly Sales Performance Assessment Dashboard Download PDF
Following slide demonstrates KPI or dashboard for tracking sales performance to determine business growth. It includes elements such as product wise sales, actual and target sales, sales by channels, inventory outstanding days, receivable outstanding days and monthly sales growth graph. Showcasing this set of slides titled Monthly Sales Performance Assessment Dashboard Download PDF. The topics addressed in these templates are Sales Growth, Inventory Days Outstanding, Target Sales. All the content presented in this PPT design is completely editable. Download it and make adjustments in color, background, font etc. as per your unique business setting.
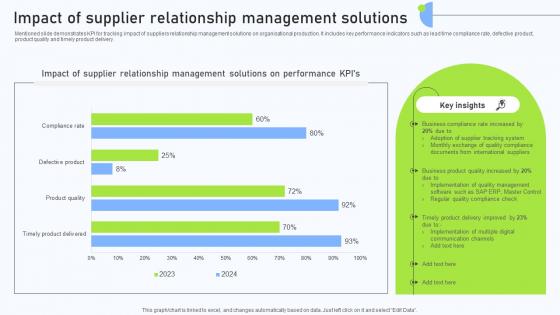
Relationship Management Automation Impact Of Supplier Relationship Management
Mentioned slide demonstrates KPI for tracking impact of suppliers relationship management solutions on organisational production. It includes key performance indicators such as lead time compliance rate, defective product, product quality and timely product delivery. Formulating a presentation can take up a lot of effort and time, so the content and message should always be the primary focus. The visuals of the PowerPoint can enhance the presenters message, so our Relationship Management Automation Impact Of Supplier Relationship Management was created to help save time. Instead of worrying about the design, the presenter can concentrate on the message while our designers work on creating the ideal templates for whatever situation is needed. Slidegeeks has experts for everything from amazing designs to valuable content, we have put everything into Relationship Management Automation Impact Of Supplier Relationship Management Mentioned slide demonstrates KPI for tracking impact of suppliers relationship management solutions on organisational production. It includes key performance indicators such as lead time compliance rate, defective product, product quality and timely product delivery.
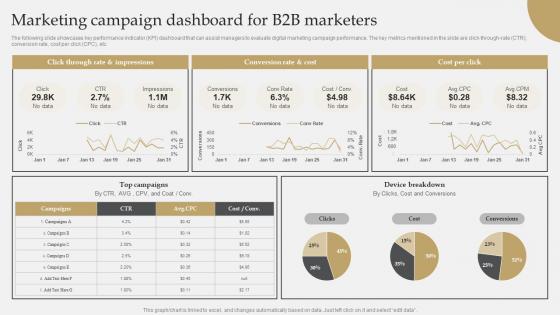
IT Industry Market Research Marketing Campaign Dashboard For B2b Marketers Demonstration Pdf
The following slide showcases key performance indicator KPI dashboard that can assist managers to evaluate digital marketing campaign performance. The key metrics mentioned in the slide are click-through-rate CTR, conversion rate, cost per click CPC, etc. Are you in need of a template that can accommodate all of your creative concepts This one is crafted professionally and can be altered to fit any style. Use it with Google Slides or PowerPoint. Include striking photographs, symbols, depictions, and other visuals. Fill, move around, or remove text boxes as desired. Test out color palettes and font mixtures. Edit and save your work, or work with colleagues. Download IT Industry Market Research Marketing Campaign Dashboard For B2b Marketers Demonstration Pdf and observe how to make your presentation outstanding. Give an impeccable presentation to your group and make your presentation unforgettable. The following slide showcases key performance indicator KPI dashboard that can assist managers to evaluate digital marketing campaign performance. The key metrics mentioned in the slide are click-through-rate CTR, conversion rate, cost per click CPC, etc.
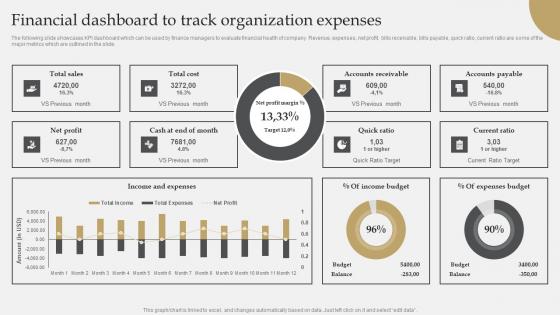
IT Industry Market Research Financial Dashboard To Track Organization Expenses Introduction Pdf
The following slide showcases KPI dashboard which can be used by finance managers to evaluate financial health of company. Revenue, expenses, net profit, bills receivable, bills payable, quick ratio, current ratio are some of the major metrics which are outlined in the slide. Present like a pro with IT Industry Market Research Financial Dashboard To Track Organization Expenses Introduction Pdf Create beautiful presentations together with your team, using our easy-to-use presentation slides. Share your ideas in real-time and make changes on the fly by downloading our templates. So whether you are in the office, on the go, or in a remote location, you can stay in sync with your team and present your ideas with confidence. With Slidegeeks presentation got a whole lot easier. Grab these presentations today. The following slide showcases KPI dashboard which can be used by finance managers to evaluate financial health of company. Revenue, expenses, net profit, bills receivable, bills payable, quick ratio, current ratio are some of the major metrics which are outlined in the slide.
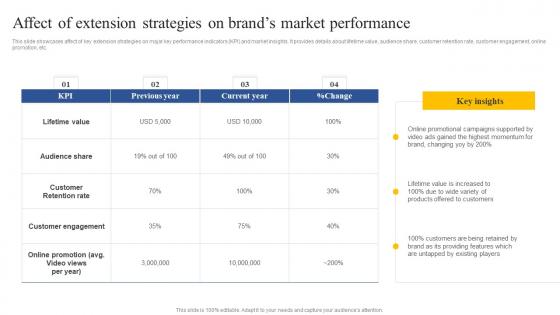
Affect Of Extension Strategies On Brands Market Performance How To Implement Product Portrait Pdf
This slide showcases affect of key extension strategies on major key performance indicators KPI and market insights. It provides details about lifetime value, audience share, customer retention rate, customer engagement, online promotion, etc. Whether you have daily or monthly meetings, a brilliant presentation is necessary. Affect Of Extension Strategies On Brands Market Performance How To Implement Product Portrait Pdf can be your best option for delivering a presentation. Represent everything in detail using Affect Of Extension Strategies On Brands Market Performance How To Implement Product Portrait Pdf and make yourself stand out in meetings. The template is versatile and follows a structure that will cater to your requirements. All the templates prepared by Slidegeeks are easy to download and edit. Our research experts have taken care of the corporate themes as well. So, give it a try and see the results. This slide showcases affect of key extension strategies on major key performance indicators KPI and market insights. It provides details about lifetime value, audience share, customer retention rate, customer engagement, online promotion, etc.
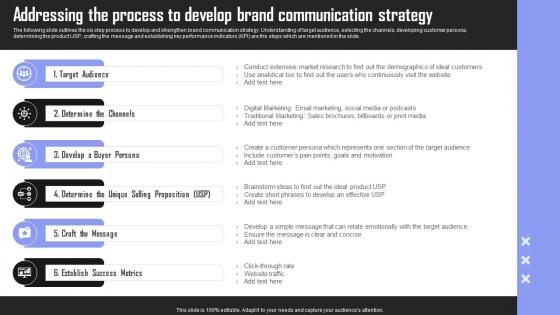
Addressing The Process Brand Building Techniques To Gain Competitive Edge Guidelines Pdf
The following slide outlines the six step process to develop and strengthen brand communication strategy. Understanding of target audience, selecting the channels, developing customer persona, determining the product USP, crafting the message and establishing key performance indicators KPI are the steps which are mentioned in the slide. Create an editable Addressing The Process Brand Building Techniques To Gain Competitive Edge Guidelines Pdf that communicates your idea and engages your audience. Whether you are presenting a business or an educational presentation, pre designed presentation templates help save time. Addressing The Process Brand Building Techniques To Gain Competitive Edge Guidelines Pdf is highly customizable and very easy to edit, covering many different styles from creative to business presentations. Slidegeeks has creative team members who have crafted amazing templates. So, go and get them without any delay. The following slide outlines the six step process to develop and strengthen brand communication strategy. Understanding of target audience, selecting the channels, developing customer persona, determining the product USP, crafting the message and establishing key performance indicators KPI are the steps which are mentioned in the slide.
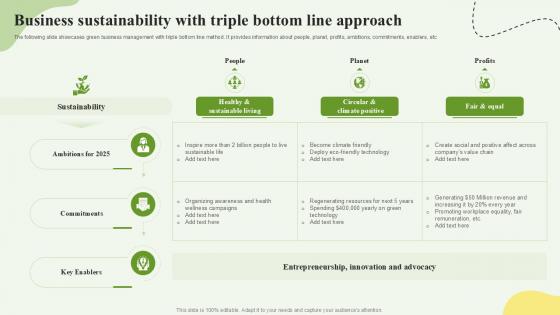
Business Sustainability With Triple Bottom Line Approach Ppt Example SS
This slide mentions the KPI dashboard for pharmaceutical companies. The purpose of this slide is analysis the 6 months gross selling of the company that can be utilized by the managers to determine actual revenue and profits. It includes details regarding discounts, unit sold per segment, profit by product, monthly revenue, etc. Get a simple yet stunning designed Business Sustainability With Triple Bottom Line Approach Ppt Example SS It is the best one to establish the tone in your meetings. It is an excellent way to make your presentations highly effective. So, download this PPT today from Slidegeeks and see the positive impacts. Our easy-to-edit Business Sustainability With Triple Bottom Line Approach Ppt Example SS can be your go-to option for all upcoming conferences and meetings. So, what are you waiting for Grab this template today. This slide mentions the KPI dashboard for pharmaceutical companies. The purpose of this slide is analysis the 6 months gross selling of the company that can be utilized by the managers to determine actual revenue and profits. It includes details regarding discounts, unit sold per segment, profit by product, monthly revenue, etc.
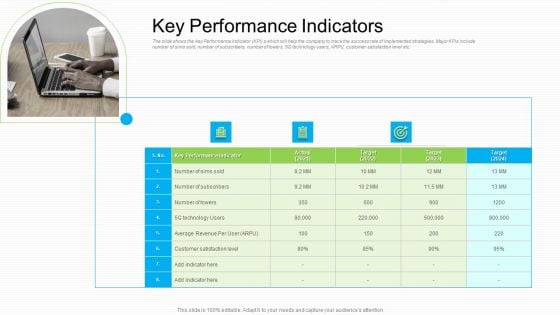
Lowering Sales Revenue A Telecommunication Firm Case Competition Key Performance Indicators Designs PDF
The slide shows the key Performance Indicator KPI s which will help the company to track the success rate of implemented strategies. Major KPIs include number of sims sold, number of subscribers, number of towers, 5G technology users, ARPU, customer satisfaction level etc. This is a lowering sales revenue a telecommunication firm case competition key performance indicators designs pdf template with various stages. Focus and dispense information on one stage using this creative set, that comes with editable features. It contains large content boxes to add your information on topics like average revenue, target, 2021 to 2024. You can also showcase facts, figures, and other relevant content using this PPT layout. Grab it now.
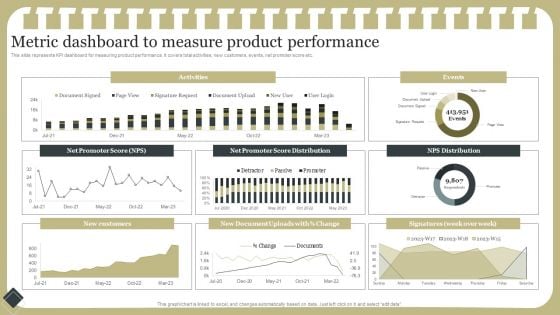
Effective Product Development Strategy Metric Dashboard To Measure Product Performance Information PDF
This slide represents KPI dashboard for measuring product performance. It covers total activities, new customers, events, net promoter score etc.Coming up with a presentation necessitates that the majority of the effort goes into the content and the message you intend to convey. The visuals of a PowerPoint presentation can only be effective if it supplements and supports the story that is being told. Keeping this in mind our experts created Effective Product Development Strategy Metric Dashboard To Measure Product Performance Information PDF to reduce the time that goes into designing the presentation. This way, you can concentrate on the message while our designers take care of providing you with the right template for the situation.
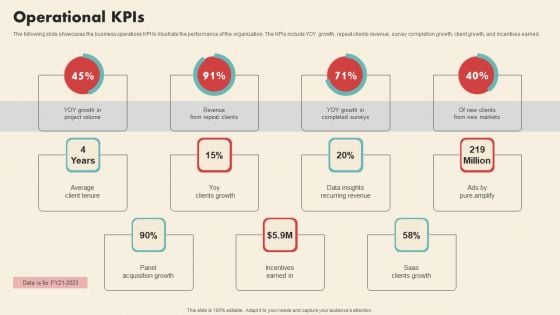
Data Driven Marketing Solutions Firm Company Profile Operational Kpis Graphics PDF
The following slide showcases the business operations KPI to illustrate the performance of the organization. The KPIs include YOY growth, repeat clients revenue, survey completion growth, client growth, and incentives earned. Are you searching for a Data Driven Marketing Solutions Firm Company Profile Operational Kpis Graphics PDF that is uncluttered, straightforward, and original Its easy to edit, and you can change the colors to suit your personal or business branding. For a presentation that expresses how much effort you have put in, this template is ideal. With all of its features, including tables, diagrams, statistics, and lists, its perfect for a business plan presentation. Make your ideas more appealing with these professional slides. Download Data Driven Marketing Solutions Firm Company Profile Operational Kpis Graphics PDF from Slidegeeks today.
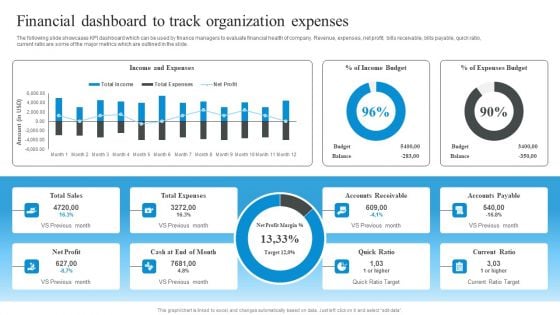
Market Evaluation Of IT Industry Financial Dashboard To Track Organization Expenses Clipart PDF
The following slide showcases KPI dashboard which can be used by finance managers to evaluate financial health of company. Revenue, expenses, net profit, bills receivable, bills payable, quick ratio, current ratio are some of the major metrics which are outlined in the slide. Do you have an important presentation coming up Are you looking for something that will make your presentation stand out from the rest Look no further than Market Evaluation Of IT Industry Financial Dashboard To Track Organization Expenses Clipart PDF. With our professional designs, you can trust that your presentation will pop and make delivering it a smooth process. And with Slidegeeks, you can trust that your presentation will be unique and memorable. So why wait Grab Market Evaluation Of IT Industry Financial Dashboard To Track Organization Expenses Clipart PDF today and make your presentation stand out from the rest.
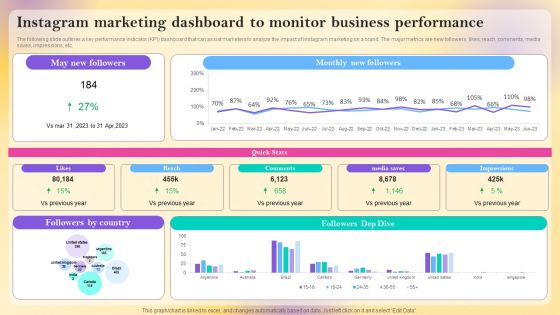
Instagram Marketing Dashboard To Monitor Business Performance Information PDF
The following slide outlines a key performance indicator KPI dashboard that can assist marketers to analyze the impact of Instagram marketing on a brand. The major metrics are new followers, likes, reach, comments, media saves, impressions, etc. This Instagram Marketing Dashboard To Monitor Business Performance Information PDF is perfect for any presentation, be it in front of clients or colleagues. It is a versatile and stylish solution for organizing your meetings. The product features a modern design for your presentation meetings. The adjustable and customizable slides provide unlimited possibilities for acing up your presentation. Slidegeeks has done all the homework before launching the product for you. So, do not wait, grab the presentation templates today
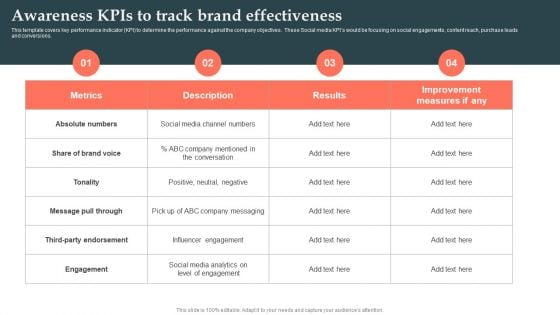
Product Launch Strategy Awareness Kpis To Track Brand Effectiveness Ppt Styles Inspiration PDF
This template covers key performance indicator KPI to determine the performance against the company objectives. These Social media KPIs would be focusing on social engagements, content reach, purchase leads and conversions. Here you can discover an assortment of the finest PowerPoint and Google Slides templates. With these templates, you can create presentations for a variety of purposes while simultaneously providing your audience with an eye catching visual experience. Download Product Launch Strategy Awareness Kpis To Track Brand Effectiveness Ppt Styles Inspiration PDF to deliver an impeccable presentation. These templates will make your job of preparing presentations much quicker, yet still, maintain a high level of quality. Slidegeeks has experienced researchers who prepare these templates and write high quality content for you. Later on, you can personalize the content by editing the Product Launch Strategy Awareness Kpis To Track Brand Effectiveness Ppt Styles Inspiration PDF.
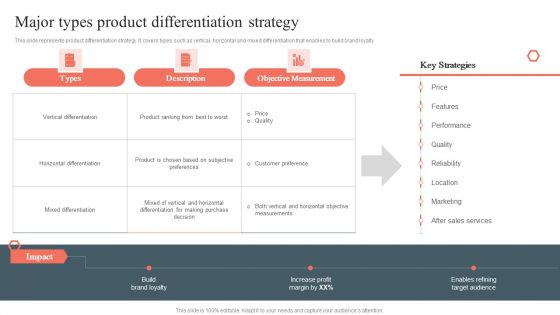
Major Types Product Differentiation Strategy Product Development And Management Plan Clipart PDF
This slide represents KPI dashboard for measuring product performance. It covers total activities, new customers, events, net promoter score etc.Find highly impressive Major Types Product Differentiation Strategy Product Development And Management Plan Clipart PDF on Slidegeeks to deliver a meaningful presentation. You can save an ample amount of time using these presentation templates. No need to worry to prepare everything from scratch because Slidegeeks experts have already done a huge research and work for you. You need to download Major Types Product Differentiation Strategy Product Development And Management Plan Clipart PDF for your upcoming presentation. All the presentation templates are 100 precent editable and you can change the color and personalize the content accordingly. Download now.
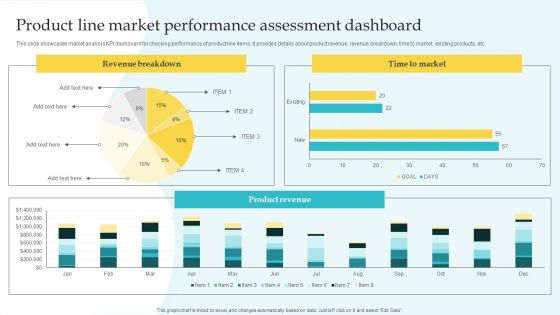
Commodity Line Expansion Product Line Market Performance Assessment Download PDF
This slide showcases market analysis KPI dashboard for checking performance of product line items. It provides details about product revenue, revenue breakdown, time to market, existing products, etc. Explore a selection of the finest Commodity Line Expansion Product Line Market Performance Assessment Download PDF here. With a plethora of professionally designed and pre-made slide templates, you can quickly and easily find the right one for your upcoming presentation. You can use our Commodity Line Expansion Product Line Market Performance Assessment Download PDF to effectively convey your message to a wider audience. Slidegeeks has done a lot of research before preparing these presentation templates. The content can be personalized and the slides are highly editable. Grab templates today from Slidegeeks.
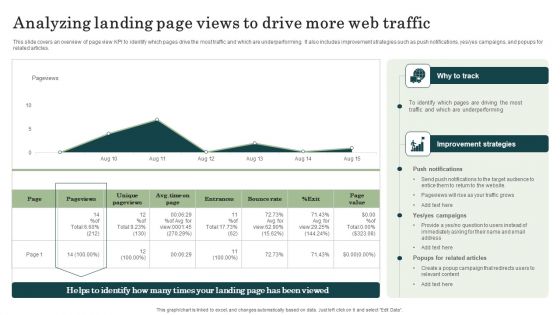
Marketing Success Metrics Analyzing Landing Page Views To Drive More Web Traffic Slides PDF
This slide covers an overview of page view kpi to identify which pages drive the most traffic and which are underperforming. it also includes improvement strategies such as push notifications, yes or yes campaigns, and popups for related articles. The Marketing Success Metrics Analyzing Landing Page Views To Drive More Web Traffic Slides PDF is a compilation of the most recent design trends as a series of slides. It is suitable for any subject or industry presentation, containing attractive visuals and photo spots for businesses to clearly express their messages. This template contains a variety of slides for the user to input data, such as structures to contrast two elements, bullet points, and slides for written information. Slidegeeks is prepared to create an impression.
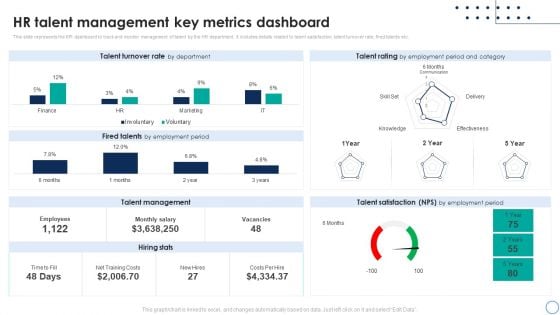
Business Analytics Application HR Talent Management Key Metrics Dashboard Rules PDF
This slide represents the KPI dashboard to track and monitor management of talent by the HR department. It includes details related to talent satisfaction, talent turnover rate, fired talents etc. This Business Analytics Application HR Talent Management Key Metrics Dashboard Rules PDF is perfect for any presentation, be it in front of clients or colleagues. It is a versatile and stylish solution for organizing your meetings. The Business Analytics Application HR Talent Management Key Metrics Dashboard Rules PDF features a modern design for your presentation meetings. The adjustable and customizable slides provide unlimited possibilities for acing up your presentation. Slidegeeks has done all the homework before launching the product for you. So, dont wait, grab the presentation templates today.
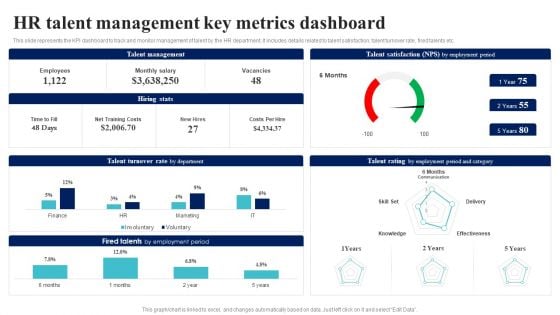
BI Implementation To Enhance Hiring Process Hr Talent Management Key Metrics Dashboard Brochure PDF
This slide represents the KPI dashboard to track and monitor management of talent by the HR department. It includes details related to talent satisfaction, talent turnover rate, fired talents etc.This BI Implementation To Enhance Hiring Process Hr Talent Management Key Metrics Dashboard Brochure PDF is perfect for any presentation, be it in front of clients or colleagues. It is a versatile and stylish solution for organizing your meetings. The BI Implementation To Enhance Hiring Process Hr Talent Management Key Metrics Dashboard Brochure PDF features a modern design for your presentation meetings. The adjustable and customizable slides provide unlimited possibilities for acing up your presentation. Slidegeeks has done all the homework before launching the product for you. So, do not wait, grab the presentation templates today.
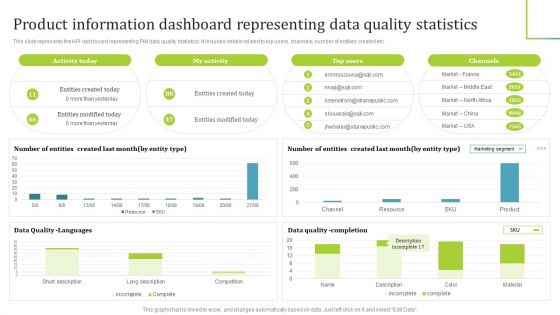
PIM Software Deployment To Enhance Conversion Rates Product Information Dashboard Representing Data Quality Statistics Download PDF
This slide represents the KPI dashboard representing PIM data quality statistics. It includes details related to top users, channels, number of entities created etc. Coming up with a presentation necessitates that the majority of the effort goes into the content and the message you intend to convey. The visuals of a PowerPoint presentation can only be effective if it supplements and supports the story that is being told. Keeping this in mind our experts created PIM Software Deployment To Enhance Conversion Rates Product Information Dashboard Representing Data Quality Statistics Download PDF to reduce the time that goes into designing the presentation. This way, you can concentrate on the message while our designers take care of providing you with the right template for the situation.
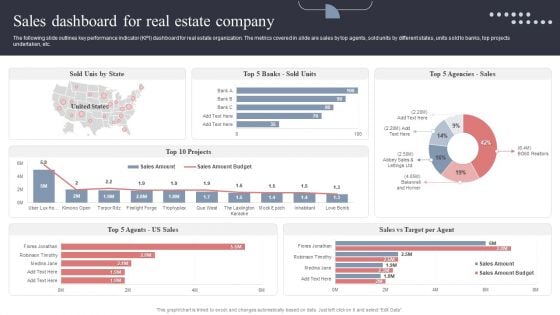
Sales Dashboard For Real Estate Company Topics PDF
The following slide outlines key performance indicator KPI dashboard for real estate organization. The metrics covered in slide are sales by top agents, sold units by different states, units sold to banks, top projects undertaken, etc. This Sales Dashboard For Real Estate Company Topics PDF is perfect for any presentation, be it in front of clients or colleagues. It is a versatile and stylish solution for organizing your meetings. The Sales Dashboard For Real Estate Company Topics PDF features a modern design for your presentation meetings. The adjustable and customizable slides provide unlimited possibilities for acing up your presentation. Slidegeeks has done all the homework before launching the product for you. So, do not wait, grab the presentation templates today
Dashboard For Tracking Customer Service Team Performance Consumer Contact Point Guide Diagrams PDF
This slide covers the KPI dashboard for analyzing the performance of client support department. It includes metrics such as first call resolution, unresolved calls, average response rate, the best day to call, average time to solve issues, etc. The Dashboard For Tracking Customer Service Team Performance Consumer Contact Point Guide Diagrams PDF is a compilation of the most recent design trends as a series of slides. It is suitable for any subject or industry presentation, containing attractive visuals and photo spots for businesses to clearly express their messages. This template contains a variety of slides for the user to input data, such as structures to contrast two elements, bullet points, and slides for written information. Slidegeeks is prepared to create an impression.
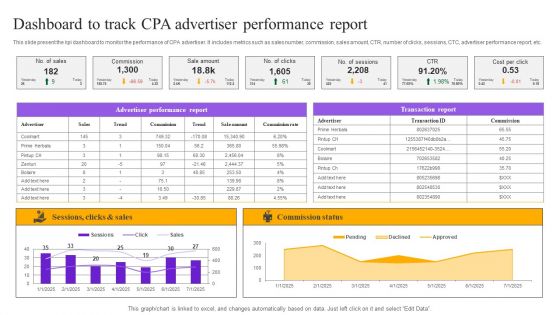
Strategies For Implementing CPA Marketing Dashboard To Track CPA Advertiser Performance Report Inspiration PDF
This slide present the kpi dashboard to monitor the performance of CPA advertiser. It includes metrics such as sales number, commission, sales amount, CTR, number of clicks, sessions, CTC, advertiser performance report, etc. The Strategies For Implementing CPA Marketing Dashboard To Track CPA Advertiser Performance Report Inspiration PDF is a compilation of the most recent design trends as a series of slides. It is suitable for any subject or industry presentation, containing attractive visuals and photo spots for businesses to clearly express their messages. This template contains a variety of slides for the user to input data, such as structures to contrast two elements, bullet points, and slides for written information. Slidegeeks is prepared to create an impression.
Inbound Lead Performance Tracking Dashboard Enhancing Client Lead Conversion Rates Structure PDF
This slide covers the KPI dashboard for evaluating inbound lead performance. It includes metrics such as lead to opportunity ratio, opportunity to win ratio, lead conversion ratio, inbound leads, and leads in the sales funnel. The Inbound Lead Performance Tracking Dashboard Enhancing Client Lead Conversion Rates Structure PDF is a compilation of the most recent design trends as a series of slides. It is suitable for any subject or industry presentation, containing attractive visuals and photo spots for businesses to clearly express their messages. This template contains a variety of slides for the user to input data, such as structures to contrast two elements, bullet points, and slides for written information. Slidegeeks is prepared to create an impression.
Inbound Lead Performance Tracking Dashboard Improving Lead Generation Process Pictures PDF
This slide covers the KPI dashboard for evaluating inbound lead performance. It includes metrics such as lead to opportunity ratio, opportunity to win ratio, lead conversion ratio, inbound leads, and leads in the sales funnel. The Inbound Lead Performance Tracking Dashboard Improving Lead Generation Process Pictures PDF is a compilation of the most recent design trends as a series of slides. It is suitable for any subject or industry presentation, containing attractive visuals and photo spots for businesses to clearly express their messages. This template contains a variety of slides for the user to input data, such as structures to contrast two elements, bullet points, and slides for written information. Slidegeeks is prepared to create an impression.
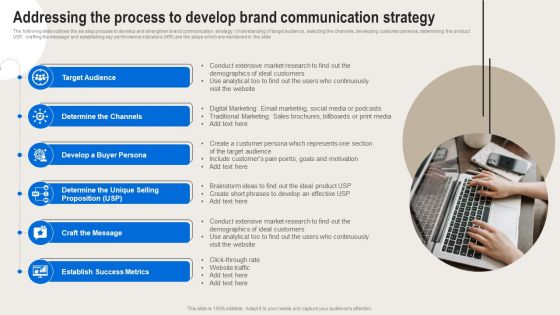
Formulating Branding Strategy To Enhance Revenue And Sales Addressing The Process To Develop Brand Designs PDF
The following slide outlines the six step process to develop and strengthen brand communication strategy. Understanding of target audience, selecting the channels, developing customer persona, determining the product USP, crafting the message and establishing key performance indicators KPI are the steps which are mentioned in the slide Crafting an eye catching presentation has never been more straightforward. Let your presentation shine with this tasteful yet straightforward Formulating Branding Strategy To Enhance Revenue And Sales Addressing The Process To Develop Brand Designs PDF template. It offers a minimalistic and classy look that is great for making a statement. The colors have been employed intelligently to add a bit of playfulness while still remaining professional. Construct the ideal Formulating Branding Strategy To Enhance Revenue And Sales Addressing The Process To Develop Brand Designs PDF that effortlessly grabs the attention of your audience. Begin now and be certain to wow your customers.
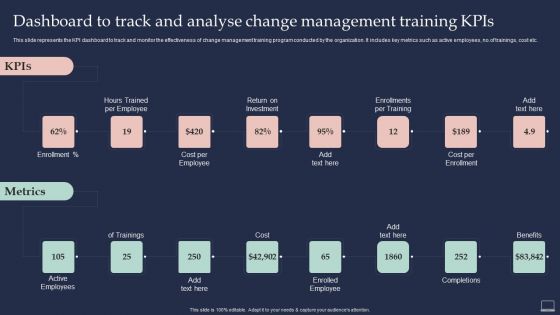
Training Program For Implementing Dashboard To Track And Analyse Change Management Brochure PDF
This slide represents the KPI dashboard to track and monitor the effectiveness of change management training program conducted by the organization. It includes key metrics such as active employees, no.of trainings, cost etc. This Training Program For Implementing Dashboard To Track And Analyse Change Management Brochure PDF is perfect for any presentation, be it in front of clients or colleagues. It is a versatile and stylish solution for organizing your meetings. The Training Program For Implementing Dashboard To Track And Analyse Change Management Brochure PDF features a modern design for your presentation meetings. The adjustable and customizable slides provide unlimited possibilities for acing up your presentation. Slidegeeks has done all the homework before launching the product for you. So, dont wait, grab the presentation templates today.
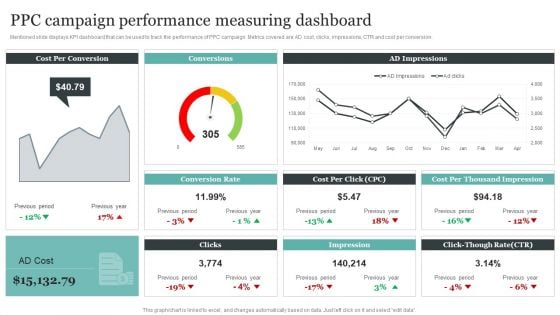
Comprehensive Personal Branding Guidelines Ppc Campaign Performance Measuring Dashboard Mockup PDF
Mentioned slide displays KPI dashboard that can be used to track the performance of PPC campaign. Metrics covered are AD cost, clicks, impressions, CTR and cost per conversion.This Comprehensive Personal Branding Guidelines Ppc Campaign Performance Measuring Dashboard Mockup PDF is perfect for any presentation, be it in front of clients or colleagues. It is a versatile and stylish solution for organizing your meetings. The Comprehensive Personal Branding Guidelines Ppc Campaign Performance Measuring Dashboard Mockup PDF features a modern design for your presentation meetings. The adjustable and customizable slides provide unlimited possibilities for acing up your presentation. Slidegeeks has done all the homework before launching the product for you. So, do not wait, grab the presentation templates today.
CRM Software Deployment Journey CRM Dashboard For Tracking Sales Pipeline Demonstration PDF
This slide covers the CRM KPI dashboard for monitoring lead status in the sales funnel. It includes metrics such as open pipeline value, open pipeline by product package, pipeline value forecast, etc. Do you have to make sure that everyone on your team knows about any specific topic I yes, then you should give CRM Software Deployment Journey CRM Dashboard For Tracking Sales Pipeline Demonstration PDF a try. Our experts have put a lot of knowledge and effort into creating this impeccable CRM Software Deployment Journey CRM Dashboard For Tracking Sales Pipeline Demonstration PDF. You can use this template for your upcoming presentations, as the slides are perfect to represent even the tiniest detail. You can download these templates from the Slidegeeks website and these are easy to edit. So grab these today.
CRM Dashboard For Tracking Sales Pipeline Brochure PDF
This slide covers the CRM KPI dashboard for monitoring lead status in the sales funnel. It includes metrics such as open pipeline value, open pipeline by product package, pipeline value forecast, etc. Crafting an eye catching presentation has never been more straightforward. Let your presentation shine with this tasteful yet straightforward CRM Dashboard For Tracking Sales Pipeline Brochure PDF template. It offers a minimalistic and classy look that is great for making a statement. The colors have been employed intelligently to add a bit of playfulness while still remaining professional. Construct the ideal CRM Dashboard For Tracking Sales Pipeline Brochure PDF that effortlessly grabs the attention of your audience Begin now and be certain to wow your customers.

Real Time Content Marketing Result Dashboard Ppt Infographic Template Example PDF
The following slide depicts real time content marketing KPI dashboard to monitor traffic flow and manage promotional efforts. It includes elements such as visitors by channel, conversion rate, search, direct, sessions, average time engaged etc. The Real Time Content Marketing Result Dashboard Ppt Infographic Template Example PDF is a compilation of the most recent design trends as a series of slides. It is suitable for any subject or industry presentation, containing attractive visuals and photo spots for businesses to clearly express their messages. This template contains a variety of slides for the user to input data, such as structures to contrast two elements, bullet points, and slides for written information. Slidegeeks is prepared to create an impression.
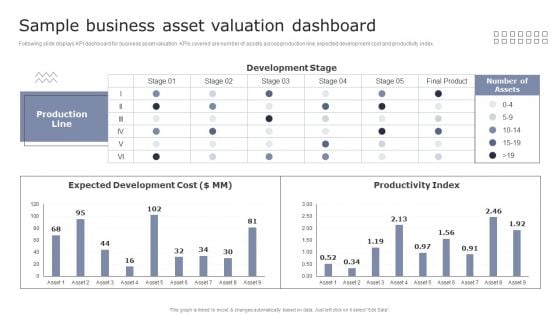
Sample Business Asset Valuation Dashboard Guide To Asset Cost Estimation Professional PDF
Following slide displays KPI dashboard for business asset valuation. KPIs covered are number of assets across production line, expected development cost and productivity index.Are you in need of a template that can accommodate all of your creative concepts This one is crafted professionally and can be altered to fit any style. Use it with Google Slides or PowerPoint. Include striking photographs, symbols, depictions, and other visuals. Fill, move around, or remove text boxes as desired. Test out color palettes and font mixtures. Edit and save your work, or work with colleagues. Download Sample Business Asset Valuation Dashboard Guide To Asset Cost Estimation Professional PDF and observe how to make your presentation outstanding. Give an impeccable presentation to your group and make your presentation unforgettable.

Adjacency Matrix Directed Graph In Powerpoint And Google Slides Cpb
Presenting our innovatively-designed set of slides titled Adjacency Matrix Directed Graph In Powerpoint And Google Slides Cpb. This completely editable PowerPoint graphic exhibits Adjacency Matrix Directed Graph that will help you convey the message impactfully. It can be accessed with Google Slides and is available in both standard screen and widescreen aspect ratios. Apart from this, you can download this well-structured PowerPoint template design in different formats like PDF, JPG, and PNG. So, click the download button now to gain full access to this PPT design. Introducing our dynamic PowerPoint PPT presentation on Current and Future Plans, meticulously crafted to guide businesses towards success. Unveil the latest trends and future finance strategies shaping industries, with a special focus on manufacturing and automotive sectors. Navigate through a comprehensive roadmap designed specifically for small businesses, offering strategic insights to ensure growth and resilience. Dive into the world of key performance indicators KPIs tailored for the evolving landscape of the e-commerce industry. Equip yourself with the knowledge needed to stay ahead, as this presentation seamlessly blends current insights with forward-thinking strategies, providing a holistic view for businesses striving to thrive in an ever-changing market. Elevate your business acumen with this indispensable tool for strategic planning.

Electronic Recycling In Powerpoint And Google Slides Cpb
Presenting our innovatively-designed set of slides titled Electronic Recycling In Powerpoint And Google Slides Cpb. This completely editable PowerPoint graphic exhibits Electronic Recycling that will help you convey the message impactfully. It can be accessed with Google Slides and is available in both standard screen and widescreen aspect ratios. Apart from this, you can download this well-structured PowerPoint template design in different formats like PDF, JPG, and PNG. So, click the download button now to gain full access to this PPT design. Introducing our dynamic PowerPoint PPT presentation on Current and Future Plans, meticulously crafted to guide businesses towards success. Unveil the latest trends and future finance strategies shaping industries, with a special focus on manufacturing and automotive sectors. Navigate through a comprehensive roadmap designed specifically for small businesses, offering strategic insights to ensure growth and resilience. Dive into the world of key performance indicators KPIs tailored for the evolving landscape of the e-commerce industry. Equip yourself with the knowledge needed to stay ahead, as this presentation seamlessly blends current insights with forward-thinking strategies, providing a holistic view for businesses striving to thrive in an ever-changing market. Elevate your business acumen with this indispensable tool for strategic planning.
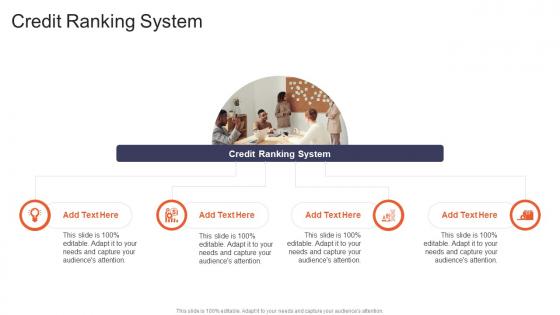
Credit Ranking System In Powerpoint And Google Slides Cpb
Presenting our innovatively-designed set of slides titled Credit Ranking System In Powerpoint And Google Slides Cpb This completely editable PowerPoint graphic exhibits Credit Ranking System that will help you convey the message impactfully. It can be accessed with Google Slides and is available in both standard screen and widescreen aspect ratios. Apart from this, you can download this well-structured PowerPoint template design in different formats like PDF, JPG, and PNG. So, click the download button now to gain full access to this PPT design. Introducing our dynamic PowerPoint PPT presentation on Current and Future Plans, meticulously crafted to guide businesses towards success. Unveil the latest trends and future finance strategies shaping industries, with a special focus on manufacturing and automotive sectors. Navigate through a comprehensive roadmap designed specifically for small businesses, offering strategic insights to ensure growth and resilience. Dive into the world of key performance indicators KPIs tailored for the evolving landscape of the e-commerce industry. Equip yourself with the knowledge needed to stay ahead, as this presentation seamlessly blends current insights with forward-thinking strategies, providing a holistic view for businesses striving to thrive in an ever-changing market. Elevate your business acumen with this indispensable tool for strategic planning.

Smart Grid Working Ppt Powerpoint Presentation Complete Deck With Slides

Pastry Shop Market Entry Plan Ppt Powerpoint Presentation GTM V
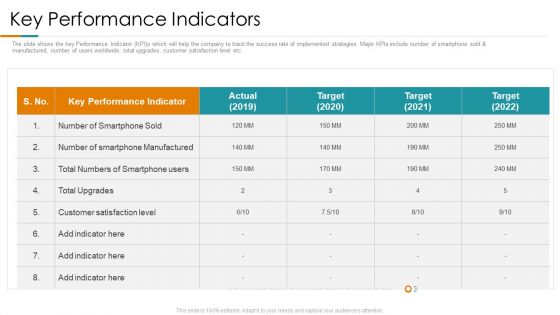
Key Performance Indicators Ppt Inspiration Layouts PDF
The slide shows the key Performance Indicator KPIs which will help the company to track the success rate of implemented strategies. Major KPIs include number of smartphone sold and manufactured, number of users worldwide, total upgrades, customer satisfaction level etc. Deliver an awe-inspiring pitch with this creative key performance indicators ppt inspiration layouts pdf. bundle. Topics like performance, target, manufactured can be discussed with this completely editable template. It is available for immediate download depending on the needs and requirements of the user.
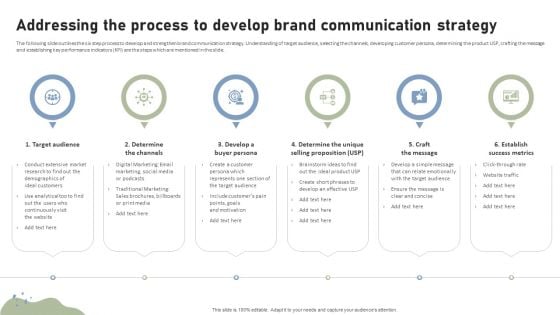
Brand Building Techniques Enhance Customer Engagement Loyalty Addressing The Process To Develop Brand Professional PDF
The following slide outlines the six step process to develop and strengthen brand communication strategy. Understanding of target audience, selecting the channels, developing customer persona, determining the product USP, crafting the message and establishing key performance indicators KPI are the steps which are mentioned in the slide. Here you can discover an assortment of the finest PowerPoint and Google Slides templates. With these templates, you can create presentations for a variety of purposes while simultaneously providing your audience with an eye catching visual experience. Download Brand Building Techniques Enhance Customer Engagement Loyalty Addressing The Process To Develop Brand Professional PDF to deliver an impeccable presentation. These templates will make your job of preparing presentations much quicker, yet still, maintain a high level of quality. Slidegeeks has experienced researchers who prepare these templates and write high quality content for you. Later on, you can personalize the content by editing the Brand Building Techniques Enhance Customer Engagement Loyalty Addressing The Process To Develop Brand Professional PDF.


 Continue with Email

 Home
Home


