Manufacturing Kpi
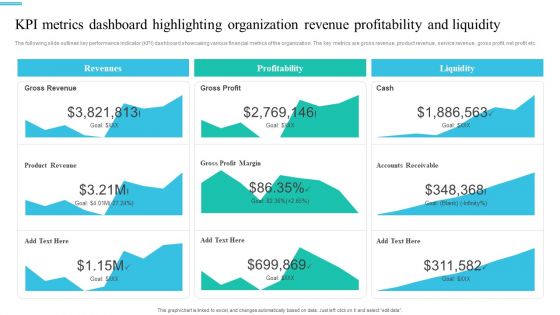
Monetary Planning And Evaluation Guide KPI Metrics Dashboard Highlighting Organization Revenue Profitability And Liquidity Ppt Diagram Images PDF
The following slide outlines key performance indicator KPI dashboard showcasing various financial metrics of the organization. The key metrics are gross revenue, product revenue, service revenue, gross profit, net profit etc. Coming up with a presentation necessitates that the majority of the effort goes into the content and the message you intend to convey. The visuals of a PowerPoint presentation can only be effective if it supplements and supports the story that is being told. Keeping this in mind our experts created Monetary Planning And Evaluation Guide KPI Metrics Dashboard Highlighting Organization Revenue Profitability And Liquidity Ppt Diagram Images PDF to reduce the time that goes into designing the presentation. This way, you can concentrate on the message while our designers take care of providing you with the right template for the situation.

Product Cost Management PCM Cost Management KPI Metrics Showing Return On Investment Ppt Visual Aids Inspiration PDF
This is a product cost management pcm cost management kpi metrics showing return on investment ppt visual aids inspiration pdf template with various stages. Focus and dispense information on four stages using this creative set, that comes with editable features. It contains large content boxes to add your information on topics like performed, cost, investment, variance, return. You can also showcase facts, figures, and other relevant content using this PPT layout. Grab it now.
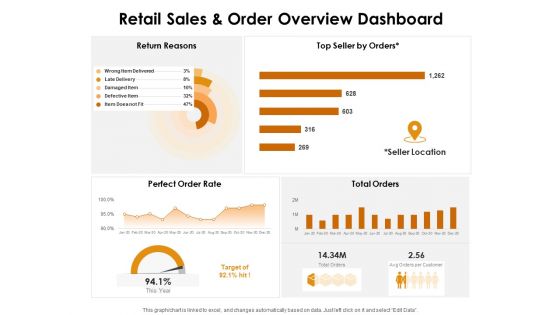
KPI Dashboards Per Industry Retail Sales And Order Overview Dashboard Ppt PowerPoint Presentation Infographic Template Master Slide PDF
Deliver and pitch your topic in the best possible manner with this kpi dashboards per industry retail sales and order overview dashboard ppt powerpoint presentation infographic template master slide pdf. Use them to share invaluable insights on return reasons, top seller orders, perfect order rate, total orders, seller location and impress your audience. This template can be altered and modified as per your expectations. So, grab it now.
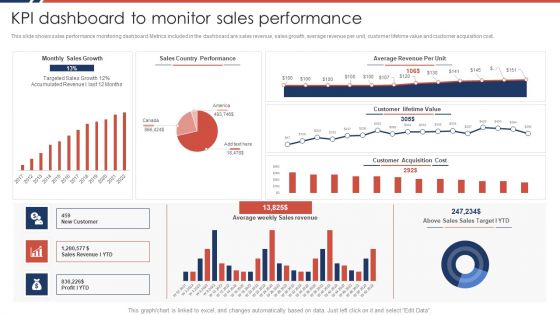
Effective Sales Plan For New Product Introduction In Market KPI Dashboard To Monitor Sales Performance Portrait PDF
This slide shows sales performance monitoring dashboard. Metrics included in the dashboard are sales revenue, sales growth, average revenue per unit, customer lifetime value and customer acquisition cost.Deliver an awe inspiring pitch with this creative Effective Sales Plan For New Product Introduction In Market KPI Dashboard To Monitor Sales Performance Portrait PDF bundle. Topics like Average Revenue, Country Performance, Customer Lifetime can be discussed with this completely editable template. It is available for immediate download depending on the needs and requirements of the user.
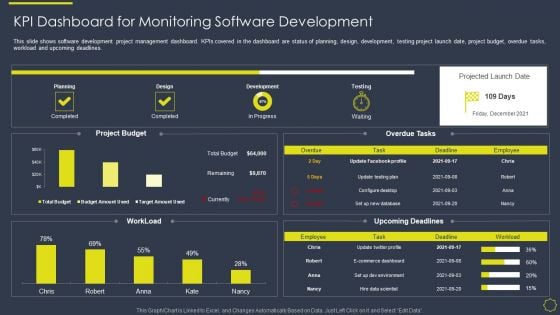
Implementing Development And Operations Platforms For In Time Product Launch IT KPI Dashboard For Monitoring Elements PDF
This slide shows software development project management dashboard. KPIs covered in the dashboard are status of planning, design, development, testing project launch date, project budget, overdue tasks, workload and upcoming deadlines. Deliver and pitch your topic in the best possible manner with this implementing development and operations platforms for in time product launch it kpi dashboard for monitoring elements pdf. Use them to share invaluable insights on development, design, development, planning and impress your audience. This template can be altered and modified as per your expectations. So, grab it now.
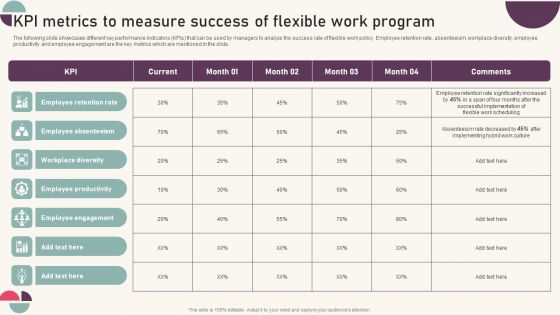
Tactics For Establishing Sustainable Hybrid Work Environment Kpi Metrics To Measure Success Of Flexible Work Mockup PDF
The following slide showcases different key performance indicators KPIs that can be used by managers to analyze the success rate of flexible work policy. Employee retention rate, absenteeism, workplace diversity, employee productivity and employee engagement are the key metrics which are mentioned in the slide. The best PPT templates are a great way to save time, energy, and resources. Slidegeeks have 100 percent editable powerpoint slides making them incredibly versatile. With these quality presentation templates, you can create a captivating and memorable presentation by combining visually appealing slides and effectively communicating your message. Download Tactics For Establishing Sustainable Hybrid Work Environment Kpi Metrics To Measure Success Of Flexible Work Mockup PDF from Slidegeeks and deliver a wonderful presentation.

Dashboard Showing Production Quality Defects Guidelines PDF
This following slide exhibits a dashboard providing KPI of manufacturing quality. Major KPIs under this are total and defective production, average cycle duration and production rate.Showcasing this set of slides titled Dashboard Showing Production Quality Defects Guidelines PDF The topics addressed in these templates are Count Of Defects By Type, Defects Reported By Tester, Defective Production All the content presented in this PPT design is completely editable. Download it and make adjustments in color, background, font etc. as per your unique business setting.
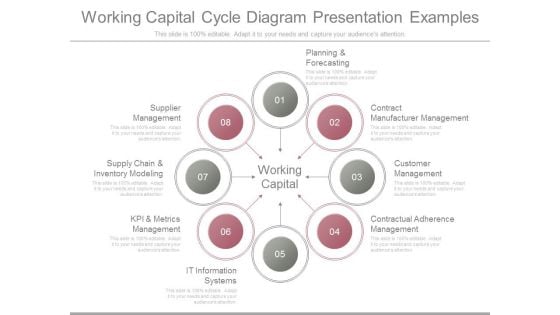
Working Capital Cycle Diagram Presentation Examples
This is a working capital cycle diagram presentation examples. This is a eight stage process. The stages in this process are planning and forecasting, contract manufacturer management, customer management, contractual adherence management, it information systems, kpi and metrics management, supply chain and inventory modeling, supplier management.
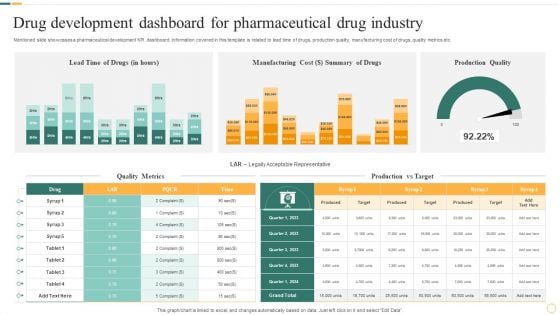
Drug Development Dashboard For Pharmaceutical Drug Industry Portrait PDF
Mentioned slide showcases a pharmaceutical development KPI dashboard. Information covered in this template is related to lead time of drugs, production quality, manufacturing cost of drugs, quality metrics etc. Showcasing this set of slides titled Drug Development Dashboard For Pharmaceutical Drug Industry Portrait PDF. The topics addressed in these templates are Manufacturing Cost, Summary Of Drugs, Production Quality. All the content presented in this PPT design is completely editable. Download it and make adjustments in color, background, font etc. as per your unique business setting.
Online Product Planning Ecommerce Management KPIS And Dashboard Ppt Professional Example PDF
Presenting this set of slides with name online product planning ecommerce management kpis and dashboard ppt professional example pdf. This is a two stage process. The stages in this process are kpi metrics, kpi dashboards. This is a completely editable PowerPoint presentation and is available for immediate download. Download now and impress your audience.
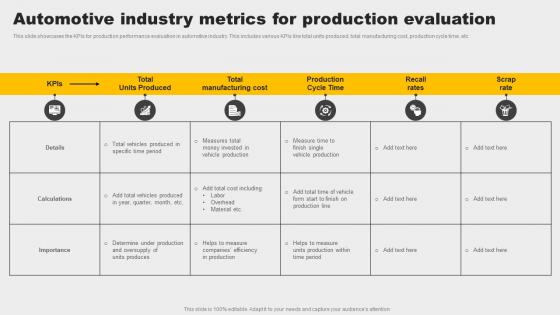
Automotive Industry Metrics For Production Evaluation Information Pdf
This slide showcases the KPIs for production performance evaluation in automotive industry. This includes various KPIs like total units produced, total manufacturing cost, production cycle time, etc. Showcasing this set of slides titled Automotive Industry Metrics For Production Evaluation Information Pdf. The topics addressed in these templates are Measures, Vehicle Production, Determine. All the content presented in this PPT design is completely editable. Download it and make adjustments in color, background, font etc. as per your unique business setting. This slide showcases the KPIs for production performance evaluation in automotive industry. This includes various KPIs like total units produced, total manufacturing cost, production cycle time, etc.
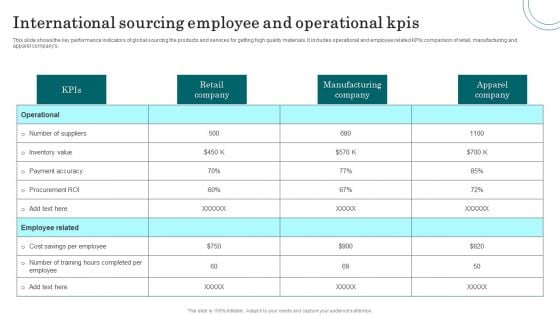
International Sourcing Employee And Operational Kpis Themes PDF
This slide shows the key performance indicators of global sourcing the products and services for getting high quality materials. It includes operational and employee related KPIs comparison of retail, manufacturing and apparel companys. Pitch your topic with ease and precision using this International Sourcing Employee And Operational Kpis Themes PDF. This layout presents information on Apparel Company, Manufacturing Company, Retail Company. It is also available for immediate download and adjustment. So, changes can be made in the color, design, graphics or any other component to create a unique layout.

Education Institute SEO Approach Regular Monitoring Training Ppt
This slide covers monitoring SEO for school as strategy for education industry. It also depicts that education businesses must monitor their website through KPI or metrics such as loading speed, your websites mobile-friendliness, etc.
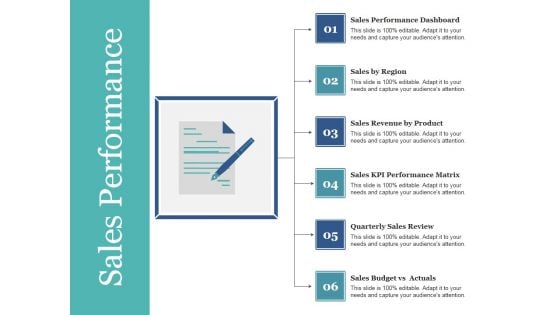
Sales Performance Ppt PowerPoint Presentation Summary Influencers
This is a sales performance ppt powerpoint presentation summary influencers. This is a six stage process. The stages in this process are sales performance dashboard, sales by region, sales revenue by product, sales kpi performance matrix, quarterly sales review.
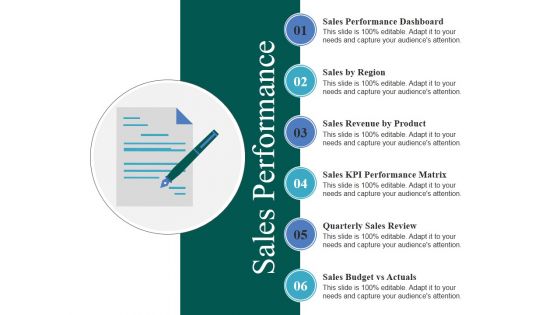
Sales Performance Ppt PowerPoint Presentation Infographics Visuals
This is a sales performance ppt powerpoint presentation infographics visuals. This is a six stage process. The stages in this process are sales by region, sales revenue by product, sales kpi performance matrix, quarterly sales review, sales budget vs actuals.

Pharmaceutical Company Key Performance Indicators Clipart PDF
The slide shows the key Performance Indicator KPI s which will help the company to track the success rate of implemented strategies. Major KPIs include number of products sold, pharma products manufactures, research and development expenses per year, total number of patients, etc.Presenting pharmaceutical company key performance indicators clipart pdf to provide visual cues and insights. Share and navigate important information on one stage that need your due attention. This template can be used to pitch topics like research and development, key performance indicator, pharma products manufactured In addtion, this PPT design contains high resolution images, graphics, etc, that are easily editable and available for immediate download.
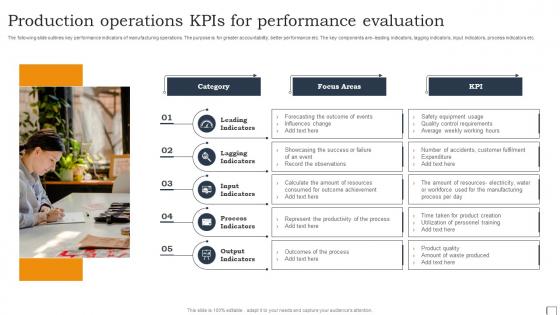
Production Operations KPIs For Performance Evaluation Structure Pdf
The following slide outlines key performance indicators of manufacturing operations. The purpose is for greater accountability, better performance etc. The key components are- leading indicators, lagging indicators, input indicators, process indicators etc. Pitch your topic with ease and precision using this Production Operations KPIs For Performance Evaluation Structure Pdf. This layout presents information on Leading Indicators, Lagging Indicators, Input Indicators. It is also available for immediate download and adjustment. So, changes can be made in the color, design, graphics or any other component to create a unique layout. The following slide outlines key performance indicators of manufacturing operations. The purpose is for greater accountability, better performance etc. The key components are- leading indicators, lagging indicators, input indicators, process indicators etc.
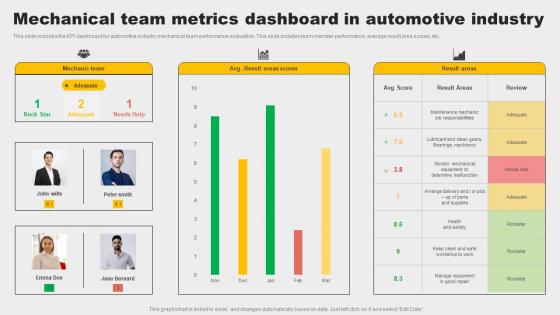
Mechanical Team Metrics Dashboard In Automotive Industry Rules Pdf
This slide includes the KPI dashboard for automotive industry mechanical team performance evaluation. This slide includes team member performance, average result area scores, etc. Showcasing this set of slides titled Mechanical Team Metrics Dashboard In Automotive Industry Rules Pdf. The topics addressed in these templates are Determine Malfunction, Automotive Industry, Mechanical Team Metrics Dashboard. All the content presented in this PPT design is completely editable. Download it and make adjustments in color, background, font etc. as per your unique business setting. This slide includes the KPI dashboard for automotive industry mechanical team performance evaluation. This slide includes team member performance, average result area scores, etc.
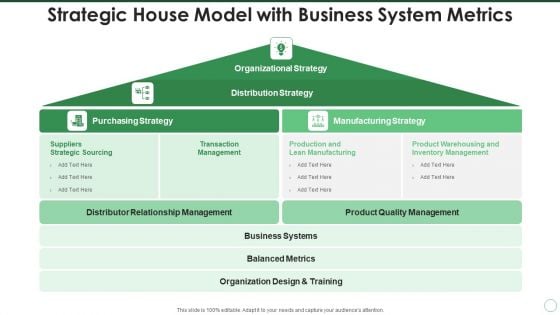
Strategic House Model With Business System Metrics Professional PDF
Persuade your audience using this strategic house model with business system metrics professional pdf. This PPT design covers four stages, thus making it a great tool to use. It also caters to a variety of topics including organizational strategy, distribution strategy, purchasing strategy, manufacturing strategy. Download this PPT design now to present a convincing pitch that not only emphasizes the topic but also showcases your presentation skills.
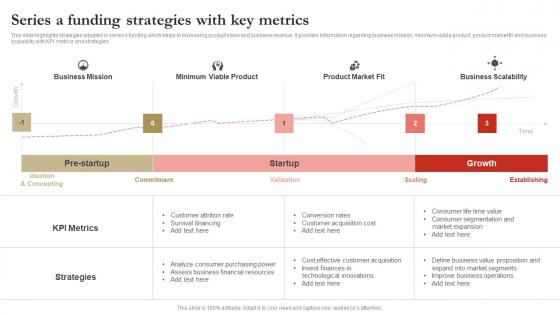
Series A Funding Strategies With Key Metrics Graphics Pdf
This slide highlights strategies adopted in series A funding which helps in increasing product sales and business revenue. It provides information regarding business mission, minimum viable product, product market fit and business scalability with KPI metrics and strategies. Pitch your topic with ease and precision using this Series A Funding Strategies With Key Metrics Graphics Pdf. This layout presents information on Kpi Metrics, Strategies, Financial Resources. It is also available for immediate download and adjustment. So, changes can be made in the color, design, graphics or any other component to create a unique layout. This slide highlights strategies adopted in series A funding which helps in increasing product sales and business revenue. It provides information regarding business mission, minimum viable product, product market fit and business scalability with KPI metrics and strategies.
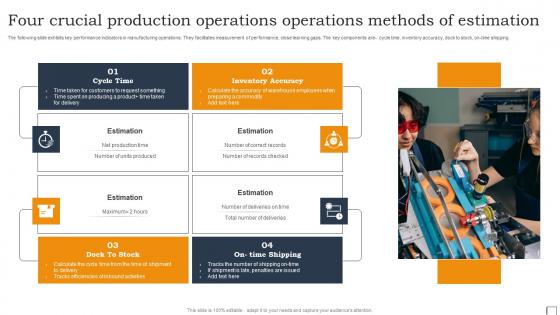
Four Crucial Production Operations Operations Methods Of Estimation Infographics Pdf
The following slide exhibits key performance indicators in manufacturing operations. They facilitates measurement of performance, close learning gaps. The key components are- cycle time, inventory accuracy, dock to stock, on-time shipping. Showcasing this set of slides titled Four Crucial Production Operations Operations Methods Of Estimation Infographics Pdf. The topics addressed in these templates are Cycle Time, Inventory Accuracy. All the content presented in this PPT design is completely editable. Download it and make adjustments in color, background, font etc. as per your unique business setting. The following slide exhibits key performance indicators in manufacturing operations. They facilitates measurement of performance, close learning gaps. The key components are- cycle time, inventory accuracy, dock to stock, on-time shipping.
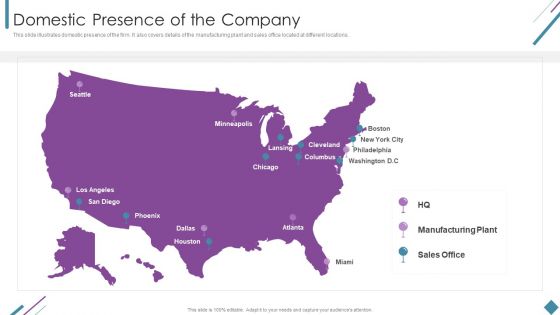
Metrics To Measure Business Performance Domestic Presence Of The Company Ideas PDF
This is a Metrics To Measure Business Performance Domestic Presence Of The Company Ideas PDF template with various stages. Focus and dispense information on one stages using this creative set, that comes with editable features. It contains large content boxes to add your information on topics like HQ, Manufacturing Plant, Sales Office. You can also showcase facts, figures, and other relevant content using this PPT layout. Grab it now.
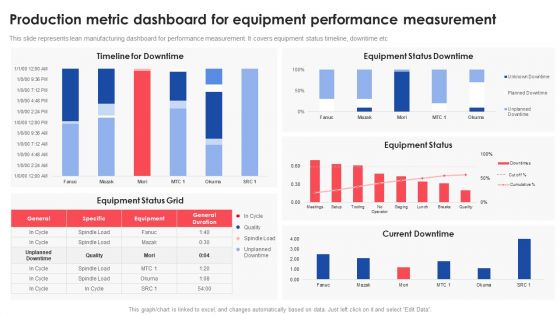
Production Metric Dashboard For Equipment Performance Measurement Deploying And Managing Lean Portrait PDF
This slide represents lean manufacturing dashboard for performance measurement. It covers equipment status timeline, downtime etcDeliver and pitch your topic in the best possible manner with this Production Metric Dashboard For Equipment Performance Measurement Deploying And Managing Lean Portrait PDF. Use them to share invaluable insights on Timeline Downtime, Equipment, Current Downtime and impress your audience. This template can be altered and modified as per your expectations. So, grab it now.
Project Performance Metrics Cost Variance CV Planned Budget Vs Actual Budget Ppt Icon Samples PDF
Presenting project performance metrics cost variance cv planned budget vs actual budget ppt icon samples pdf to provide visual cues and insights. Share and navigate important information on one stage that need your due attention. This template can be used to pitch topics like manufacturing overhead costs, plant and infrastructure, insurance fixed cost, maintenance variable cost. In addtion, this PPT design contains high resolution images, graphics, etc, that are easily editable and available for immediate download.
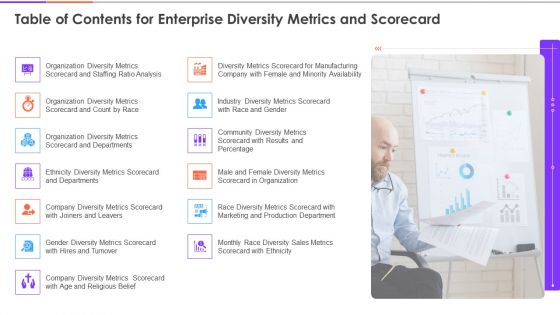
Table Of Contents For Enterprise Diversity Metrics And Scorecard Themes PDF
Presenting table of contents for enterprise diversity metrics and scorecard themes pdf to provide visual cues and insights. Share and navigate important information on thirteen stages that need your due attention. This template can be used to pitch topics like organization, manufacturing company, hires and turnover, staffing ratio analysis. In addtion, this PPT design contains high resolution images, graphics, etc, that are easily editable and available for immediate download.
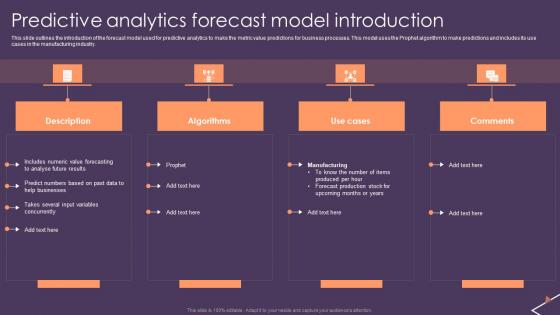
Predictive Analytics For Empowering Predictive Analytics Forecast Model Introduction Inspiration Pdf
This slide outlines the introduction of the forecast model used for predictive analytics to make the metric value predictions for business processes. This model uses the Prophet algorithm to make predictions and includes its use cases in the manufacturing industry. Make sure to capture your audiences attention in your business displays with our gratis customizable Predictive Analytics For Empowering Predictive Analytics Forecast Model Introduction Inspiration Pdf These are great for business strategies, office conferences, capital raising or task suggestions. If you desire to acquire more customers for your tech business and ensure they stay satisfied, create your own sales presentation with these plain slides. This slide outlines the introduction of the forecast model used for predictive analytics to make the metric value predictions for business processes. This model uses the Prophet algorithm to make predictions and includes its use cases in the manufacturing industry.
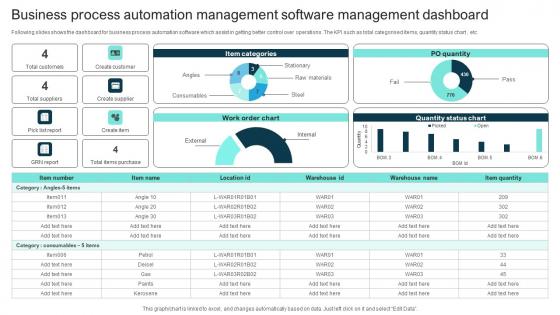
Business Process Automation Management Software Management Dashboard Themes Pdf
Following slides shows the dashboard for business process automation software which assist in getting better control over operations. The KPI such as total categorised items, quantity status chart, etc Showcasing this set of slides titled Business Process Automation Management Software Management Dashboard Themes Pdf The topics addressed in these templates are Item Categories, Warehouse, Business Process All the content presented in this PPT design is completely editable. Download it and make adjustments in color, background, font etc. as per your unique business setting. Following slides shows the dashboard for business process automation software which assist in getting better control over operations. The KPI such as total categorised items, quantity status chart, etc
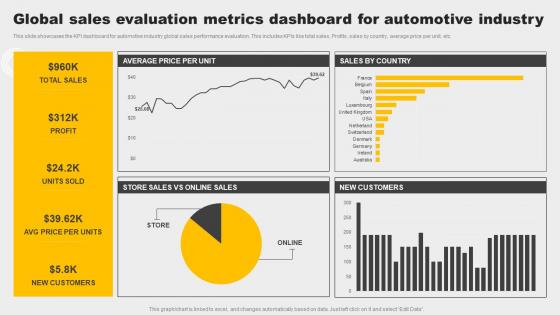
Global Sales Evaluation Metrics Dashboard For Automotive Industry Demonstration Pdf
This slide showcases the KPI dashboard for automotive industry global sales performance evaluation. This includes KPIs like total sales, Profits, sales by country, average price per unit, etc. Pitch your topic with ease and precision using this Global Sales Evaluation Metrics Dashboard For Automotive Industry Demonstration Pdf. This layout presents information on Customers, Profit, Sales. It is also available for immediate download and adjustment. So, changes can be made in the color, design, graphics or any other component to create a unique layout. This slide showcases the KPI dashboard for automotive industry global sales performance evaluation. This includes KPIs like total sales, Profits, sales by country, average price per unit, etc.
Online Business Promotion Performance Analysis To Fulfill Business Objectives Ppt PowerPoint Presentation Summary Icon PDF
Pitch your topic with ease and precision using this online business promotion performance analysis to fulfill business objectives ppt powerpoint presentation summary icon pdf. This layout presents information on KPI performance metric, advertiser revenue, sell products. It is also available for immediate download and adjustment. So, changes can be made in the color, design, graphics or any other component to create a unique layout.
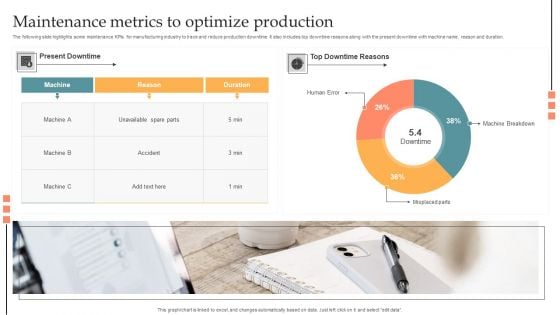
Maintenance Metrics To Optimize Production Information PDF
The following slide highlights some maintenance KPIs for manufacturing industry to trace and reduce production downtime. It also includes top downtime reasons along with the present downtime with machine name, reason and duration. Showcasing this set of slides titled Maintenance Metrics To Optimize Production Information PDF. The topics addressed in these templates are Human Error, Misplaced Parts, Machine Breakdown. All the content presented in this PPT design is completely editable. Download it and make adjustments in color, background, font etc. as per your unique business setting.
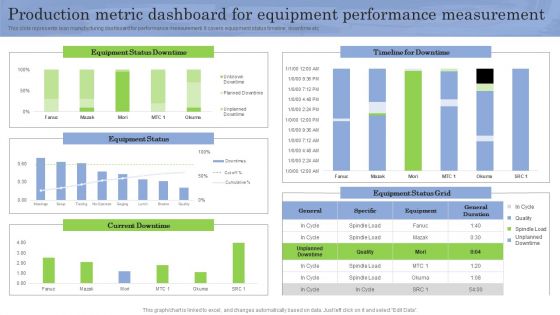
Production Metric Dashboard For Equipment Performance Measurement Slides PDF
This slide represents lean manufacturing dashboard for performance measurement. It covers equipment status timeline, downtime etc Want to ace your presentation in front of a live audience Our Production Metric Dashboard For Equipment Performance Measurement Slides PDF can help you do that by engaging all the users towards you. Slidegeeks experts have put their efforts and expertise into creating these impeccable powerpoint presentations so that you can communicate your ideas clearly. Moreover, all the templates are customizable, and easy to edit and downloadable. Use these for both personal and commercial use.
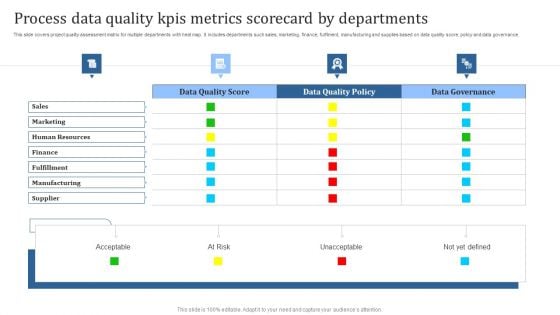
Process Data Quality Kpis Metrics Scorecard By Departments Template PDF
This slide covers project quality assessment matrix for multiple departments with heat map. It includes departments such sales, marketing, finance, fulfilment, manufacturing and supplies based on data quality score, policy and data governance. Showcasing this set of slides titled Process Data Quality Kpis Metrics Scorecard By Departments Template PDF. The topics addressed in these templates are Acceptable, At Risk, Unacceptable. All the content presented in this PPT design is completely editable. Download it and make adjustments in color, background, font etc. as per your unique business setting.
Competitive Comparative Analysis Based On Product Metrics Ppt Icon Slide Pdf
The following slide showcases comparison and analysis of own and competitor business based on production KPIs and compliance. It presents metrics such as units produced per hour, scrap rate, manufacturing cycle time, first pass yield, downtime, overall equipment effectiveness and on time delivery rate. Want to ace your presentation in front of a live audience Our Competitive Comparative Analysis Based On Product Metrics Ppt Icon Slide Pdf can help you do that by engaging all the users towards you. Slidegeeks experts have put their efforts and expertise into creating these impeccable powerpoint presentations so that you can communicate your ideas clearly. Moreover, all the templates are customizable, and easy to edit and downloadable. Use these for both personal and commercial use. The following slide showcases comparison and analysis of own and competitor business based on production KPIs and compliance. It presents metrics such as units produced per hour, scrap rate, manufacturing cycle time, first pass yield, downtime, overall equipment effectiveness and on time delivery rate.
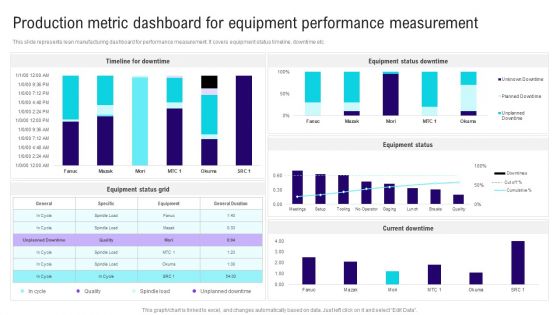
Implementing Lean Production Tool And Techniques Production Metric Dashboard For Equipment Performance Mockup PDF
This slide represents lean manufacturing dashboard for performance measurement. It covers equipment status timeline, downtime etc The Implementing Lean Production Tool And Techniques Production Metric Dashboard For Equipment Performance Mockup PDF is a compilation of the most recent design trends as a series of slides. It is suitable for any subject or industry presentation, containing attractive visuals and photo spots for businesses to clearly express their messages. This template contains a variety of slides for the user to input data, such as structures to contrast two elements, bullet points, and slides for written information. Slidegeeks is prepared to create an impression.
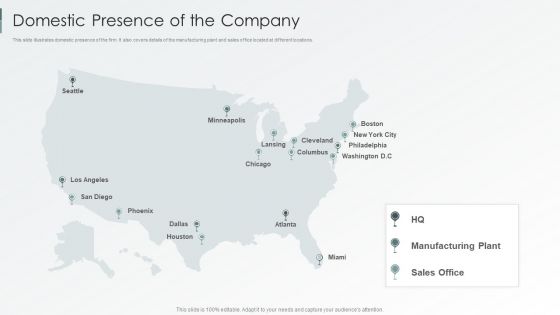
Enterprise Sustainability Performance Metrics Domestic Presence Of The Company Structure PDF
This slide illustrates domestic presence of the firm. It also covers details of the manufacturing plant and sales office located at different locations.This is a Enterprise Sustainability Performance Metrics Domestic Presence Of The Company Structure PDF template with various stages. Focus and dispense information on one stage using this creative set, that comes with editable features. It contains large content boxes to add your information on topics like Domestic Presence, Company. You can also showcase facts, figures, and other relevant content using this PPT layout. Grab it now.
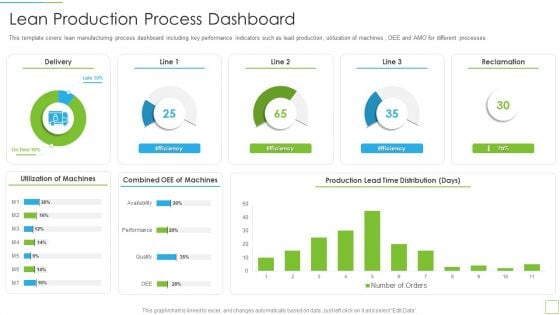
Hoshin Kanri Pitch Deck Lean Production Process Dashboard Guidelines PDF
This template covers lean manufacturing process dashboard including key performance indicators such as lead production, utilization of machines , OEE and AMO for different processes Deliver and pitch your topic in the best possible manner with this hoshin kanri pitch deck lean production process dashboard guidelines pdf Use them to share invaluable insights on utilization of machines, combined oee of machines, production lead time distribution and impress your audience. This template can be altered and modified as per your expectations. So, grab it now.
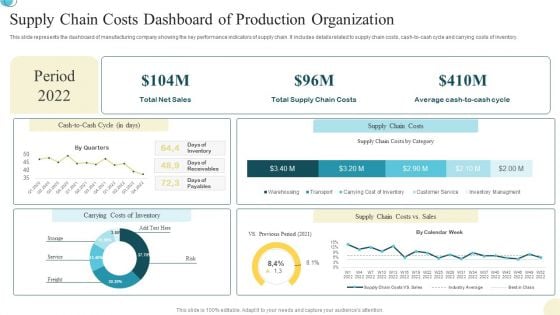
Supply Chain Costs Dashboard Of Production Organization Background PDF
This slide represents the dashboard of manufacturing company showing the key performance indicators of supply chain. It includes details related to supply chain costs, cash to cash cycle and carrying costs of inventory. Pitch your topic with ease and precision using this Supply Chain Costs Dashboard Of Production Organization Background PDF. This layout presents information on Supply Chain Costs, Dashboard Of Production, Organization. It is also available for immediate download and adjustment. So, changes can be made in the color, design, graphics or any other component to create a unique layout.
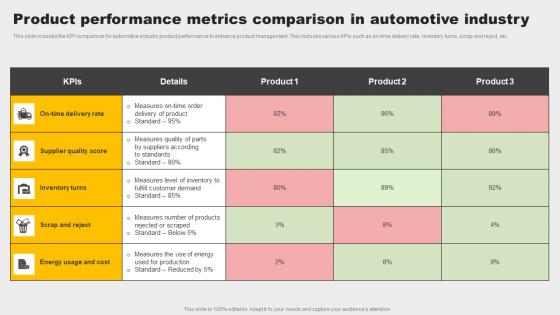
Product Performance Metrics Comparison In Automotive Industry Topics Pdf
This slide includes the KPI comparison for automotive industry product performance to enhance product management. This includes various KPIs such as on time delivery rate, inventory turns, scrap and reject, etc. Showcasing this set of slides titled Product Performance Metrics Comparison In Automotive Industry Topics Pdf. The topics addressed in these templates are Inventory Turns, Supplier Quality Score, Energy Usage And Cost. All the content presented in this PPT design is completely editable. Download it and make adjustments in color, background, font etc. as per your unique business setting. This slide includes the KPI comparison for automotive industry product performance to enhance product management. This includes various KPIs such as on time delivery rate, inventory turns, scrap and reject, etc.
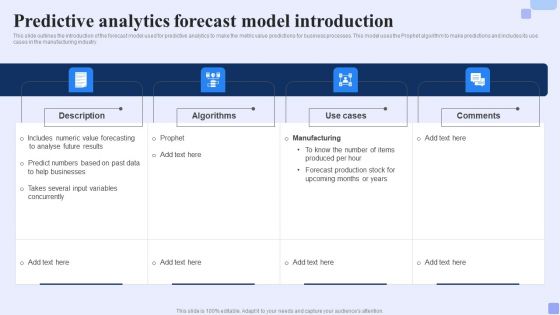
Predictive Analytics Forecast Model Introduction Forward Looking Analysis IT Information PDF
This slide outlines the introduction of the forecast model used for predictive analytics to make the metric value predictions for business processes. This model uses the Prophet algorithm to make predictions and includes its use cases in the manufacturing industry.Make sure to capture your audiences attention in your business displays with our gratis customizable Predictive Analytics Forecast Model Introduction Forward Looking Analysis IT Information PDF. These are great for business strategies, office conferences, capital raising or task suggestions. If you desire to acquire more customers for your tech business and ensure they stay satisfied, create your own sales presentation with these plain slides.
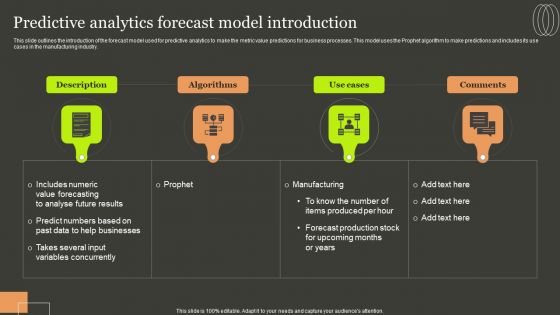
Predictive Analytics Methods Predictive Analytics Forecast Model Introduction Rules PDF
This slide outlines the introduction of the forecast model used for predictive analytics to make the metric value predictions for business processes. This model uses the Prophet algorithm to make predictions and includes its use cases in the manufacturing industry. Make sure to capture your audiences attention in your business displays with our gratis customizable Predictive Analytics Methods Predictive Analytics Forecast Model Introduction Rules PDF. These are great for business strategies, office conferences, capital raising or task suggestions. If you desire to acquire more customers for your tech business and ensure they stay satisfied, create your own sales presentation with these plain slides.
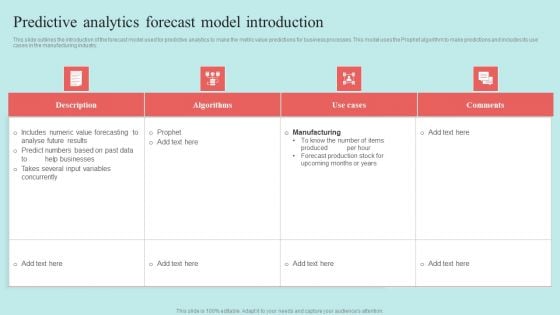
Predictive Data Model Predictive Analytics Forecast Model Introduction Themes PDF

Forecast Analysis Technique IT Predictive Modeling Forecast Model Introduction Diagrams PDF
This slide outlines the introduction of the forecast model used for predictive analytics to make the metric value predictions for business processes. This model uses the Prophet algorithm to make predictions and includes its use cases in the manufacturing industry. If your project calls for a presentation, then Slidegeeks is your go to partner because we have professionally designed, easy to edit templates that are perfect for any presentation. After downloading, you can easily edit Forecast Analysis Technique IT Predictive Modeling Forecast Model Introduction Diagrams PDF and make the changes accordingly. You can rearrange slides or fill them with different images. Check out all the handy templates.
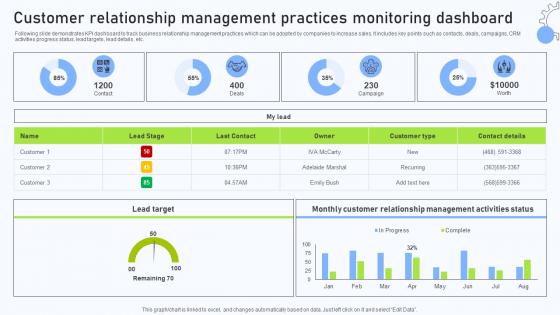
A83 Relationship Management Automation Software Customer Relationship Management
Following slide demonstrates KPI dashboard to track business relationship management practices which can be adopted by companies to increase sales. It includes key points such as contacts, deals, campaigns, CRM activities progress status, lead targets, lead details, etc. Find a pre-designed and impeccable A83 Relationship Management Automation Software Customer Relationship Management. The templates can ace your presentation without additional effort. You can download these easy-to-edit presentation templates to make your presentation stand out from others. So, what are you waiting for Download the template from Slidegeeks today and give a unique touch to your presentation. Following slide demonstrates KPI dashboard to track business relationship management practices which can be adopted by companies to increase sales. It includes key points such as contacts, deals, campaigns, CRM activities progress status, lead targets, lead details, etc.
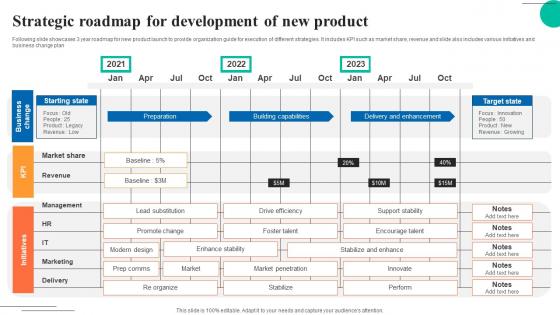
Strategic Roadmap For Development Of New Product Inspiration Pdf
Following slide showcases 3 year roadmap for new product launch to provide organization guide for execution of different strategies. It includes KPI such as market share, revenue and slide also includes various initiatives and business change plan. Pitch your topic with ease and precision using this Strategic Roadmap For Development Of New Product Inspiration Pdf. This layout presents information on Jan, Apr, Jul, Oct. It is also available for immediate download and adjustment. So, changes can be made in the color, design, graphics or any other component to create a unique layout. Following slide showcases 3 year roadmap for new product launch to provide organization guide for execution of different strategies. It includes KPI such as market share, revenue and slide also includes various initiatives and business change plan.
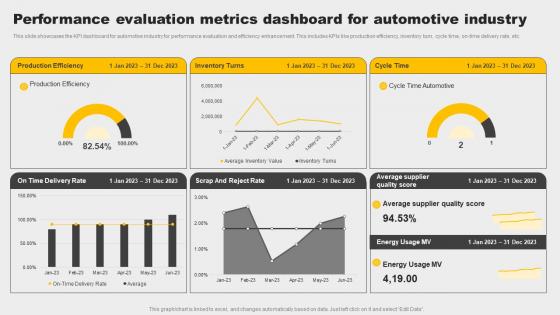
Performance Evaluation Metrics Dashboard For Automotive Industry Mockup Pdf
This slide showcases the KPI dashboard for automotive industry for performance evaluation and efficiency enhancement. This includes KPIs like production efficiency, inventory turn, cycle time, on time delivery rate, etc. Pitch your topic with ease and precision using this Performance Evaluation Metrics Dashboard For Automotive Industry Mockup Pdf. This layout presents information on Production Efficiency, Inventory Turns, Automotive Industry. It is also available for immediate download and adjustment. So, changes can be made in the color, design, graphics or any other component to create a unique layout. This slide showcases the KPI dashboard for automotive industry for performance evaluation and efficiency enhancement. This includes KPIs like production efficiency, inventory turn, cycle time, on time delivery rate, etc.
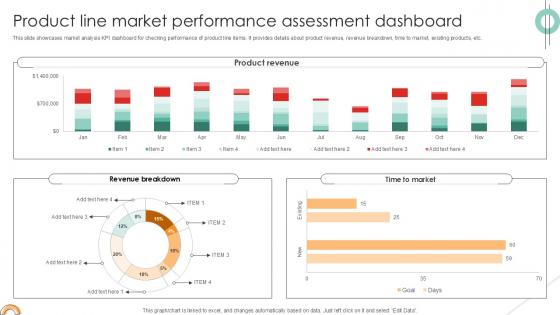
Product Line Market Performance Implementing Product Diversification PPT Sample Strategy SS V
This slide showcases market analysis KPI dashboard for checking performance of product line items. It provides details about product revenue, revenue breakdown, time to market, existing products, etc. Do you know about Slidesgeeks Product Line Market Performance Implementing Product Diversification PPT Sample Strategy SS V. These are perfect for delivering any kind od presentation. Using it, create PowerPoint presentations that communicate your ideas and engage audiences. Save time and effort by using our pre-designed presentation templates that are perfect for a wide range of topic. Our vast selection of designs covers a range of styles, from creative to business, and are all highly customizable and easy to edit. Download as a PowerPoint template or use them as Google Slides themes. This slide showcases market analysis KPI dashboard for checking performance of product line items. It provides details about product revenue, revenue breakdown, time to market, existing products, etc.
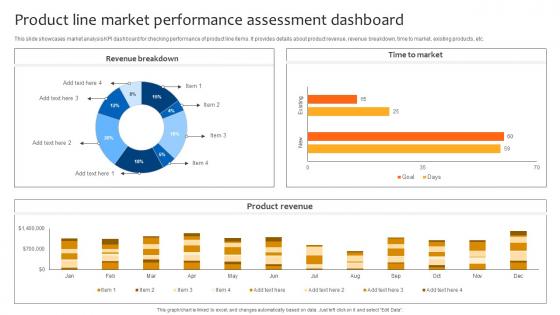
Deploying Strategies For Business Product Line Market Performance Assessment Dashboard Strategy SS V
This slide showcases market analysis KPI dashboard for checking performance of product line items. It provides details about product revenue, revenue breakdown, time to market, existing products, etc. Take your projects to the next level with our ultimate collection of Deploying Strategies For Business Product Line Market Performance Assessment Dashboard Strategy SS V. Slidegeeks has designed a range of layouts that are perfect for representing task or activity duration, keeping track of all your deadlines at a glance. Tailor these designs to your exact needs and give them a truly corporate look with your own brand colors they will make your projects stand out from the rest This slide showcases market analysis KPI dashboard for checking performance of product line items. It provides details about product revenue, revenue breakdown, time to market, existing products, etc.
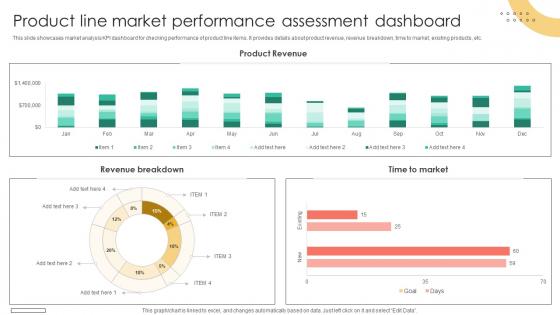
Brand Extension Techniques Product Line Market Performance Assessment Dashboard Strategy SS V
This slide showcases market analysis KPI dashboard for checking performance of product line items. It provides details about product revenue, revenue breakdown, time to market, existing products, etc. This Brand Extension Techniques Product Line Market Performance Assessment Dashboard Strategy SS V from Slidegeeks makes it easy to present information on your topic with precision. It provides customization options, so you can make changes to the colors, design, graphics, or any other component to create a unique layout. It is also available for immediate download, so you can begin using it right away. Slidegeeks has done good research to ensure that you have everything you need to make your presentation stand out. Make a name out there for a brilliant performance. This slide showcases market analysis KPI dashboard for checking performance of product line items. It provides details about product revenue, revenue breakdown, time to market, existing products, etc.
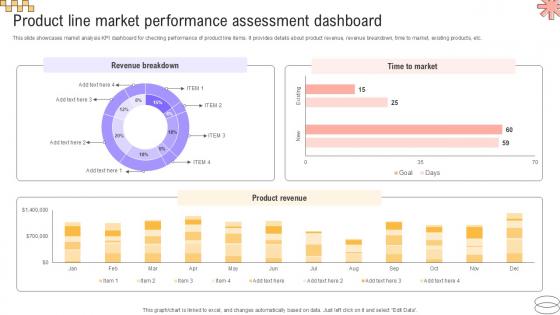
Product Line Market Performance Implementing Geographic Extension PPT Slide Strategy SS V
This slide showcases market analysis KPI dashboard for checking performance of product line items. It provides details about product revenue, revenue breakdown, time to market, existing products, etc. Take your projects to the next level with our ultimate collection of Product Line Market Performance Implementing Geographic Extension PPT Slide Strategy SS V. Slidegeeks has designed a range of layouts that are perfect for representing task or activity duration, keeping track of all your deadlines at a glance. Tailor these designs to your exact needs and give them a truly corporate look with your own brand colors they will make your projects stand out from the rest This slide showcases market analysis KPI dashboard for checking performance of product line items. It provides details about product revenue, revenue breakdown, time to market, existing products, etc.
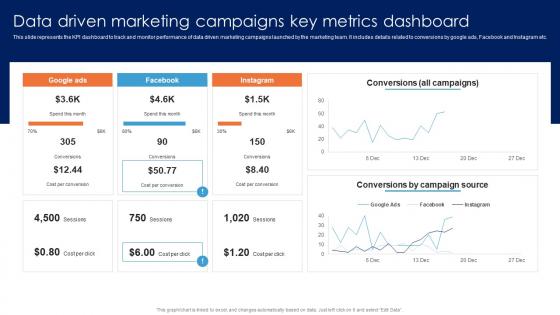
Data Driven Marketing Campaigns Key Metrics Guide For Data Driven Advertising Guidelines Pdf
This slide represents the KPI dashboard to track and monitor performance of data driven marketing campaigns launched by the marketing team. It includes details related to conversions by google ads, Facebook and Instagram etc.The Data Driven Marketing Campaigns Key Metrics Guide For Data Driven Advertising Guidelines Pdf is a compilation of the most recent design trends as a series of slides. It is suitable for any subject or industry presentation, containing attractive visuals and photo spots for businesses to clearly express their messages. This template contains a variety of slides for the user to input data, such as structures to contrast two elements, bullet points, and slides for written information. Slidegeeks is prepared to create an impression. This slide represents the KPI dashboard to track and monitor performance of data driven marketing campaigns launched by the marketing team. It includes details related to conversions by google ads, Facebook and Instagram etc.
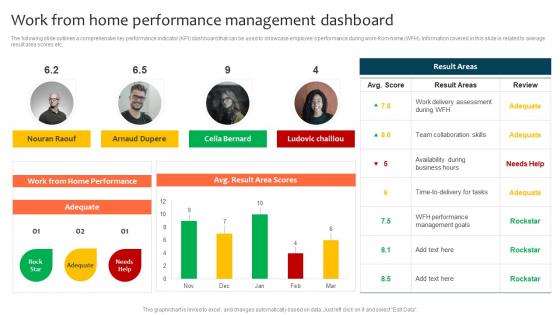
Work From Home Performance Management Dashboard Optimizing Staff Retention Rate Topics Pdf
The following slide outlines a comprehensive key performance indicator KPI dashboard that can be used to showcase employees performance during work-from-home WFH. Information covered in this slide is related to average result area scores etc. This Work From Home Performance Management Dashboard Optimizing Staff Retention Rate Topics Pdf is perfect for any presentation, be it in front of clients or colleagues. It is a versatile and stylish solution for organizing your meetings. The Work From Home Performance Management Dashboard Optimizing Staff Retention Rate Topics Pdf features a modern design for your presentation meetings. The adjustable and customizable slides provide unlimited possibilities for acing up your presentation. Slidegeeks has done all the homework before launching the product for you. So, do not wait, grab the presentation templates today The following slide outlines a comprehensive key performance indicator KPI dashboard that can be used to showcase employees performance during work-from-home WFH. Information covered in this slide is related to average result area scores etc.

Email Newsletter Dashboard Digital Marketing Strategies Improve Enterprise Sales Infographics Pdf
The following slide showcases a key performance indicator KPI dashboard through which managers can measure the impact of email marketing strategy on business performance. The metrics covered in the slide are total conversions, new subscribers, etc. The Email Newsletter Dashboard Digital Marketing Strategies Improve Enterprise Sales Infographics Pdf is a compilation of the most recent design trends as a series of slides. It is suitable for any subject or industry presentation, containing attractive visuals and photo spots for businesses to clearly express their messages. This template contains a variety of slides for the user to input data, such as structures to contrast two elements, bullet points, and slides for written information. Slidegeeks is prepared to create an impression. The following slide showcases a key performance indicator KPI dashboard through which managers can measure the impact of email marketing strategy on business performance. The metrics covered in the slide are total conversions, new subscribers, etc.
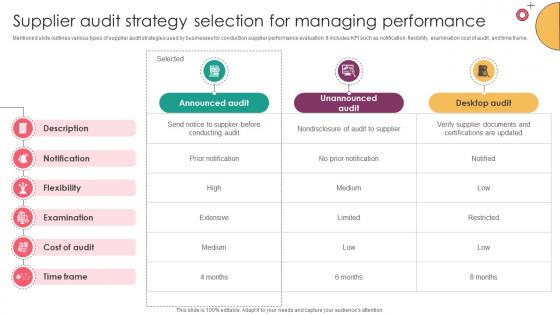
Strategic Supplier Evaluation Supplier Audit Strategy Selection For Managing
Mentioned slide outlines various types of supplier audit strategies used by businesses for conduction supplier performance evaluation. It includes KPI such as notification, flexibility, examination cost of audit, and time frame. The Strategic Supplier Evaluation Supplier Audit Strategy Selection For Managing is a compilation of the most recent design trends as a series of slides. It is suitable for any subject or industry presentation, containing attractive visuals and photo spots for businesses to clearly express their messages. This template contains a variety of slides for the user to input data, such as structures to contrast two elements, bullet points, and slides for written information. Slidegeeks is prepared to create an impression. Mentioned slide outlines various types of supplier audit strategies used by businesses for conduction supplier performance evaluation. It includes KPI such as notification, flexibility, examination cost of audit, and time frame.
Dashboard For Tracking Sales By Various Sales Techniques For Achieving Summary Pdf
This slide covers the KPI dashboard for tracking sales by different categories such as product, region, channel, inventory outstanding, sales growth, actual and target sales, etc. Whether you have daily or monthly meetings, a brilliant presentation is necessary. Dashboard For Tracking Sales By Various Sales Techniques For Achieving Summary Pdf can be your best option for delivering a presentation. Represent everything in detail usingDashboard For Tracking Sales By Various Sales Techniques For Achieving Summary Pdf and make yourself stand out in meetings. The template is versatile and follows a structure that will cater to your requirements. All the templates prepared by Slidegeeks are easy to download and edit. Our research experts have taken care of the corporate themes as well. So, give it a try and see the results. This slide covers the KPI dashboard for tracking sales by different categories such as product, region, channel, inventory outstanding, sales growth, actual and target sales, etc.
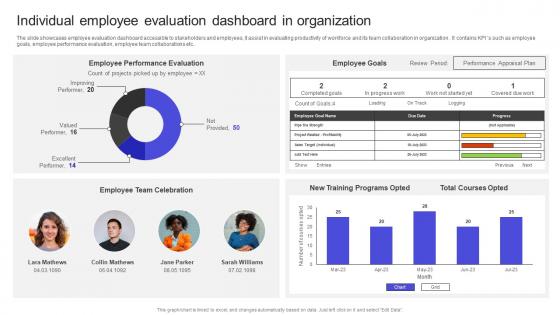
Strategies To Build Meaningful Individual Employee Evaluation Dashboard In Organization Professional Pdf
The slide showcases employee evaluation dashboard accessible to stakeholders and employees, it assist in evaluating productivity of workforce and its team collaboration in organization . It contains KPI s such as employee goals, employee performance evaluation, employee team collaborations etc.. Want to ace your presentation in front of a live audience Our Strategies To Build Meaningful Individual Employee Evaluation Dashboard In Organization Professional Pdf can help you do that by engaging all the users towards you. Slidegeeks experts have put their efforts and expertise into creating these impeccable powerpoint presentations so that you can communicate your ideas clearly. Moreover, all the templates are customizable, and easy-to-edit and downloadable. Use these for both personal and commercial use. The slide showcases employee evaluation dashboard accessible to stakeholders and employees, it assist in evaluating productivity of workforce and its team collaboration in organization . It contains KPI s such as employee goals, employee performance evaluation, employee team collaborations etc..
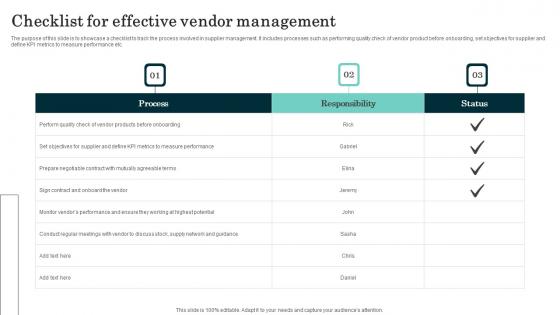
Checklist For Effective Vendor Management Sample Pdf
The purpose of this slide is to showcase a checklist to track the process involved in supplier management. It includes processes such as performing quality check of vendor product before onboarding, set objectives for supplier and define KPI metrics to measure performance etc. Pitch your topic with ease and precision using this Checklist For Effective Vendor Management Sample Pdf. This layout presents information on Process, Responsibility, Status. It is also available for immediate download and adjustment. So, changes can be made in the color, design, graphics or any other component to create a unique layout. The purpose of this slide is to showcase a checklist to track the process involved in supplier management. It includes processes such as performing quality check of vendor product before onboarding, set objectives for supplier and define KPI metrics to measure performance etc.
Tracking Working Of Employees In Software Companies Summary Pdf
Following slide shows tracking employees hours worked in software companies which assist in to check productivity of employee on daily basis. It includes various KPI such as email received, actual response , average working hours, etc. Pitch your topic with ease and precision using this Tracking Working Of Employees In Software Companies Summary Pdf This layout presents information on Tracking Traffic, Tracking Working, Software Companies It is also available for immediate download and adjustment. So, changes can be made in the color, design, graphics or any other component to create a unique layout. Following slide shows tracking employees hours worked in software companies which assist in to check productivity of employee on daily basis. It includes various KPI such as email received, actual response , average working hours, etc.
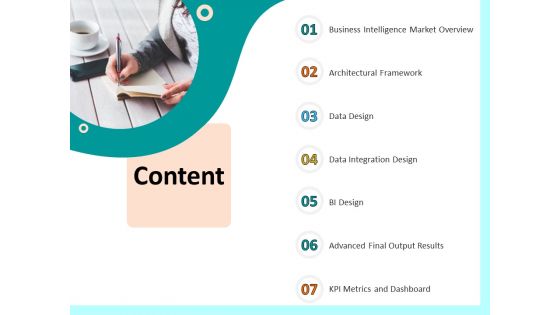
Firm Productivity Administration Content Ppt PowerPoint Presentation Visual Aids Summary PDF
Presenting this set of slides with name firm productivity administration content ppt powerpoint presentation visual aids summary pdf. This is a seven stage process. The stages in this process are business intelligence market overview, architectural framework, data design, data integration design, bi design, advanced final output results, kpi metrics and dashboard. This is a completely editable PowerPoint presentation and is available for immediate download. Download now and impress your audience.
Dashboard For Tracking Employee Satisfaction Rate Detailed Personnel Slides Pdf
This slide covers KPI dashboard to measure employee satisfaction due to effective internal communication. It includes indicators such as net promoter score, retention rate, absenteeism etc. This Dashboard For Tracking Employee Satisfaction Rate Detailed Personnel Slides Pdf is perfect for any presentation, be it in front of clients or colleagues. It is a versatile and stylish solution for organizing your meetings. The Dashboard For Tracking Employee Satisfaction Rate Detailed Personnel Slides Pdf features a modern design for your presentation meetings. The adjustable and customizable slides provide unlimited possibilities for acing up your presentation. Slidegeeks has done all the homework before launching the product for you. So, do not wait, grab the presentation templates today This slide covers KPI dashboard to measure employee satisfaction due to effective internal communication. It includes indicators such as net promoter score, retention rate, absenteeism etc.
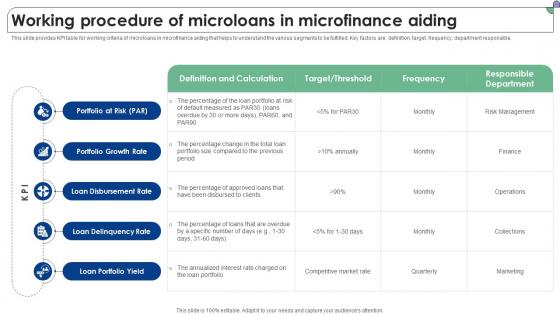
Working Procedure Of Microloans In Microfinance Aiding Complete Guide To Microfinance Fin SS V
This slide provides KPI table for working criteria of microloans in microfinance aiding that helps to understand the various segments to be fulfilled. Key factors are definition, target, frequency, department responsible. This Working Procedure Of Microloans In Microfinance Aiding Complete Guide To Microfinance Fin SS V is perfect for any presentation, be it in front of clients or colleagues. It is a versatile and stylish solution for organizing your meetings. The Working Procedure Of Microloans In Microfinance Aiding Complete Guide To Microfinance Fin SS V features a modern design for your presentation meetings. The adjustable and customizable slides provide unlimited possibilities for acing up your presentation. Slidegeeks has done all the homework before launching the product for you. So, do not wait, grab the presentation templates today This slide provides KPI table for working criteria of microloans in microfinance aiding that helps to understand the various segments to be fulfilled. Key factors are definition, target, frequency, department responsible.


 Continue with Email

 Home
Home


