Line Graph

Stacked Line Ppt PowerPoint Presentation Professional Graphics Pictures
This is a stacked line ppt powerpoint presentation professional graphics pictures. This is a two stage process. The stages in this process are revenue in percentage, business, marketing, graph, finance.

Stacked Line With Markers Ppt PowerPoint Presentation Pictures Design Templates
This is a stacked line with markers ppt powerpoint presentation pictures design templates. This is a one stage process. The stages in this process are business, marketing, finance, in million, graph.
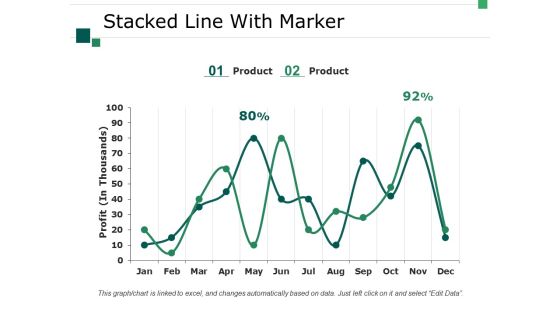
Stacked Line With Marker Ppt PowerPoint Presentation Professional Designs Download
This is a stacked line with marker ppt powerpoint presentation professional designs download. This is a two stage process. The stages in this process are business, marketing, strategy, graph, profit.

Clustered Column Line Ppt PowerPoint Presentation Model Graphics Tutorials
This is a clustered column line ppt powerpoint presentation model graphics tutorials. This is a three stage process. The stages in this process are business, marketing, in percentage, finance, graph.
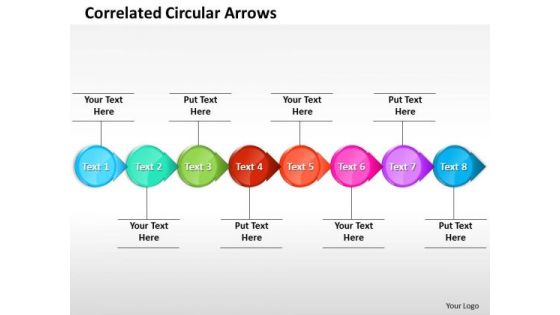
Ppt Correlated Circular Arrows PowerPoint Templates Horizontal Line 8 Stages
PPT correlated circular arrows powerpoint templates horizontal line 8 stages-This PowerPoint Diagram shows you Correlated Circular Arrows in Horizontal Line which signifies step by step Execution, inter-related approaches etc.-PPT correlated circular arrows powerpoint templates horizontal line 8 stages-8 Steps, 8 Steps Diagram, Arrow, Artfulness, Chart, Circle, Circular, Circulation, Concept, Connection, Continuity, Correlate, Course, Diagram, Direction, Duplicate, Flow, Four, Iterate, Manage, Method, Order, Phase, Presentation, Procedure, Process, React, Recycle, Refresh, Relate, Repeat, Repetition, Report, Review, Section, Sequence, Simple, Stage, Step, Strategy, Success, Swirl, System, Work Flow
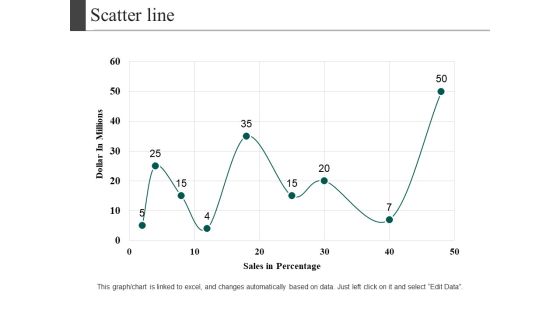
Scatter Line Ppt PowerPoint Presentation Visual Aids Diagrams
This is a scatter line ppt powerpoint presentation visual aids diagrams. This is a one stage process. The stages in this process are dollar in millions, sales in percentage, growth, business, marketing.

Scatter Line Ppt PowerPoint Presentation Styles Graphics Pictures
This is a scatter line ppt powerpoint presentation styles graphics pictures. This is a one stage process. The stages in this process are product, dollar in millions, sales in percentage.

Scatter Line Ppt PowerPoint Presentation Infographics Background Images
This is a scatter line ppt powerpoint presentation infographics background images. This is a one stage process. The stages in this process are dollar in millions, product, sales in percentage.

Clustered Column Line Chart Ppt PowerPoint Presentation Professional Slides
This is a clustered column line chart ppt powerpoint presentation professional slides. This is a four stage process. The stages in this process are bar, finance, business, marketing, growth.

Clustered Column Line Ppt PowerPoint Presentation Inspiration Visual Aids
This is a clustered column line ppt powerpoint presentation inspiration visual aids. This is a four stage process. The stages in this process are business, marketing, strategy, planning, bar chart.

Regression Line Chart Ppt PowerPoint Presentation Visual Aids Summary
This is a regression line chart ppt powerpoint presentation visual aids summary. This is a two stage process. The stages in this process are linear periodization, linear growth, linear progression.
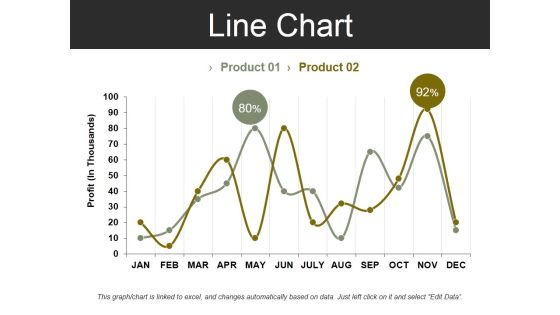
Line Chart Template 2 Ppt PowerPoint Presentation Summary Design Inspiration
This is a line chart template 2 ppt powerpoint presentation summary design inspiration. This is a two stage process. The stages in this process are profit, business, marketing, finance, chart.
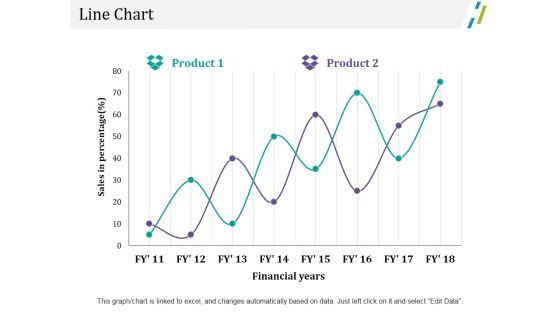
Line Chart Ppt PowerPoint Presentation Outline File Formats
This is a line chart ppt powerpoint presentation outline file formats. This is a two stage process. The stages in this process are business, marketing, sales in percentage, financial years, chart.
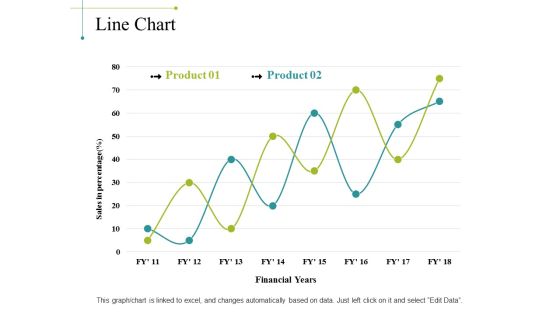
Line Chart Ppt PowerPoint Presentation Portfolio Background Image
This is a line chart ppt powerpoint presentation portfolio background image. This is a two stage process. The stages in this process are sales in percentage, financial years, chart, business, marketing, finance.
Stacked Line Chart Ppt PowerPoint Presentation Show Icon
This is a stacked line chart ppt powerpoint presentation show icon. This is a two stage process. The stages in this process are profit, chart, years, business, marketing, years.

Line Chart Ppt PowerPoint Presentation Show Background Designs
This is a line chart ppt powerpoint presentation show background designs. This is a two stage process. The stages in this process are product, in months, in percentage, business.
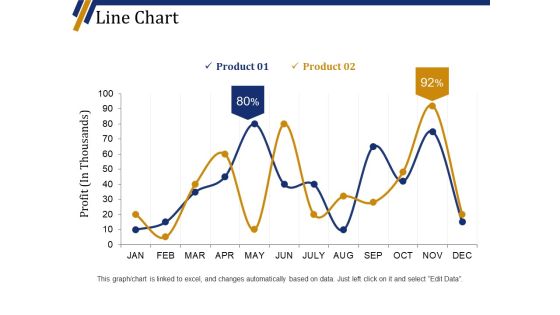
Line Chart Ppt PowerPoint Presentation Portfolio Background Designs
This is a line chart ppt powerpoint presentation portfolio background designs. This is a two stage process. The stages in this process are product, business, finance, marketing, profit in thousands.

Line Chart Ppt PowerPoint Presentation Infographics Graphic Images
This is a line chart ppt powerpoint presentation infographics graphic images. This is a two stage process. The stages in this process are sales in percentage, financial years, growth, business, marketing.

Line Chart Ppt PowerPoint Presentation Professional Graphics Design
This is a line chart ppt powerpoint presentation professional graphics design. This is a two stage process. The stages in this process are financial years, sales in percentage, product, growth, success.

Line Chart Ppt PowerPoint Presentation File Example File
This is a line chart ppt powerpoint presentation file example file. This is a two stage process. The stages in this process are product, in percentage, in years, growth, success.
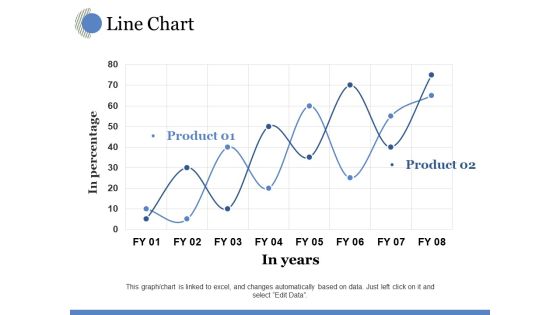
Line Chart Ppt PowerPoint Presentation Model Visual Aids
This is a line chart ppt powerpoint presentation model visual aids. This is a two stage process. The stages in this process are in years, in percentage, growth, business, marketing.

Clustered Column Line Chart Ppt PowerPoint Presentation Inspiration Graphics Pictures
This is a clustered column line chart ppt powerpoint presentation inspiration graphics pictures. This is a four stage process. The stages in this process are business, marketing, strategy, planning, finance.

Line Chart Ppt PowerPoint Presentation Infographic Template Master Slide
This is a line chart ppt powerpoint presentation infographic template master slide. This is a two stage process. The stages in this process are product, financial years, sales in percentage.
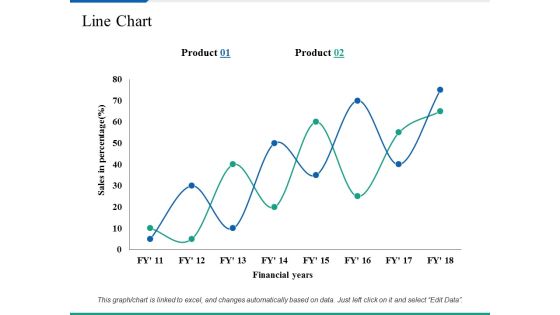
Line Chart Ppt PowerPoint Presentation Summary Clipart Images
This is a line chart ppt powerpoint presentation summary clipart images. This is a two stage process. The stages in this process are business, marketing, sales in percentage, financial years, strategy.
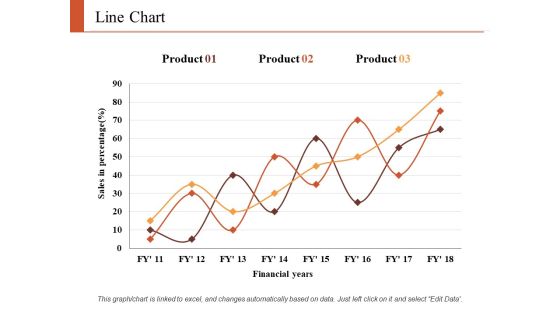
Line Chart Finance Ppt PowerPoint Presentation Infographic Template Graphics Tutorials
This is a line chart finance ppt powerpoint presentation infographic template graphics tutorials. This is a three stage process. The stages in this process are finance, marketing, analysis, business, investment.

Stacked Line With Marker Ppt PowerPoint Presentation Infographics Images
This is a stacked line with marker ppt powerpoint presentation infographics images. This is a twelve stage process. The stages in this process are business, marketing, strategy, finance, success.
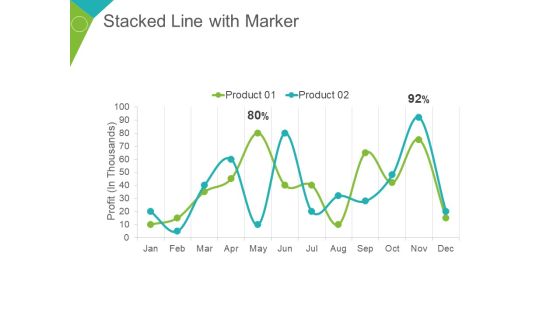
Stacked Line With Marker Ppt PowerPoint Presentation Summary Demonstration
This is a stacked line with marker ppt powerpoint presentation summary demonstration. This is a two stage process. The stages in this process are profit in thousands, product, percentage, finance, business.
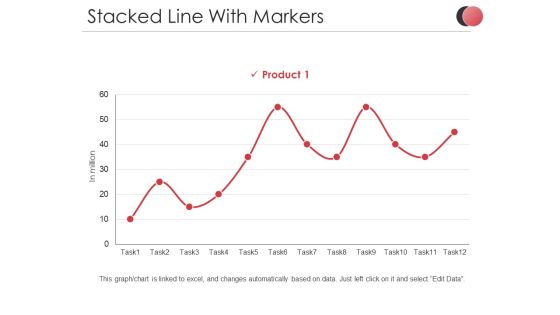
Stacked Line With Markers Ppt PowerPoint Presentation Slides Demonstration
This is a stacked line with markers ppt powerpoint presentation slides demonstration. This is a one stage process. The stages in this process are in million, product, percentage, business, marketing, finance.

Stacked Line Ppt PowerPoint Presentation Infographic Template Graphics Template
This is a stacked line ppt powerpoint presentation infographic template graphics template. This is a three stage process. The stages in this process are product, in percentage, business, marketing, finance.
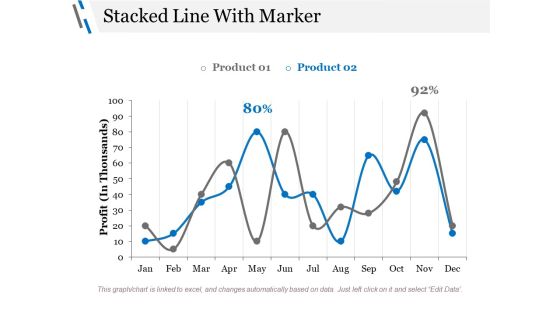
Stacked Line With Marker Ppt PowerPoint Presentation Styles Graphics Design
This is a stacked line with marker ppt powerpoint presentation styles graphics design. This is a three stage process. The stages in this process are profit, business, marketing, finance, percentage.

Clustered Column Line Ppt PowerPoint Presentation Infographics Graphics Design
This is a clustered column line ppt powerpoint presentation infographics graphics design. This is a three stage process. The stages in this process are finance, marketing, business, analysis, management.

Clustered Column Line Ppt PowerPoint Presentation Summary Slide
This is a clustered column line ppt powerpoint presentation summary slide. This is a three stage process. The stages in this process are clustered column, finance, analysis, strategy, business.

Stacked Line With Markers Ppt PowerPoint Presentation Inspiration Example Topics
This is a stacked line with markers ppt powerpoint presentation inspiration example topics. This is a twelve stage process. The stages in this process are business, marketing, strategy, planning, finance.
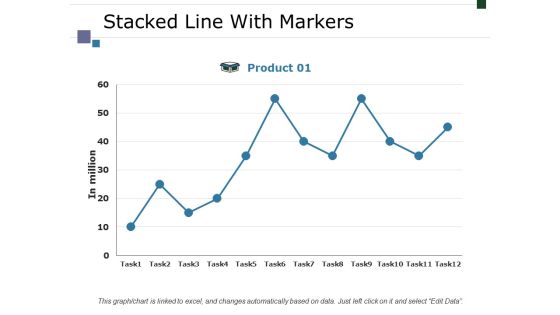
Stacked Line With Markers Ppt PowerPoint Presentation Layouts Display
This is a stacked line with markers ppt powerpoint presentation layouts display. This is a one stage process. The stages in this process are business, marketing, strategy, in million, finance.

Clustered Column Line Ppt PowerPoint Presentation Layouts Graphics Tutorials
This is a clustered column line ppt powerpoint presentation layouts graphics tutorials. This is a three stage process. The stages in this process are marketing, business, management, planning, strategy.

Clustered Column Line Financial Ppt PowerPoint Presentation Summary Slide
This is a clustered column line financial ppt powerpoint presentation summary slide. This is a three stage process. The stages in this process are business, management, marketing, product, percentage.

Clustered Column Line Investment Ppt PowerPoint Presentation Styles Smartart
This is a clustered column line investment ppt powerpoint presentation styles smartart. This is a three stage process. The stages in this process are finance, analysis, business, investment, marketing.

Clustered Column Line Analysis Ppt PowerPoint Presentation Layouts Visual Aids
This is a clustered column line analysis ppt powerpoint presentation layouts visual aids. This is a three stage process. The stages in this process are percentage, product, business, management.
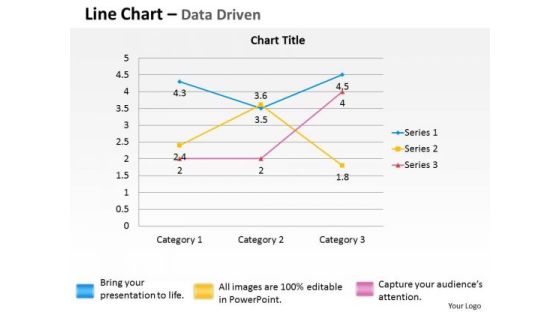
Quantitative Data Analysis Driven Economic Line Chart PowerPoint Slides Templates
Break The Deadlock With Our quantitative data analysis driven economic line chart powerpoint slides Templates . Let The Words Start To Flow.
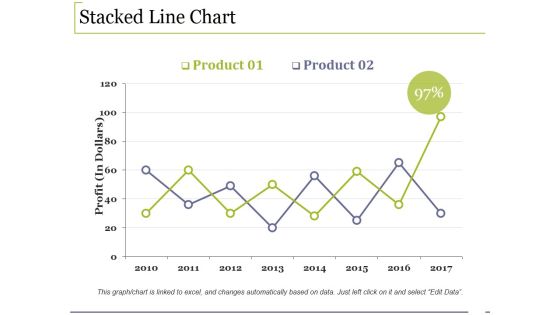
Stacked Line Chart Ppt PowerPoint Presentation Ideas Styles
This is a stacked line chart ppt powerpoint presentation ideas styles. This is a two stage process. The stages in this process are growth, finance, analysis, management, business.
Matrix Reporting Line For Multinational Management Icons PDF
This slide showcases matrix reporting line that can help in promoting open communication in organization and improve collaboration in projects. It can also help business in faster decision making Presenting matrix reporting line for multinational management icons pdf to dispense important information. This template comprises three stages. It also presents valuable insights into the topics including quality manager, contract managers, plant department, procurement manager. This is a completely customizable PowerPoint theme that can be put to use immediately. So, download it and address the topic impactfully.

BCG Matrix To Analyse Apples Product Line Ppt Good PDF
This slide provides information regarding BCG matrix to assess existing Apples product line. The planning tool helps to assess firms products and services to decide what offerings to keep, sell or invest more in. Make sure to capture your audiences attention in your business displays with our gratis customizable BCG Matrix To Analyse Apples Product Line Ppt Good PDF. These are great for business strategies, office conferences, capital raising or task suggestions. If you desire to acquire more customers for your tech business and ensure they stay satisfied, create your own sales presentation with these plain slides.
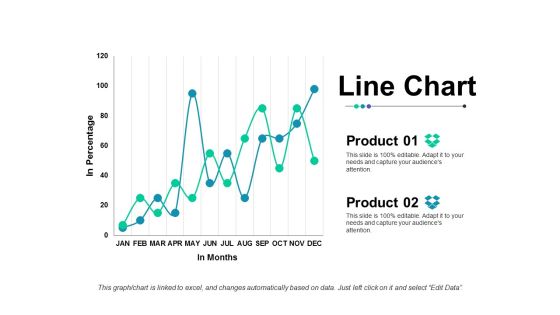
Line Chart Ppt Powerpoint Presentation Outline Slide Portrait
This is a line chart ppt powerpoint presentation outline slide portrait. This is a two stage process. The stages in this process are line chart, finance, strategy, business, analysis.

Clustered Column Line Ppt PowerPoint Presentation Model Images
This is a clustered column line ppt powerpoint presentation model images. This is a four stage process. The stages in this process are sales in percentage, product, business, marketing, bar graph.

Revenue By Business Line Ppt PowerPoint Presentation Example File
This is a revenue by business line ppt powerpoint presentation example file. This is a four stage process. The stages in this process are product, growth, graph, business, success.

Clustered Column Line Ppt PowerPoint Presentation Model Rules
This is a clustered column line ppt powerpoint presentation model rules. This is a four stage process. The stages in this process are financial year, sales in percentage, business, marketing, growth, graph.

BCG Matrix To Analyse Apples Product Line Designs PDF
This slide provides information regarding BCG matrix to assess existing Apples product line. The planning tool helps to assess firms products and services to decide what offerings to keep, sell or invest more in. Slidegeeks is one of the best resources for PowerPoint templates. You can download easily and regulate BCG Matrix To Analyse Apples Product Line Designs PDF for your personal presentations from our wonderful collection. A few clicks is all it takes to discover and get the most relevant and appropriate templates. Use our Templates to add a unique zing and appeal to your presentation and meetings. All the slides are easy to edit and you can use them even for advertisement purposes.

Clustered Column Line Chart Ppt PowerPoint Presentation File Pictures
This is a clustered column line chart ppt powerpoint presentation file pictures. This is a four stage process. The stages in this process are clustered bar, product, planning, business, sales in percentage.

Stacked Line With Marker Ppt PowerPoint Presentation Ideas Themes
This is a stacked line with marker ppt powerpoint presentation ideas themes. This is a two stage process. The stages in this process are profit, stacked bar, product, business, marketing.

Line Bubble Chart Ppt PowerPoint Presentation Portfolio Slide Portrait
This is a line bubble chart ppt powerpoint presentation portfolio slide portrait. This is a six stage process. The stages in this process are highest profit, financial year, profit in sales, growth, business.
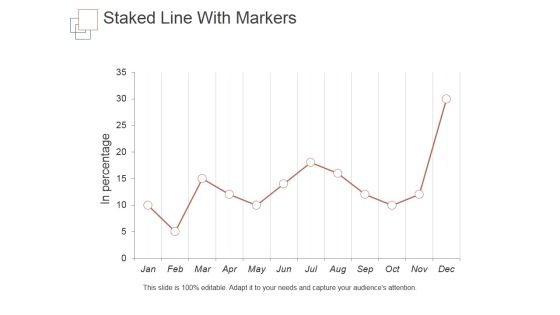
Staked Line With Markers Ppt PowerPoint Presentation Introduction
This is a staked line with markers ppt powerpoint presentation introduction. This is a one stage process. The stages in this process are in percentage, business, marketing, success, management.
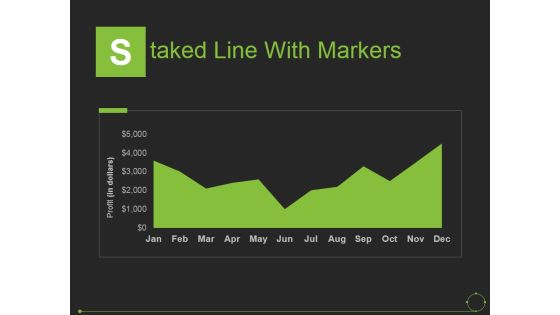
Staked Line With Markers Ppt PowerPoint Presentation Pictures Examples
This is a staked line with markers ppt powerpoint presentation pictures examples. This is a one stage process. The stages in this process are years, profit, product, business, marketing.

Clustered Column Line Ppt PowerPoint Presentation File Examples
This is a clustered column line ppt powerpoint presentation file examples. This is a three stage process. The stages in this process are sales in percentage, product, business, marketing, success.
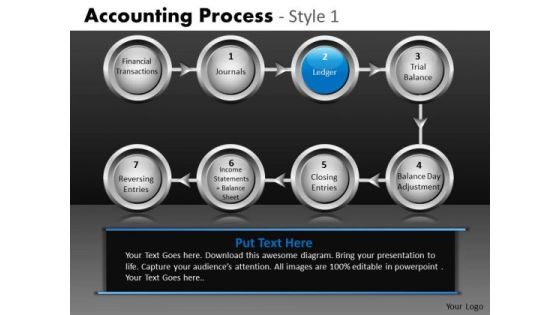
Straight Line Process Chart PowerPoint Slides Ppt Templates
Straight Line Process Chart PowerPoint Slides PPT templates-These high quality powerpoint pre-designed slides and powerpoint templates have been carefully created by our professional team to help you impress your audience. All slides have been created and are 100% editable in powerpoint. Each and every property of any graphic - color, size, orientation, shading, outline etc. can be modified to help you build an effective powerpoint presentation. Any text can be entered at any point in the powerpoint template or slide. Simply DOWNLOAD, TYPE and PRESENT! These PowerPoint presentation slides can be used to represent themes relating to -
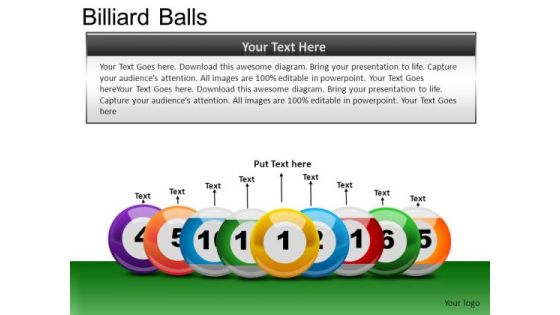
Line Up Billiard Balls PowerPoint Slides And Ppt Diagram Templates
Line Up Billiard Balls PowerPoint Slides And PPT Diagram Templates-These high quality powerpoint pre-designed slides and powerpoint templates have been carefully created by our professional team to help you impress your audience. All slides have been created and are 100% editable in powerpoint. Each and every property of any graphic - color, size, orientation, shading, outline etc. can be modified to help you build an effective powerpoint presentation. Any text can be entered at any point in the powerpoint template or slide. Simply DOWNLOAD, TYPE and PRESENT!

Commodity Line Expansion Ppt PowerPoint Presentation Complete Deck With Slides
This Commodity Line Expansion Ppt PowerPoint Presentation Complete Deck With Slides is designed to help you retain your audiences attention. This content-ready PowerPoint Template enables you to take your audience on a journey and share information in a way that is easier to recall. It helps you highlight the crucial parts of your work so that the audience does not get saddled with information download. This fifteen slide PPT Deck comes prepared with the graphs and charts you could need to showcase your information through visuals. You only need to enter your own data in them. Download this editable PowerPoint Theme and walk into that meeting with confidence.

Templates Free Download Process Analysis Clothing Line Business Plan PowerPoint
We present our templates free download process analysis clothing line business plan PowerPoint.Download our Circle Charts PowerPoint Templates because You can Create a matrix with our PowerPoint Templates and Slides. Feel the strength of your ideas click into place. Present our Arrows PowerPoint Templates because Our PowerPoint Templates and Slides are conceived by a dedicated team. Use them and give form to your wondrous ideas. Download and present our Shapes PowerPoint Templates because Our PowerPoint Templates and Slides are a sure bet. Gauranteed to win against all odds. Use our Business PowerPoint Templates because It will Strengthen your hand with your thoughts. They have all the aces you need to win the day. Download our Process and Flows PowerPoint Templates because It will mark the footprints of your journey. Illustrate how they will lead you to your desired destination.Use these PowerPoint slides for presentations relating to achieve, achievement, analysis, background, brainstorm, brand, business, chart, commerce, communication, conceptual, conference, consultant, cooperation, corporate, diagram, executive, financial, formula, goal, guide, idea, innovation, management, market, marketing, mba, method, mission, motivation, operations, organization, organize, performance, process, program, resource, scheme, solution, strategy, success, successful, tactic, target, teamwork, text, vision, work. The prominent colors used in the PowerPoint template are Blue, Gray, Black.

Business Graph Success PowerPoint Presentation Slides C
Microsoft Powerpoint Slides and Backgrounds with isolated image of a young business man drawing increasing graphics with red line
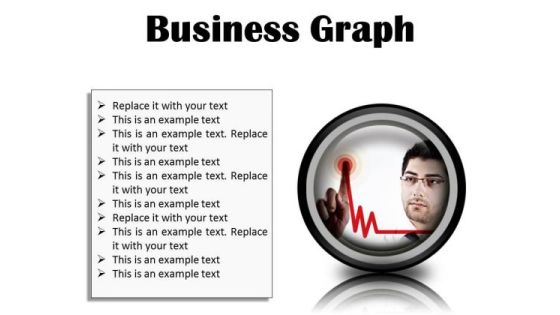
Business Graph Success PowerPoint Presentation Slides Cc
Microsoft Powerpoint Slides and Backgrounds with isolated image of a young business man drawing increasing graphics with red line

Business Graph Success PowerPoint Presentation Slides F
Microsoft Powerpoint Slides and Backgrounds with isolated image of a young business man drawing increasing graphics with red line
 Home
Home