Line Graph
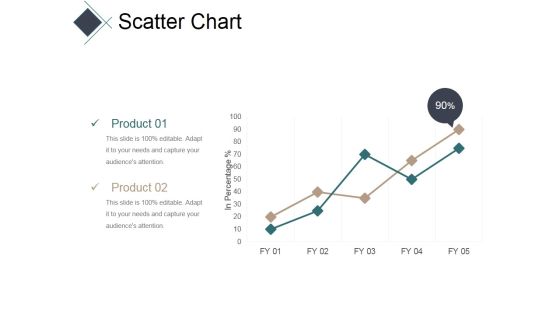
Scatter Chart Ppt PowerPoint Presentation Pictures Slide Portrait
This is a scatter chart ppt powerpoint presentation pictures slide portrait. This is a two stage process. The stages in this process are business, line, graph, success, finance.

Bar Chart With Annual Performance Analysis Over Years Ppt PowerPoint Presentation Design Ideas
This is a bar chart with annual performance analysis over years ppt powerpoint presentation design ideas. This is a five stage process. The stages in this process are business, strategy, marketing, analysis, line graph.
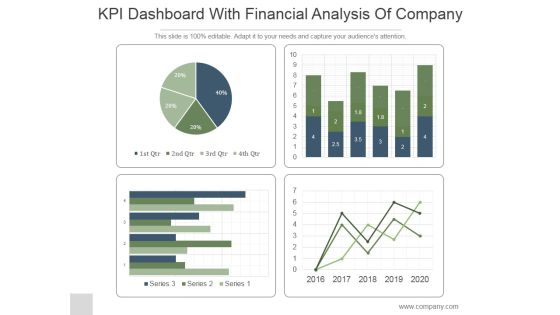
KPI Dashboard With Financial Analysis Of Company Ppt PowerPoint Presentation Backgrounds
This is a kpi dashboard with financial analysis of company ppt powerpoint presentation backgrounds. This is a four stage process. The stages in this process are business, strategy, marketing, line graph, finance.
Lead To Customer Performance Ppt PowerPoint Presentation Icon Show
This is a lead to customer performance ppt powerpoint presentation icon show. This is a one stage process. The stages in this process are line graph, marketing, presentation, business, management.

Analysis Techniques Pareto Analysis Ppt PowerPoint Presentation Example
This is a analysis techniques pareto analysis ppt powerpoint presentation example. This is a ten stage process. The stages in this process are business, strategy, bar graph, line graph, process.
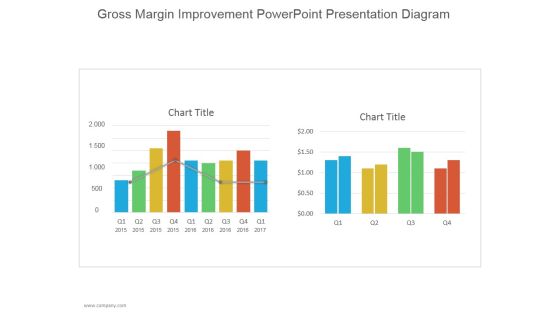
Gross Margin Improvement Ppt PowerPoint Presentation Tips
This is a gross margin improvement ppt powerpoint presentation tips. This is a two stage process. The stages in this process are chart title, business, strategy, marketing, line graph, chart and graph.

Leads To Customer Performance Ppt Powerpoint Presentation Styles Master Slide
This is a leads to customer performance ppt powerpoint presentation styles master slide. This is a eight stage process. The stages in this process are line graph, week, graph, growth.
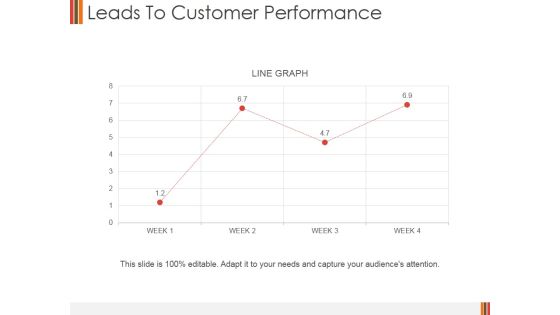
Leads To Customer Performance Ppt PowerPoint Presentation Summary Topics
This is a leads to customer performance ppt powerpoint presentation summary topics. This is a four stage process. The stages in this process are line graph, growth, analysis, strategy, business.
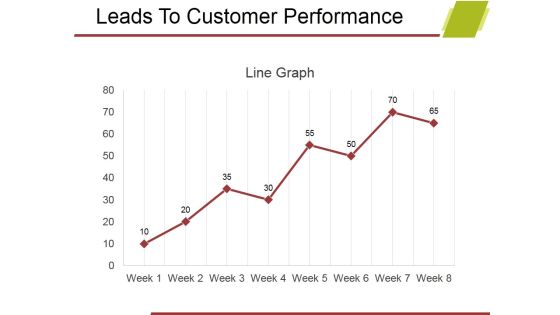
Leads To Customer Performance Ppt PowerPoint Presentation Professional Background Designs
This is a leads to customer performance ppt powerpoint presentation professional background designs. This is a eight stage process. The stages in this process are business, line graph, marketing, growth, management.

American Financial Background PowerPoint Templates And PowerPoint Backgrounds 0711
Microsoft PowerPoint Template and Background with vintage united states silver certificate under red white and blue american flag with declining graph line
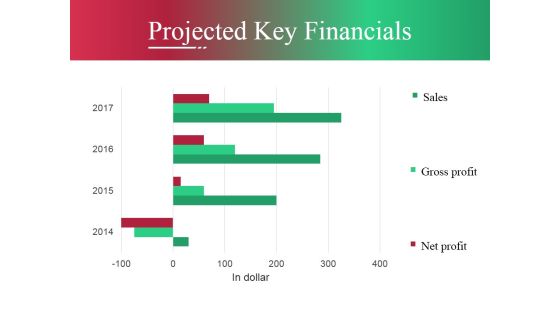
Projected Key Financials Ppt PowerPoint Presentation Pictures Master Slide
This is a projected key financials ppt powerpoint presentation pictures master slide. This is a three stage process. The stages in this process are business, marketing, line, graph, success.

Quantitative Data Analysis Representation Methods With Benefits Template PDF
This slide describes multiple options available for marketers to display the analysis of collected information to derive business insights. It covers methods such as, bar chart, histogram and line graphs. Persuade your audience using this Quantitative Data Analysis Representation Methods With Benefits Template PDF. This PPT design covers four stages, thus making it a great tool to use. It also caters to a variety of topics including Bar Chart, Histogram, Line Graphs. Download this PPT design now to present a convincing pitch that not only emphasizes the topic but also showcases your presentation skills.
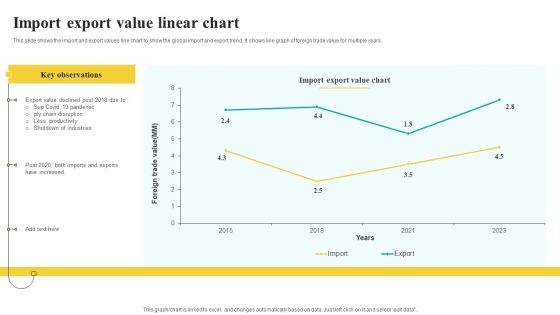
Import Export Value Linear Chart Summary PDF
This slide shows the import and export values line chart to show the global import and export trend. It shows line graph of foreign trade value for multiple years Showcasing this set of slides titled Import Export Value Linear Chart Summary PDF. The topics addressed in these templates are Key Observations, Value Chart, Industries. All the content presented in this PPT design is completely editable. Download it and make adjustments in color, background, font etc. as per your unique business setting.

Client Referrals Ppt PowerPoint Presentation Tips
This is a client referrals ppt powerpoint presentation tips. This is a three stage process. The stages in this process are business, marketing, management, bar graph, line bar.

Combo Chart Ppt PowerPoint Presentation Infographics Slideshow
This is a combo chart ppt powerpoint presentation infographics slideshow. This is a three stage process. The stages in this process are business, marketing, graph, line chart, growth.

Data Handling Types With Frequency Distribution Ppt PowerPoint Presentation Icon Diagrams PDF
Presenting data handling types with frequency distribution ppt powerpoint presentation icon diagrams pdf to dispense important information. This template comprises seven stages. It also presents valuable insights into the topics including frequency distribution, line graph, pictograph. This is a completely customizable PowerPoint theme that can be put to use immediately. So, download it and address the topic impactfully.

Yearly Staff Engagement Trend Statistics Demonstration PDF
This slide represents the line graph for analyzing employee engagement trend . It includes the statistics such as percentage of engaged and actively disengaged employees. Pitch your topic with ease and precision using this Yearly Staff Engagement Trend Statistics Demonstration PDF. This layout presents information on Team, Employees, Average. It is also available for immediate download and adjustment. So, changes can be made in the color, design, graphics or any other component to create a unique layout.
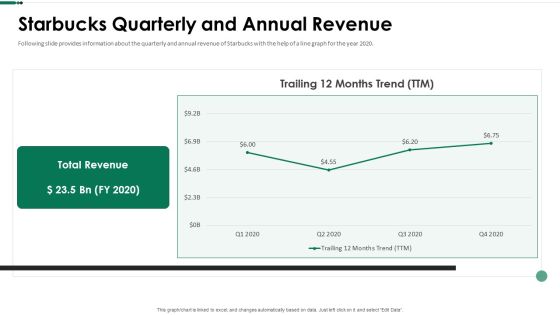
Starbucks Quarterly And Annual Revenue Ppt Slides Introduction PDF
Following slide provides information about the quarterly and annual revenue of Starbucks with the help of a line graph for the year 2020. Deliver and pitch your topic in the best possible manner with this starbucks quarterly and annual revenue ppt slides introduction pdf. Use them to share invaluable insights on starbucks quarterly and annual revenue and impress your audience. This template can be altered and modified as per your expectations. So, grab it now.
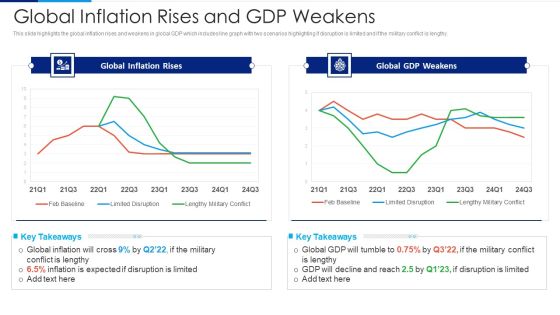
Russia Ukraine Conflict Effect Global Inflation Rises And Gdp Weakens Professional PDF
This slide highlights the global inflation rises and weakens in global GDP which includes line graph with two scenarios highlighting if disruption is limited and if the military conflict is lengthy. Deliver an awe inspiring pitch with this creative Russia Ukraine Conflict Effect Global Inflation Rises And Gdp Weakens Professional PDF bundle. Topics like Global Inflation Rises, Global GDP Weakens can be discussed with this completely editable template. It is available for immediate download depending on the needs and requirements of the user.

Recruitment Training To Optimize Hiring Manager Satisfaction With Recruitment Process Topics PDF
This slide provides the line graph of hiring manager satisfaction rate that shows improvement in satisfaction rate after implementing the recruitment training program. Deliver an awe inspiring pitch with this creative Recruitment Training To Optimize Hiring Manager Satisfaction With Recruitment Process Topics PDF bundle. Topics like New Recruitment Training Program, New Recruitment Training Program, 2019 TO 2023 can be discussed with this completely editable template. It is available for immediate download depending on the needs and requirements of the user.
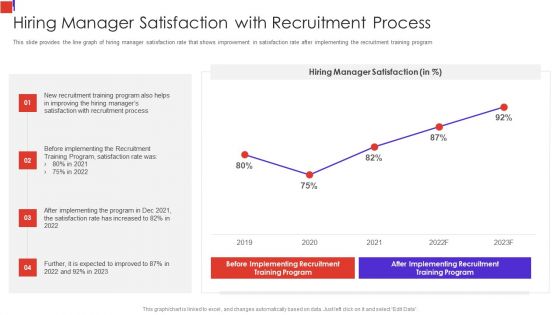
Outline Of Employee Recruitment Hiring Manager Satisfaction With Recruitment Process Clipart PDF
This slide provides the line graph of hiring manager satisfaction rate that shows improvement in satisfaction rate after implementing the recruitment training program Deliver and pitch your topic in the best possible manner with this Outline Of Employee Recruitment Hiring Manager Satisfaction With Recruitment Process Clipart PDF Use them to share invaluable insights on Recruitment Training, Improving The Hiring, Satisfaction With Recruitment and impress your audience. This template can be altered and modified as per your expectations. So, grab it now.

Recruitment Training Program For Workforce Hiring Manager Satisfaction With Recruitment Process Infographics PDF
This slide provides the line graph of hiring manager satisfaction rate that shows improvement in satisfaction rate after implementing the recruitment training program Deliver and pitch your topic in the best possible manner with this Recruitment Training Program For Workforce Hiring Manager Satisfaction With Recruitment Process Infographics PDF Use them to share invaluable insights on Recruitment Training Program, Improving The Hiring Managers, Recruitment Process and impress your audience. This template can be altered and modified as per your expectations. So, grab it now.

Recruitment Training Enhance Candidate Hiring Process Hiring Manager Satisfaction With Recruitment Process Slides PDF
This slide provides the line graph of hiring manager satisfaction rate that shows improvement in satisfaction rate after implementing the recruitment training program. Deliver and pitch your topic in the best possible manner with this recruitment training enhance candidate hiring process hiring manager satisfaction with recruitment process slides pdf. Use them to share invaluable insights on hiring manager satisfaction with recruitment process and impress your audience. This template can be altered and modified as per your expectations. So, grab it now.
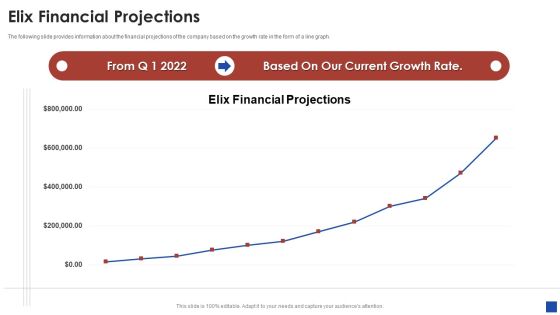
Elix Incubator Venture Capital Funding Elix Financial Projections Background PDF
The following slide provides information about the financial projections of the company based on the growth rate in the form of a line graph. Deliver an awe inspiring pitch with this creative elix incubator venture capital funding elix financial projections background pdf bundle. Topics like elix financial projections can be discussed with this completely editable template. It is available for immediate download depending on the needs and requirements of the user.

Canva Pro Business Profile Revenue From Fy2016 To 2021 Sample PDF
This slide highlights the Canva revenue from 2016 to 2021 through line graph. It showcases that Canva reported revenue of doller 1 BN in 2021 and reached 500k customers in 2022. Deliver an awe inspiring pitch with this creative Canva Pro Business Profile Revenue From Fy2016 To 2021 Sample PDF bundle. Topics like Customers, Revenue can be discussed with this completely editable template. It is available for immediate download depending on the needs and requirements of the user.

Business Profitability And Growth Dashboard For Capital Fundraising Ppt Slides Guide PDF
This slide illustrates graphical representation of company growth journey for investors. It includes profitability graph of 15 years, cash usage pie-chart, and share performance line graph. Showcasing this set of slides titled Business Profitability And Growth Dashboard For Capital Fundraising Ppt Slides Guide PDF. The topics addressed in these templates are Judicious Cash Usage, Share Performance, Respect To Benchmark. All the content presented in this PPT design is completely editable. Download it and make adjustments in color, background, font etc. as per your unique business setting.

Client Referrals Ppt PowerPoint Presentation Example 2015
This is a client referrals ppt powerpoint presentation example 2015. This is a three stage process. The stages in this process are business, marketing, management, bar graph, line bar.

4 Quarters Track Record Template 1 Ppt PowerPoint Presentation Slides Example
This is a 4 quarters track record template 1 ppt powerpoint presentation slides example. This is a two stage process. The stages in this process are management, business, marketing, graph, line chart.

Additional Unit Sold Comparison In Three Market Scenarios Sold Themes PDF
The slide shows the line graph comparison of additional vehicle sold in three different market scenarios Positive, Average and Negative. The value is provided for the next five years 2020 to 2024 Deliver an awe inspiring pitch with this creative additional unit sold comparison in three market scenarios sold themes pdf bundle. Topics like market scenario positive, market scenario average, market scenario negative can be discussed with this completely editable template. It is available for immediate download depending on the needs and requirements of the user.

Vehicle Sales Plunge In An Automobile Firm Additional Unit Sold Comparison In Three Market Scenarios Introduction PDF
The slide shows the line graph comparison of additional vehicle sold in three different market scenarios Positive, Average and Negative. The value is provided for the next five years 2020 2024 Deliver an awe inspiring pitch with this creative vehicle sales plunge in an automobile firm additional unit sold comparison in three market scenarios introduction pdf bundle. Topics like additional unit sold comparison in three market scenarios can be discussed with this completely editable template. It is available for immediate download depending on the needs and requirements of the user.

Additional Unit Sold Comparison In Three Market Scenarios Introduction PDF
The slide shows the line graph comparison of additional vehicle sold in three different market scenarios Positive, Average and Negative. The value is provided for the next five years 2020 to 2024.Deliver an awe-inspiring pitch with this creative additional unit sold comparison in three market scenarios introduction pdf. bundle. Topics like market scenario, positive, market scenario average, market scenario negative, 2020 to 2024 can be discussed with this completely editable template. It is available for immediate download depending on the needs and requirements of the user.

Forecasted Number Of Passenger Kilometer In Three Different Scenario Slides PDF
The slide shows the line graph comparison of forecasted number of passenger kilometer in three different market scenarios Positive, Average and Negative. The value is provided for the six years 2019 to 2024, along with CAGR in each scenario.Deliver an awe-inspiring pitch with this creative forecasted number of passenger kilometer in three different scenario slides pdf. bundle. Topics like total number of passenger kilometer, 2019 to 2024 can be discussed with this completely editable template. It is available for immediate download depending on the needs and requirements of the user.

Declining Of A Motor Vehicle Company Additional Unit Sold Comparison In Three Market Scenarios Topics PDF
The slide shows the line graph comparison of additional vehicle sold in three different market scenarios Positive, Average and Negative. The value is provided for the next five years 2021 2025. Deliver an awe inspiring pitch with this creative declining of a motor vehicle company additional unit sold comparison in three market scenarios topics pdf bundle. Topics like market scenarios positive, average, negative can be discussed with this completely editable template. It is available for immediate download depending on the needs and requirements of the user.

What Does Account Growth Look Like Pitch Deck Of Vulpine Interactive Fundraising Template Pdf
This slide provides information about some of the tactics that are used by the company in order to amplify the growth efforts along with a line graph indicating a rise in the number of followers of the company over a few years. This is a what does account growth look like pitch deck of vulpine interactive fundraising template pdf template with various stages. Focus and dispense information on six stages using this creative set, that comes with editable features. It contains large content boxes to add your information on topics like tweet evolution, growth tactics. You can also showcase facts, figures, and other relevant content using this PPT layout. Grab it now.

Forecasted Number Of Passenger Kilometer In Three Different Scenario Elements PDF
The slide shows the line graph comparison of forecasted number of passenger kilometer in three different market scenarios Positive, Average and Negative. The value is provided for the six years 2019-2024, along with CAGR in each scenario. Deliver an awe inspiring pitch with this creative forecasted number of passenger kilometer in three different scenario elements pdf bundle. Topics like forecasted number of passenger kilometer in three different scenario can be discussed with this completely editable template. It is available for immediate download depending on the needs and requirements of the user.

Forecasted Number Of Passenger Kilometer In Three Different Scenario Themes PDF
The slide shows the line graph comparison of forecasted number of passenger kilometer in three different market scenarios Positive, Average and Negative. The value is provided for the six years 2019-2024, along with CAGR in each scenario. Deliver and pitch your topic in the best possible manner with this forecasted number of passenger kilometer in three different scenario themes pdf. Use them to share invaluable insights on forecasted number of passenger kilometer in three different scenario and impress your audience. This template can be altered and modified as per your expectations. So, grab it now.

Forecasted Number Of Passenger Kilometer In Three Different Scenario Background PDF
The slide shows the line graph comparison of forecasted number of passenger kilometer in three different market scenarios Positive, Average and Negative. The value is provided for the six years 2019 to 2024, along with CAGR in each scenario.Deliver and pitch your topic in the best possible manner with this forecasted number of passenger kilometer in three different scenario background pdf. Use them to share invaluable insights on forecasted number of passenger kilometer in three different scenario and impress your audience. This template can be altered and modified as per your expectations. So, grab it now.

Russia Ukraine Conflict Effect Increase In Food And Other Commodities Price Pictures PDF
This slide highlights the global inflation rises and weakens in global GDP which includes line graph with two scenarios highlighting if disruption is limited and if the military conflict is lengthy. Deliver and pitch your topic in the best possible manner with this Russia Ukraine Conflict Effect Increase In Food And Other Commodities Price Pictures PDF. Use them to share invaluable insights on Global Inflation Rises, Global GDP Weakens, Feb Baseline, Limited Disruption and impress your audience. This template can be altered and modified as per your expectations. So, grab it now.
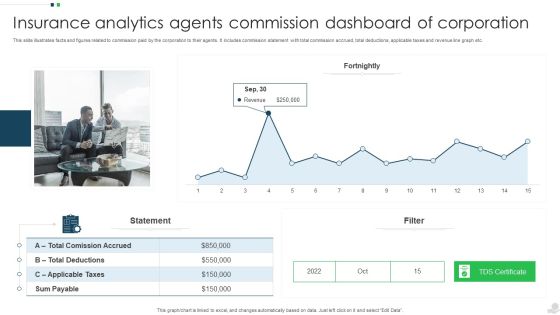
Insurance Analytics Agents Commission Dashboard Of Corporation Introduction PDF
This slide illustrates facts and figures related to commission paid by the corporation to their agents. It includes commission statement with total commission accrued, total deductions, applicable taxes and revenue line graph etc. Pitch your topic with ease and precision using this Insurance Analytics Agents Commission Dashboard Of Corporation Introduction PDF. This layout presents information on Applicable Taxes, Sum Payable, Revenue. It is also available for immediate download and adjustment. So, changes can be made in the color, design, graphics or any other component to create a unique layout.
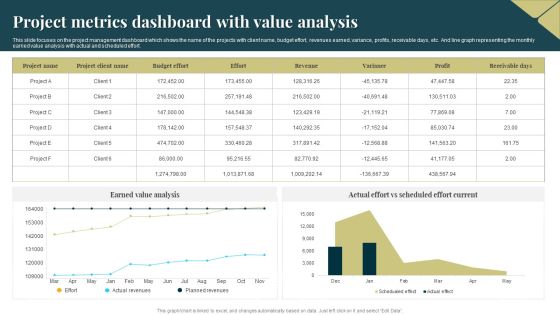
Project Metrics Dashboard With Value Analysis Introduction PDF
This slide focuses on the project management dashboard which shows the name of the projects with client name, budget effort, revenues earned, variance, profits, receivable days, etc. And line graph representing the monthly earned value analysis with actual and scheduled effort. Showcasing this set of slides titled Project Metrics Dashboard With Value Analysis Introduction PDF. The topics addressed in these templates are Budget Effort, Revenues, Earned Value Analysis. All the content presented in this PPT design is completely editable. Download it and make adjustments in color, background, font etc. as per your unique business setting.

Comprehensive Guide To Ecommerce Forecast Demand Planning Using Historical Data Designs PDF
This slides highlights the demand forecasting using line graph of past years for order received data which includes monthly order received data with key highlights tab. Make sure to capture your audiences attention in your business displays with our gratis customizable Comprehensive Guide To Ecommerce Forecast Demand Planning Using Historical Data Designs PDF. These are great for business strategies, office conferences, capital raising or task suggestions. If you desire to acquire more customers for your tech business and ensure they stay satisfied, create your own sales presentation with these plain slides.

E Mail Opening Rate Performance Statistics Analysis Mockup PDF
This slide showcases the line graph that measures the opening rate of an e-mail on various devices. It includes the data figures of devices like desktop, mobile, and tablets to operate mail of the past seven years. Showcasing this set of slides titled E Mail Opening Rate Performance Statistics Analysis Mockup PDF. The topics addressed in these templates are E Mail Opening Rate, Performance Statistics Analysis. All the content presented in this PPT design is completely editable. Download it and make adjustments in color, background, font etc. as per your unique business setting.

Brand Revenue Comparative Analysis With Net Promoter Score Dashboard Mockup PDF
This slide illustrates graphical representation of revenue of three brands. It includes weekly revenue line graphs and net promoter score by age of customers.Pitch your topic with ease and precision using this Brand Revenue Comparative Analysis With Net Promoter Score Dashboard Mockup PDF. This layout presents information on Brand Revenue Comparative Analysis With Net Promoter Score Dashboard. It is also available for immediate download and adjustment. So, changes can be made in the color, design, graphics or any other component to create a unique layout.

Insurance Analytics Corporation Clients Claims Dashboard Summary PDF
This slide illustrates clients claim status statistics of a insurance corporation. It includes total claims, monthly claims, claims amount by type, percentage of claims, denied and received claims line graph. Showcasing this set of slides titled Insurance Analytics Corporation Clients Claims Dashboard Summary PDF. The topics addressed in these templates are Insurance Analytics Corporation, Clients Claims Dashboard. All the content presented in this PPT design is completely editable. Download it and make adjustments in color, background, font etc. as per your unique business setting.
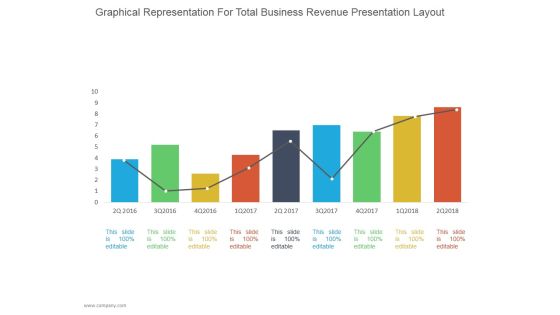
Graphical Representation For Total Business Revenue Ppt PowerPoint Presentation Diagrams
This is a graphical representation for total business revenue ppt powerpoint presentation diagrams. This is a nine stage process. The stages in this process are business, strategy, line chart, bar graph, marketing, management.
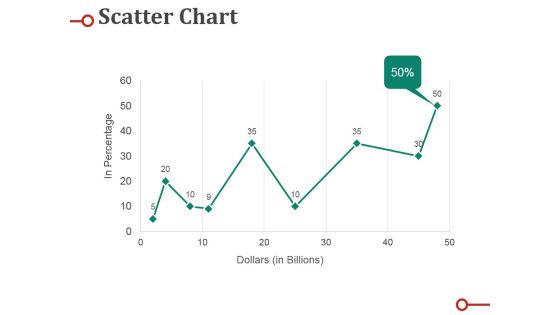
Scatter Chart Ppt PowerPoint Presentation Professional Deck
This is a scatter chart ppt powerpoint presentation professional deck. This is a nine stage process. The stages in this process are percentage, business, marketing, graph, line.

Clustered Column-Line Ppt PowerPoint Presentation Ideas Diagrams
This is a clustered column-line ppt powerpoint presentation ideas diagrams. This is a three stage process. The stages in this process are clustered column line, business, finance, marketing, strategy.

Supply Chain Planning To Enhance Logistics Process Forecast Demand Planning Using Historical Data Ideas PDF
This slides highlights the demand forecasting using line graph of past years for order received data which includes monthly order received data with key highlights tab. Slidegeeks is here to make your presentations a breeze with Supply Chain Planning To Enhance Logistics Process Forecast Demand Planning Using Historical Data Ideas PDF With our easy to use and customizable templates, you can focus on delivering your ideas rather than worrying about formatting. With a variety of designs to choose from, you are sure to find one that suits your needs. And with animations and unique photos, illustrations, and fonts, you can make your presentation pop. So whether you are giving a sales pitch or presenting to the board, make sure to check out Slidegeeks first.

Supply Network Planning And Administration Tactics Forecast Demand Planning Structure PDF
This slides highlights the demand forecasting using line graph of past years for order received data which includes monthly order received data with key highlights tab. Get a simple yet stunning designed Supply Network Planning And Administration Tactics Forecast Demand Planning Structure PDF. It is the best one to establish the tone in your meetings. It is an excellent way to make your presentations highly effective. So, download this PPT today from Slidegeeks and see the positive impacts. Our easy to edit Supply Network Planning And Administration Tactics Forecast Demand Planning Structure PDF can be your go to option for all upcoming conferences and meetings. So, what are you waiting for Grab this template today.

Picture Editing Company Outline Revenue From FY2016 To 2021 Rules PDF
This slide highlights the Canva revenue from 2016 to 2021 through line graph. It showcases that Canva reported revenue of doller 1 BN in 2021 and reached 500k customers in 2022. Slidegeeks is here to make your presentations a breeze with Picture Editing Company Outline Revenue From FY2016 To 2021 Rules PDF With our easy to use and customizable templates, you can focus on delivering your ideas rather than worrying about formatting. With a variety of designs to choose from, you are sure to find one that suits your needs. And with animations and unique photos, illustrations, and fonts, you can make your presentation pop. So whether you are giving a sales pitch or presenting to the board, make sure to check out Slidegeeks first.
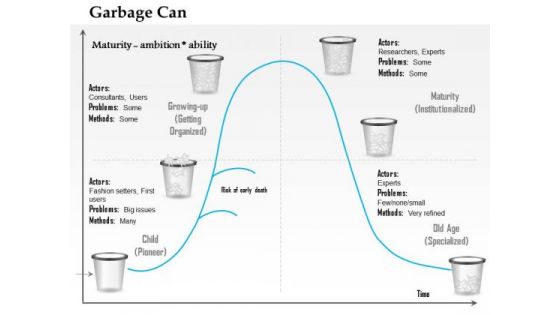
Business Framework Garbage Can Life Cycle Model PowerPoint Presentation
This image slide has been designed to display garbage can model of organizational choice. This image slide has been designed with graph having garbage line to calculate maturity. Use this image slide in business and marketing presentations. This image slide will enhance the quality of your presentations.

Funds Raised So Far Example Of Ppt
This is a funds raised so far example of ppt. This is a nine stage process. The stages in this process are business, marketing, graph, management, line.

Byjus Investor Capital Financing Pitch Deck Byjus Annual Revenue And Growth Rate Background PDF
This slide provides information about the annual revenue and growth rate of Byjus in terms of graph and line chart for 3 years.Deliver an awe inspiring pitch with this creative Byjus Investor Capital Financing Pitch Deck Byjus Annual Revenue And Growth Rate Background PDF bundle. Topics like Annual Revenue, Annual Growth, Previous Period can be discussed with this completely editable template. It is available for immediate download depending on the needs and requirements of the user.
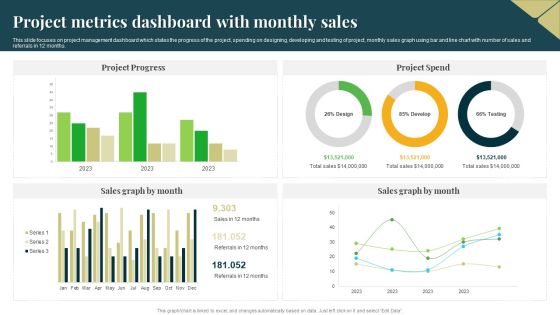
Project Metrics Dashboard With Monthly Sales Professional PDF
This slide focuses on project management dashboard which states the progress of the project, spending on designing, developing and testing of project, monthly sales graph using bar and line chart with number of sales and referrals in 12 months. Pitch your topic with ease and precision using this Project Metrics Dashboard With Monthly Sales Professional PDF. This layout presents information on Project Progress, Project Spend, Sales Graph. It is also available for immediate download and adjustment. So, changes can be made in the color, design, graphics or any other component to create a unique layout.
Down Arrow PowerPoint Icon
3d decay graph bar
Declining Sales PowerPoint Icons with Down Arrow
3d decay graph bar
Down Arrow PowerPoint Icon
3d decay graph bar
Sales & Marketing PowerPoint Icon with Down Arrow
3d decay graph bar

Down Arrow Icon R
3d decay graph bar
Bar Graph01 Business PowerPoint Templates And PowerPoint Backgrounds 1211
Microsoft PowerPoint Template and Background with colorful bar graph
 Home
Home