Line Graph

Bar Graph For Year Based Analysis Powerpoint Slides
This PowerPoint template has been designed with year based bar graph. This diagram may be used to display yearly statistical analysis. Use this PPT slide design to make impressive presentations.

Bar Graph For Yearly Statistical Analysis Powerpoint Slides
This PowerPoint template has been designed with bar graph. This PowerPoint diagram is useful to exhibit yearly statistical analysis. This diagram slide can be used to make impressive presentations.

Bar Graph For Data Distribution And Analysis Powerpoint Slides
This PowerPoint template has been designed with bar graph. This PowerPoint diagram is useful for data distribution and analysis This diagram slide can be used to make impressive presentations.

Board With Bar Graph For Financial Analysis Powerpoint Slides
You can download this PowerPoint template to display statistical data and analysis. This PPT slide contains display board with bar graph. Draw an innovative business idea using this professional diagram.

Stock Photo Globe With Bar Graph For Business PowerPoint Slide
This image slide displays globe with bar graph. This image has been designed with graphic of bar graph, pie char, globe and growth arrow. Use this image slide, in your presentations to express views on finance, global growth and success. This image slide may also be used to exhibit any information which requires visual presentation in your presentations. This image slide will enhance the quality of your presentations.

3d Man With Blue Bar Graph And Red Growth Arrow
This Power Point diagram has been designed with graphic of 3d man and business graphs. This conceptual image can be used to displays business progress and growth. Use this editable slide for business and sales growth related presentations.

3d Man On The Top Of Puzzle Bar Graph
This PPT has been designed with graphic of 3d man and puzzle are graph. This PPT displays the concept of result analysis and financial growth. Use this PPT for your business and finance related presentations.
Progress Graph Finance PowerPoint Templates And PowerPoint Themes 0412
Microsoft Powerpoint Templates and Background with bar chart growth

Profit Graph Business PowerPoint Templates And PowerPoint Themes 0512
Microsoft Powerpoint Templates and Background with bar chart growth
Stock Photo Chairs Around Table With Bar Graph PowerPoint Slide
The above image shows unique design of chairs around table with bar graph. This professional image of designed to portray concept of business meeting on facts and figures. Employ the right colors for your brilliant ideas. Help your viewers automatically empathize with your thoughts.

Stock Photo Arrow Growth Bar Graph On Phone Pwerpoint Slide
This graphic image has been designed with graphic of smart phone with growth bar graph. This image contains the concept of business growth analysis. Use this image for business and marketing related analysis presentations. Display finance growth analysis in an graphical way with this exclusive image.
Accounts And Graph Business PowerPoint Templates And PowerPoint Backgrounds 0511
Microsoft PowerPoint Template and Background with an accounts bar charts in different colors

Growth Graph Finance PowerPoint Templates And PowerPoint Backgrounds 0511
Microsoft PowerPoint Template and Background with businessman adding a red bar chart to increase financial growth
Up Arrow Graph Business PowerPoint Templates And PowerPoint Backgrounds 0511
Microsoft PowerPoint Template and Background with 3d rendered image of a bar-chart for success concept

Business Graph Success PowerPoint Templates And PowerPoint Backgrounds 0811
Microsoft PowerPoint Template and Background with someone climbing up a bar chart

Accounts And Graph Business PowerPoint Themes And PowerPoint Slides 0511
Microsoft PowerPoint Theme and Slide with an accounts bar charts in different colors
Business Graph Success PowerPoint Themes And PowerPoint Slides 0811
Microsoft PowerPoint Theme and Slide with of someone climbing up a bar chart
Growth Graph Finance PowerPoint Themes And PowerPoint Slides 0511
Microsoft PowerPoint Theme and Slide with businessman adding a red bar chart to increase financial growth
Up Arrow Graph Business PowerPoint Themes And PowerPoint Slides 0511
Microsoft PowerPoint Theme and Slide with 3d rendered image of a bar-chart for success concept

Column Chart Graph Ppt PowerPoint Presentation Slides File Formats
This is a combo chart bar ppt powerpoint presentation slides portfolio. This is a three stage process. The stages in this process are finance, marketing, analysis, investment, million.
Graph Finance PowerPoint Templates And PowerPoint Backgrounds 0511
Microsoft PowerPoint Template and Background with financial success concept golden compass with growing bar chart from golden coins

Graph Finance PowerPoint Themes And PowerPoint Slides 0511
Microsoft PowerPoint Slide and Theme with financial success concept golden compass with growing bar chart from golden coins
Success Graph Leadership PowerPoint Templates And PowerPoint Themes 1012
The above template displays a diagram of a bar graph. This image represents the concept of leadership. This image has been conceived to enable you to emphatically communicate your ideas in your Business PPT presentations. Create captivating presentations to deliver comparative and weighted arguments.
Stock Photo Bar Graph On Circular Web PowerPoint Slide
This image slide displays bar garph on circular web. This image slide helps you to make business and sales related presenations. Deliver amazing presentations to mesmerize your audience.

Bar Graph Ladder Business PowerPoint Background And Template 1210
Microsoft PowerPoint Template and Background with A 3d image of shiny ladder. Isolated on white.

Melting Profits Bar Graph Business PowerPoint Backgrounds And Templates 1210
Microsoft PowerPoint Template and Background with 3d illustration of a glowing green and silver up arrow symbol sitting in a puddle of silver liquid on a dark gray reflective surface
Bar Graph Business PowerPoint Backgrounds And Templates 0111
Microsoft PowerPoint Template and Background with a 3d image of shiny ladder

Golden Bar Graph Business PowerPoint Templates And PowerPoint Backgrounds 0411
Microsoft PowerPoint Template and Background with a concept and presentation
Bar Graph Meeting Business PowerPoint Templates And PowerPoint Backgrounds 0511
Microsoft PowerPoint Template and Background with business meeting

Golden Bar Graph Business PowerPoint Themes And PowerPoint Slides 0411
Microsoft PowerPoint Theme and Slide with a concept and presentation

Bar Graph Meeting Business PowerPoint Themes And PowerPoint Slides 0511
Microsoft PowerPoint Theme and Slide with business meeting

Bar Graph Global Business PowerPoint Templates And PowerPoint Themes 0212
Microsoft Powerpoint Templates and Background with business background

Lego Bar Graph Business PowerPoint Templates And PowerPoint Themes 0312
Microsoft Powerpoint Templates and Background with diagram

Lego Bar Graph Success PowerPoint Templates And PowerPoint Themes 0312
Microsoft Powerpoint Templates and Background with diagram
Targeted Bar Graph Success PowerPoint Templates And PowerPoint Themes 0412
Microsoft Powerpoint Templates and Background with achieving business targets

Success Bar Graph Future PowerPoint Templates And PowerPoint Themes 0512
Microsoft Powerpoint Templates and Background with success

Success Bar Graph Global PowerPoint Templates And PowerPoint Themes 0512
Microsoft Powerpoint Templates and Background with success
Target Bar Graph Business PowerPoint Templates And PowerPoint Themes 0512
Microsoft Powerpoint Templates and Background with achieving business targets

Lego Bar Graph Business PowerPoint Templates And PowerPoint Themes 0512
Microsoft Powerpoint Templates and Background with Lego Arrow
Modern Marketing Concepts 3d Man Bar Graph Business Statement
Rake In The Dough With

Multiple 3d Peoples For Business Growth Bar Graph
This image slide displays graphics of team meeting. This conceptual image depicts discussion on business facts and figures. Use this diagram slide to build presentation on business planning and teamwork related topics.
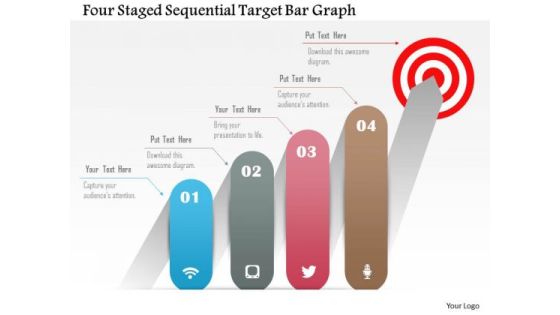
Business Diagram Four Staged Sequential Target Bar Graph Presentation Template
This business diagram has been designed with graphic of four steps towards target achievement. Use this diagram, in your presentations to express views on strategies, policies, success, achievements and opportunities. Create professional presentations using this diagram slide.
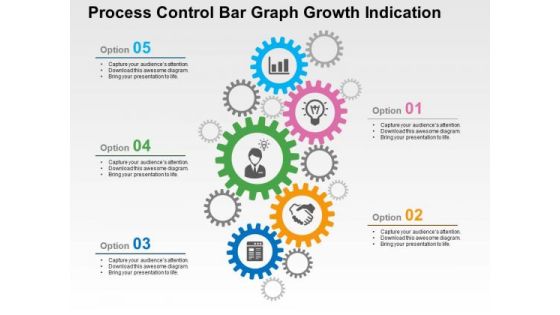
Process Control Bar Graph Growth Indication PowerPoint Template
Download our business slide with gear graphics to convincingly convey your important ideas in presentations. It also contains graphics of business icons. Create captivating presentations using this template
Infographics With News Mail Microscope Bar Graph Icons Powerpoint Templates
This PowerPoint template has been designed with infographic square. Download this PPT slide to display information in visual manner. Use this diagram to build an exclusive presentation.

Golden Graph Success PowerPoint Templates And PowerPoint Backgrounds 0511
Microsoft PowerPoint Template and Background with rendering of golden bar

Barcode Sales Graph Business PowerPoint Backgrounds And Templates 1210
Microsoft PowerPoint Template and Background with barcode with and increasing bar size depicting increasing sales

Transparent Colorful Graph Business PowerPoint Templates And PowerPoint Backgrounds 0811
Microsoft PowerPoint Template and Background with transparent colorful bars and pie

Transparent Colorful Graph Business PowerPoint Themes And PowerPoint Slides 0811
Microsoft PowerPoint Theme and Slide with transparent colorful bars and pie
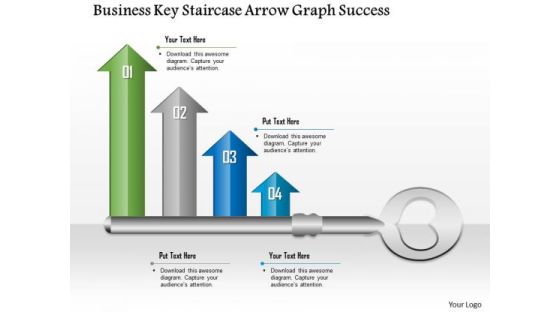
Business Diagram Business Key Staircase Arrow Graph Success Presentation Template
This slide contains numbers key stair case diagram. This PowerPoint template has been designed to depict order of steps. Display linear process flow for any business process with this exclusive diagram and attract your viewers.
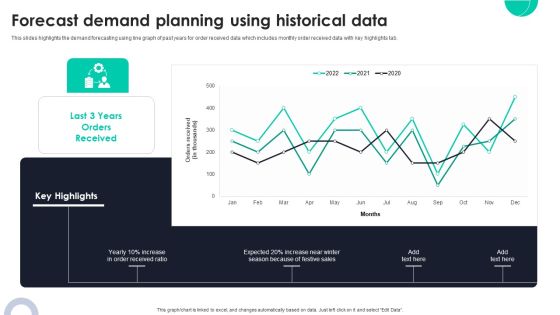
Forecast Demand Planning Using Historical Data Ppt PowerPoint Presentation Diagram Graph Charts PDF
This slides highlights the demand forecasting using line graph of past years for order received data which includes monthly order received data with key highlights tab. Crafting an eye catching presentation has never been more straightforward. Let your presentation shine with this tasteful yet straightforward Forecast Demand Planning Using Historical Data Ppt PowerPoint Presentation Diagram Graph Charts PDF template. It offers a minimalistic and classy look that is great for making a statement. The colors have been employed intelligently to add a bit of playfulness while still remaining professional. Construct the ideal Forecast Demand Planning Using Historical Data Ppt PowerPoint Presentation Diagram Graph Charts PDF that effortlessly grabs the attention of your audience. Begin now and be certain to wow your customers.

Business Growth Bar Graph Pie Chart PowerPoint Templates Ppt Backgrounds For Slides 0313
We present our Business Growth Bar Graph Pie Chart PowerPoint Templates PPT Backgrounds For Slides 0313.Present our Pie charts PowerPoint Templates because You are an avid believer in ethical practices. Highlight the benefits that accrue with our PowerPoint Templates and Slides. Present our Business PowerPoint Templates because Our PowerPoint Templates and Slides will provide you the cutting edge. Slice through the doubts in the minds of your listeners. Download our Success PowerPoint Templates because Watching this your Audience will Grab their eyeballs, they wont even blink. Download and present our Marketing PowerPoint Templates because It can Conjure up grand ideas with our magical PowerPoint Templates and Slides. Leave everyone awestruck by the end of your presentation. Present our Services PowerPoint Templates because Our PowerPoint Templates and Slides will Embellish your thoughts. They will help you illustrate the brilliance of your ideas.Use these PowerPoint slides for presentations relating to Illustration of set of bar graph line graph and pie chart, pie charts, business, success, marketing, services. The prominent colors used in the PowerPoint template are Pink, Red, Blue.
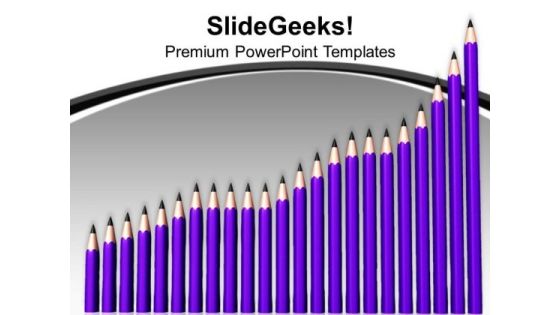
Group Of Pencils Bar Graph Growth PowerPoint Templates Ppt Backgrounds For Slides 0113
We present our Group Of Pencils Bar Graph Growth PowerPoint Templates PPT Backgrounds For Slides 0113.Download and present our Success PowerPoint Templates because Our PowerPoint Templates and Slides are created by a hardworking bunch of busybees. Always flitting around with solutions gauranteed to please. Download and present our Business PowerPoint Templates because Our PowerPoint Templates and Slides are designed to help you succeed. They have all the ingredients you need. Present our Finance PowerPoint Templates because Our PowerPoint Templates and Slides will bullet point your ideas. See them fall into place one by one. Download our Shapes PowerPoint Templates because Our PowerPoint Templates and Slides come in all colours, shades and hues. They help highlight every nuance of your views. Use our Signs PowerPoint Templates because It will Raise the bar of your Thoughts. They are programmed to take you to the next level.Use these PowerPoint slides for presentations relating to pencil line graph, finance, signs, success, shapes, business. The prominent colors used in the PowerPoint template are Tan, Purple, Black. PowerPoint presentation experts tell us our Group Of Pencils Bar Graph Growth PowerPoint Templates PPT Backgrounds For Slides 0113 are aesthetically designed to attract attention. We guarantee that they will grab all the eyeballs you need. Use our finance PowerPoint templates and PPT Slides are the best it can get when it comes to presenting. People tell us our Group Of Pencils Bar Graph Growth PowerPoint Templates PPT Backgrounds For Slides 0113 are readymade to fit into any presentation structure. The feedback we get is that our business PowerPoint templates and PPT Slides effectively help you save your valuable time. Professionals tell us our Group Of Pencils Bar Graph Growth PowerPoint Templates PPT Backgrounds For Slides 0113 have awesome images to get your point across. Presenters tell us our line PowerPoint templates and PPT Slides are second to none.
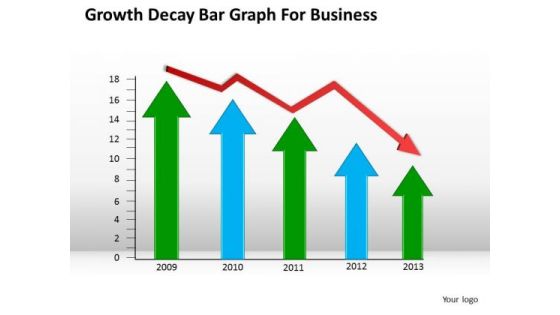
Consulting PowerPoint Template Growth Decay Bar Graph For Business Ppt Slides
Draw ahead of others with our consulting PowerPoint template growth decay bar graph for business ppt Slides. Cross the line and win the race. Draw out the best in you with our Arrows PowerPoint Templates. Let your inner brilliance come to the surface. Draw out the talents of your team. Use our Business PowerPoint Templates to give them an incentive.

Select Of Organizational Model That Supports Your Strategy Line Vs Staff Authority Ppt Visual Aids Show PDF
Presenting this set of slides with name select of organizational model that supports your strategy line vs staff authority ppt visual aids show pdf. This is a two stage process. The stages in this process are executive director, other, human resources, operations, purchasing, line authority, staff authority. This is a completely editable PowerPoint presentation and is available for immediate download. Download now and impress your audience.

Apples Strategy To Achieve Top Brand Value Position BCG Matrix To Analyse Apples Product Line Structure PDF
This slide provides information regarding BCG matrix to assess existing Apples product line. The planning tool helps to assess firms products and services to decide what offerings to keep, sell or invest more in. Get a simple yet stunning designed Apples Strategy To Achieve Top Brand Value Position BCG Matrix To Analyse Apples Product Line Structure PDF. It is the best one to establish the tone in your meetings. It is an excellent way to make your presentations highly effective. So, download this PPT today from Slidegeeks and see the positive impacts. Our easy to edit Apples Strategy To Achieve Top Brand Value Position BCG Matrix To Analyse Apples Product Line Structure PDF can be your go to option for all upcoming conferences and meetings. So, what are you waiting for Grab this template today.
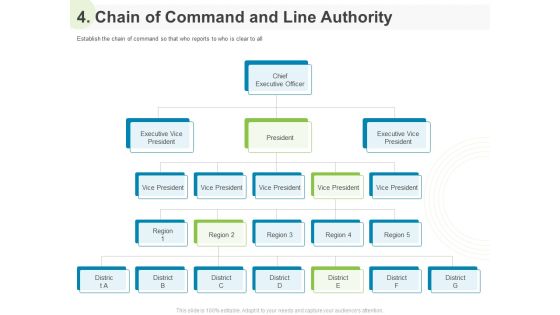
Implementing Human Resources HR Best Practices Strategy 4 Chain Of Command And Line Authority Ppt Slides Portrait PDF
Presenting this set of slides with name implementing human resources hr best practices strategy 4 chain of command and line authority ppt slides portrait pdf. This is a five stage process. The stages in this process are executive officer, executive vice president. This is a completely editable PowerPoint presentation and is available for immediate download. Download now and impress your audience.

3d Man On Bar Graph PowerPoint Templates Ppt Backgrounds For Slides 0813
Draw ahead of others with our 3d Man On Bar Graph PowerPoint Templates PPT Backgrounds For Slides. Cross the line and win the race. Draw out the best in you with our Process and Flows PowerPoint Templates. Let your inner brilliance come to the surface. Draw out the talents of your team. Use our Arrows PowerPoint Templates to give them an incentive.

Business Outcomes Analysis Business Man With Pie Bar And Line Chart Ppt Powerpoint Presentation Infographics Visual Aids
This is a business outcomes analysis business man with pie bar and line chart ppt powerpoint presentation infographics visual aids. This is a three stage process. The stages in this process are business outcomes, business results, business output.

Spaghetti Chart Depicting Assembly Line And Machine For Two Products Ppt PowerPoint Presentation Gallery Example Introduction PDF
Persuade your audience using this spaghetti chart depicting assembly line and machine for two products ppt powerpoint presentation gallery example introduction pdf. This PPT design covers two stages, thus making it a great tool to use. It also caters to a variety of topics including spaghetti chart depicting assembly line and machine for two products. Download this PPT design now to present a convincing pitch that not only emphasizes the topic but also showcases your presentation skills.

Business Outcomes Analysis Business Man With Pie Bar And Line Chart Ppt PowerPoint Presentation Professional Graphics Download
Presenting this set of slides with name business outcomes analysis business man with pie bar and line chart ppt powerpoint presentation professional graphics download. This is a three stage process. The stages in this process are business outcomes, business results, business output. This is a completely editable PowerPoint presentation and is available for immediate download. Download now and impress your audience.
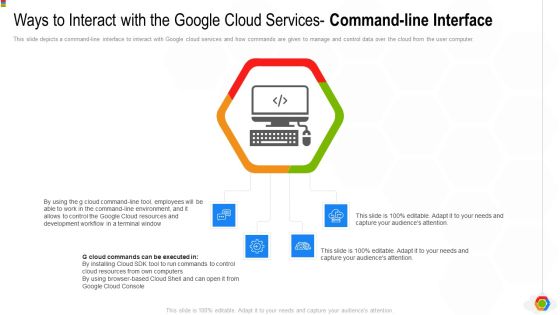
Google Cloud Console IT Ways To Interact With The Google Cloud Services Command Line Interface Ppt Professional Good PDF
This slide depicts a command-line interface to interact with Google cloud services and how commands are given to manage and control data over the cloud from the user computer. Presenting google cloud console it ways to interact with the google cloud services command line interface ppt professional good pdf to provide visual cues and insights. Share and navigate important information on four stages that need your due attention. This template can be used to pitch topics like development, workflow, cloud resources, environment. In addtion, this PPT design contains high resolution images, graphics, etc, that are easily editable and available for immediate download.
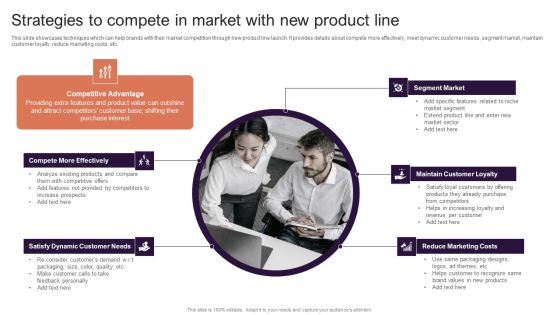
Implementing Brand Extension Initiatives For Apple Company Strategies To Compete In Market With New Product Line Inspiration PDF
This slide showcases techniques which can help brands with their market competition through new product line launch. It provides details about compete more effectively, meet dynamic customer needs, segment market, maintain customer loyalty, reduce marketing costs, etc. The Implementing Brand Extension Initiatives For Apple Company Strategies To Compete In Market With New Product Line Inspiration PDF is a compilation of the most recent design trends as a series of slides. It is suitable for any subject or industry presentation, containing attractive visuals and photo spots for businesses to clearly express their messages. This template contains a variety of slides for the user to input data, such as structures to contrast two elements, bullet points, and slides for written information. Slidegeeks is prepared to create an impression.

Business Plan Methods Tools And Templates Set 2 Triple Bottom Line Model For Sustainable Innovation In Enterprise Mockup PDF
This slide covers the TBL framework wherein company focus on people, planet, and profit in an organization. Presenting business plan methods tools and templates set 2 triple bottom line model for sustainable innovation in enterprise mockup pdf to provide visual cues and insights. Share and navigate important information on three stages that need your due attention. This template can be used to pitch topics like people, planet, profit. In addtion, this PPT design contains high resolution images, graphics, etc, that are easily editable and available for immediate download.

Young Man Drawing Graph Business PowerPoint Templates And PowerPoint Backgrounds 0411
Microsoft PowerPoint Template and Background with a young businessman drawing increasing graphics with red line

Young Man Drawing Graph Business PowerPoint Themes And PowerPoint Slides 0411
Microsoft PowerPoint Theme and Slide with a young businessman drawing increasing graphics with red line
Bar Graph For Business And Strategies PowerPoint Templates Ppt Backgrounds For Slides 0713
Get the doers into action. Activate them with our Bar Graph For Business Development And Strategies PowerPoint Templates PPT Backgrounds For Slides. Put your money on our finance PowerPoint Templates. Your ideas will rake in the dollars. Put in a dollop of our success PowerPoint Templates. Give your thoughts a distinctive flavour.

Bar Graph Eor Business Growth PowerPoint Templates Ppt Backgrounds For Slides 0613
Document the process on our Bar Graph Eor Business Growth PowerPoint Templates PPT Backgrounds For Slides. Make a record of every detail. Satiate desires with our Puzzles or Jigsaws PowerPoint Templates. Give them all they want and more. Be the doer with our Process and Flows PowerPoint Templates. Put your thoughts into practice.
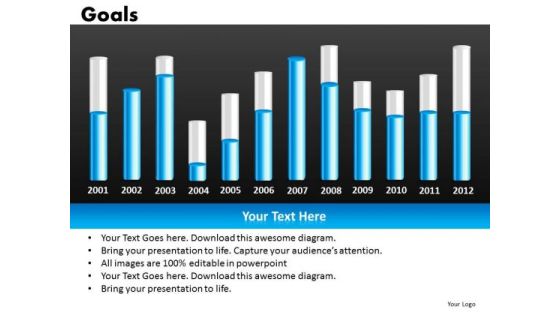
Goals Graphs PowerPoint Slides
Goals Graphs PowerPoint Slides-These high quality, editable pre-designed powerpoint slides have been carefully created by our professional team to help you impress your audience. Each graphic in every slide is vector based and is 100% editable in powerpoint. Each and every property of any slide - color, size, shading etc can be modified to build an effective powerpoint presentation. Use these slides to convey complex business concepts in a simplified manner. Any text can be entered at any point in the powerpoint slide. Simply DOWNLOAD, TYPE and PRESENT!
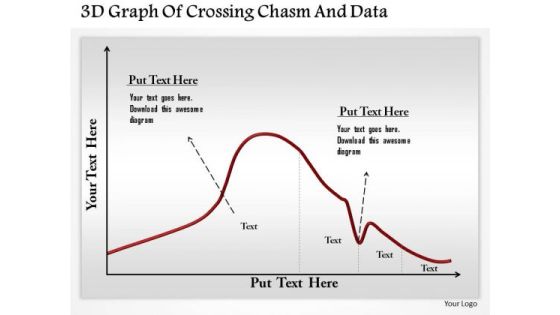
Business Diagram 3d Graph Of Crossing Chasm And Data Presentation Template
This business diagram has been designed with graphic of 3d graph. This slide contains the concept of chasm and data calculation. Use this slide to display chasm crossing condition. This business diagram adds value to your ideas.

Ppt Arrow Circle Insert Default Graph Chart PowerPoint 2003 5 Stages Templates
PPT arrow circle insert default graph chart powerpoint 2003 5 stages Templates-This PowerPoint Diagram shows you Inter-connected Layers using Arrows in Horizontal Line which signifies step by step Execution, inter-related approaches etc. You can change color, size and orientation of any icon to your liking.-PPT arrow circle insert default graph chart powerpoint 2003 5 stages Templates-Arrow, Art, Background, Beautiful, Bright, Business, Circle, Collection, Color, Colorful, Concentric, Concept, Connection, Contrast, Creative, Decoration, Design, Effect, Element, Graphic, Green, Group, Icon, Illustration, Image, Isolated, Light, Pattern, Pie, Red, Render, Round, Sample, Shape, Solution, Style, Success, Symbol, Technology, Wheel, White, Yellow
Bar Graph And Pie Chart Finance PowerPoint Templates And PowerPoint Themes 0612
Bar Graph And Pie Chart Finance PowerPoint Templates And PowerPoint Themes Business-Microsoft Powerpoint Templates and Background with bar and pie graph
Bar Graph Progress Chart Business PowerPoint Templates And PowerPoint Themes 0712
Bar Graph Progress Chart Business PowerPoint Templates And PowerPoint Themes 0712-Microsoft Powerpoint Templates and Background with bar graph with arrow

Person Standing On Graph Success PowerPoint Templates And PowerPoint Backgrounds 0711
Microsoft PowerPoint Template and Background with number one bar graph

Person Standing On Graph Success PowerPoint Themes And PowerPoint Slides 0711
Microsoft PowerPoint Theme and Slide with number one bar graph

Bar Graph With Success Business PowerPoint Templates And PowerPoint Themes 0312
Microsoft Powerpoint Templates and Background with business graph success

Bar Graph With Arrow Success PowerPoint Templates And PowerPoint Themes 0412
Microsoft Powerpoint Templates and Background with graph of business
Colored Bar Graph With Success PowerPoint Templates And PowerPoint Themes 0412
Microsoft Powerpoint Templates and Background with business graph success

Bar Graph Growth With Earth PowerPoint Templates And PowerPoint Themes 0712
Bar Graph Growth With Earth PowerPoint Templates And PowerPoint Themes 0712-Microsoft Powerpoint Templates and Background with bar graph with global

Tablet With Bar Graph Success PowerPoint Templates And PowerPoint Themes 0712
Tablet With Bar Graph Success PowerPoint Templates And PowerPoint Themes 0712-Microsoft Powerpoint Templates and Background with tablets with bar graph

Bar Graph Business Growth Success PowerPoint Templates And PowerPoint Themes 0912
Bar Graph Business Growth Success PowerPoint Templates And PowerPoint Themes 0912-Microsoft Powerpoint Templates and Background with bar graph
Increase Bar Graph Dollar Business PowerPoint Templates And PowerPoint Themes 0612
Increase Bar Graph Dollar Business PowerPoint Templates And PowerPoint Themes Business PPT Templates-Graph dollar, arrow, background, business, success, marketing

Business Graph Growth Dollar Finance PowerPoint Templates And PowerPoint Themes 0712
Business Graph Growth Dollar Finance PowerPoint Templates And PowerPoint Themes 0712-Microsoft Powerpoint Templates and Background with bar graph
Growing Arrow On Bar Graph Vector Icon Ppt PowerPoint Presentation Designs Cpb
This is a growing arrow on bar graph vector icon ppt powerpoint presentation designs cpb . This is a three stage process. The stages in this process are bar chart icon, bar graph icon, data chart icon.

Bar Graph Companys Business Model Canvas Ppt PowerPoint Presentation Visual Aids Model
This is a bar graph companys business model canvas ppt powerpoint presentation visual aids model. This is a three stage process. The stages in this process are bar graph, finance, marketing, strategy, analysis, business.

Auto Sales Scorecard Bar Graph For Regional Performance Comparison Infographics PDF
This graph or chart is linked to excel, and changes automatically based on data. Just left click on it and select Edit Data. Deliver an awe inspiring pitch with this creative Auto Sales Scorecard Bar Graph For Regional Performance Comparison Infographics PDF bundle. Topics like Auto Sales Scorecard, Bar Graph Regional, Performance Comparison Product can be discussed with this completely editable template. It is available for immediate download depending on the needs and requirements of the user.
Financial Graph Economic Growth Vector Icon Ppt PowerPoint Presentation Infographics Graphic Images Cpb
This is a financial graph economic growth vector icon ppt powerpoint presentation infographics graphic images cpb. This is a three stage process. The stages in this process are bar chart icon, bar graph icon, data chart icon.
Finance Bar Graph With Arrow Business PowerPoint Templates And PowerPoint Themes 0912
Finance Bar Graph With Arrow Business PowerPoint Templates And PowerPoint Themes 0912-Microsoft Powerpoint Templates and Background with financial bar graph chart-Financial bar graph chart, business, arrows, marketing, finance, success
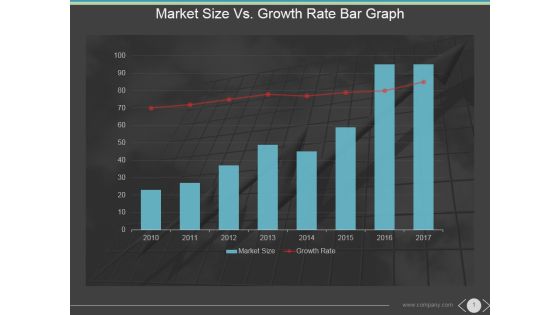
Market Size Vs Growth Rate Bar Graph Ppt PowerPoint Presentation Themes
This is a market size vs growth rate bar graph ppt powerpoint presentation themes. This is a eight stage process. The stages in this process are market size, growth rate, years, future, graph.
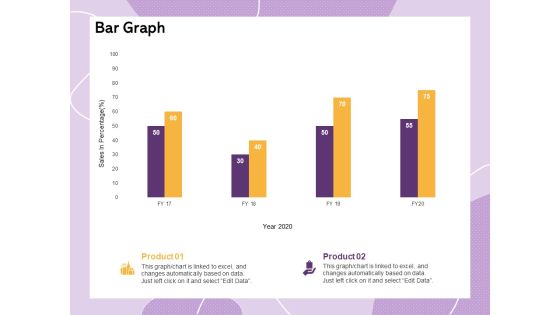
Investor Presentation For Society Funding Bar Graph Ppt PowerPoint Presentation Portfolio Show PDF
Presenting this set of slides with name investor presentation for society funding bar graph ppt powerpoint presentation portfolio show pdf. The topics discussed in these slide is bar graph. This is a completely editable PowerPoint presentation and is available for immediate download. Download now and impress your audience.

Bar Graph Showing Sales Performance Dashboard Ppt PowerPoint Presentation File Design Ideas PDF
Presenting this set of slides with name bar graph showing sales performance dashboard ppt powerpoint presentation file design ideas pdf. The topics discussed in these slide is bar graph showing sales performance dashboard. This is a completely editable PowerPoint presentation and is available for immediate download. Download now and impress your audience.

Bar Graph Showing Income Comparison Of Cars Ppt PowerPoint Presentation Gallery Brochure PDF
Presenting this set of slides with name bar graph showing income comparison of cars ppt powerpoint presentation gallery brochure pdf. The topics discussed in these slide is bar graph showing income comparison of cars. This is a completely editable PowerPoint presentation and is available for immediate download. Download now and impress your audience.

PP And E Valuation Methodology Bar Graph Ppt Gallery Background PDF
Presenting this set of slides with name pp and e valuation methodology bar graph ppt gallery background pdf. The topics discussed in these slide is bar graph. This is a completely editable PowerPoint presentation and is available for immediate download. Download now and impress your audience.

Bar Graph Showing Data For Business Progress Ppt PowerPoint Presentation Gallery Demonstration PDF
Presenting this set of slides with name bar graph showing data for business progress ppt powerpoint presentation gallery demonstration pdf. The topics discussed in these slide is bar graph showing data for business progress. This is a completely editable PowerPoint presentation and is available for immediate download. Download now and impress your audience.

Bar Graph For Financial Growth Analysis Ppt PowerPoint Presentation Gallery Background Images PDF
Presenting this set of slides with name bar graph for financial growth analysis ppt powerpoint presentation gallery background images pdf. The topics discussed in these slide is bar graph for financial growth analysis. This is a completely editable PowerPoint presentation and is available for immediate download. Download now and impress your audience.

Bar Graph Revenue Performance Analysis Ppt PowerPoint Presentation Pictures Samples PDF
Presenting this set of slides with name bar graph revenue performance analysis ppt powerpoint presentation pictures samples pdf. The topics discussed in these slide is bar graph revenue performance analysis. This is a completely editable PowerPoint presentation and is available for immediate download. Download now and impress your audience.

Bar Graph Depicting Business Sales Revenue With Cagr Value Ppt PowerPoint Presentation File Outline PDF
Showcasing this set of slides titled bar graph depicting business sales revenue with cagr value ppt powerpoint presentation file outline pdf. The topics addressed in these templates are bar graph depicting business sales revenue with cagr value. All the content presented in this PPT design is completely editable. Download it and make adjustments in color, background, font etc. as per your unique business setting.

Bar Graph Showing Goal Attainment Over Time Ppt PowerPoint Presentation Gallery Demonstration PDF
Showcasing this set of slides titled bar graph showing goal attainment over time ppt powerpoint presentation gallery demonstration pdf. The topics addressed in these templates are bar graph showing goal attainment over time. All the content presented in this PPT design is completely editable. Download it and make adjustments in color, background, font etc. as per your unique business setting.

Bar Graph Showing Income Of Business Segments Ppt PowerPoint Presentation Icon Example PDF
Pitch your topic with ease and precision using this bar graph showing income of business segments ppt powerpoint presentation icon example pdf. This layout presents information on bar graph showing income of business segments. It is also available for immediate download and adjustment. So, changes can be made in the color, design, graphics or any other component to create a unique layout.
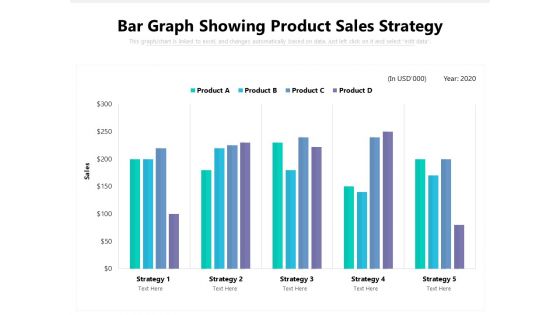
Bar Graph Showing Product Sales Strategy Ppt PowerPoint Presentation File Samples PDF
Showcasing this set of slides titled bar graph showing product sales strategy ppt powerpoint presentation file samples pdf. The topics addressed in these templates are bar graph showing product sales strategy. All the content presented in this PPT design is completely editable. Download it and make adjustments in color, background, font etc. as per your unique business setting.

Business Market Share By Country Through Bar Graph Ppt PowerPoint Presentation Gallery Show PDF
Showcasing this set of slides titled business market share by country through bar graph ppt powerpoint presentation gallery show pdf. The topics addressed in these templates are business market share by country through bar graph. All the content presented in this PPT design is completely editable. Download it and make adjustments in color, background, font etc. as per your unique business setting.

Company Quarterly Sales Performance Bar Graph Ppt PowerPoint Presentation File Templates PDF
Pitch your topic with ease and precision using this company quarterly sales performance bar graph ppt powerpoint presentation file templates pdf. This layout presents information on company quarterly sales performance bar graph. It is also available for immediate download and adjustment. So, changes can be made in the color, design, graphics or any other component to create a unique layout.
Monthly Company Product Sales Bar Graph Ppt PowerPoint Presentation Icon Model PDF
Showcasing this set of slides titled monthly company product sales bar graph ppt powerpoint presentation icon model pdf. The topics addressed in these templates are monthly company product sales bar graph. All the content presented in this PPT design is completely editable. Download it and make adjustments in color, background, font etc. as per your unique business setting.
Small And Medium Business Weekly Sales Bar Graph Ppt PowerPoint Presentation Icon Diagrams PDF
Showcasing this set of slides titled small and medium business weekly sales bar graph ppt powerpoint presentation icon diagrams pdf. The topics addressed in these templates are small and medium business weekly sales bar graph. All the content presented in this PPT design is completely editable. Download it and make adjustments in color, background, font etc. as per your unique business setting.

Bar Graph Showing Net Changes In Cash Flow Ppt PowerPoint Presentation Gallery Clipart Images PDF
Showcasing this set of slides titled bar graph showing net changes in cash flow ppt powerpoint presentation gallery clipart images pdf. The topics addressed in these templates are bar graph showing net changes in cash flow. All the content presented in this PPT design is completely editable. Download it and make adjustments in color, background, font etc. as per your unique business setting.

Action Priority Bar Graph With Business Tasks Ppt Layouts Graphics Download PDF
Showcasing this set of slides titled action priority bar graph with business tasks ppt layouts graphics download pdf. The topics addressed in these templates are action priority bar graph with business tasks. All the content presented in this PPT design is completely editable. Download it and make adjustments in color, background, font etc. as per your unique business setting.
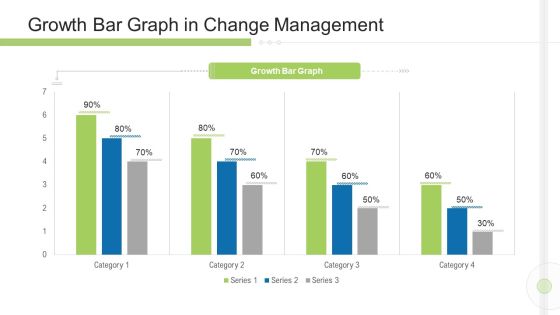
Execution Management In Business Growth Bar Graph In Change Management Graphics PDF
Deliver and pitch your topic in the best possible manner with this execution management in business growth bar graph in change management graphics pdf. Use them to share invaluable insights on growth bar graph in change management and impress your audience. This template can be altered and modified as per your expectations. So, grab it now.

Sales Rep Scorecard Sales Representatives Scorecard Bar Graph For Sku Performance Comparison Clipart PDF
Deliver an awe inspiring pitch with this creative sales rep scorecard sales representatives scorecard bar graph for sku performance comparison clipart pdf bundle. Topics like sales representatives scorecard bar graph for sku performance comparison can be discussed with this completely editable template. It is available for immediate download depending on the needs and requirements of the user.

Stages Of Business Lifecyle Curve Graph Ppt PowerPoint Presentation Infographics Topics PDF
Presenting this set of slides with name stages of business lifecyle curve graph ppt powerpoint presentation infographics topics pdf. This is a one stage process. The stages in this process are peak, recession, trend line, expansion, trough. This is a completely editable PowerPoint presentation and is available for immediate download. Download now and impress your audience.

Competitor Analysis Competitor Revenue And Profit Graph Ppt PowerPoint Presentation Gallery Vector
This is a competitor analysis competitor revenue and profit graph ppt powerpoint presentation gallery vector. This is a five stage process. The stages in this process are bar graph, marketing, management, business, presentation.
Business Bar Graph Upward Arrow Success PowerPoint Templates And PowerPoint Themes 0912
Business Bar Graph Upward Arrow Success PowerPoint Templates And PowerPoint Themes 0912-Microsoft Powerpoint Templates and Background with bar graph with upwards arrows-Bar graph with upwards arrows, success, money, arrows, finance, business
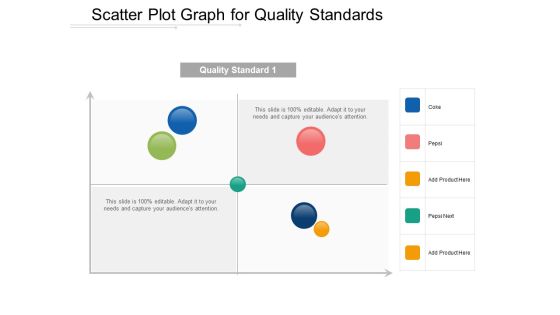
Scatter Plot Graph For Quality Standards Ppt Powerpoint Presentation Show Infographics
This is a scatter plot graph for quality standards ppt powerpoint presentation show infographics. This is a four stage process. The stages in this process are scatter plot, probability plots, plot diagram.
Bar Graph With Dollar Finance PowerPoint Templates And PowerPoint Themes 0512
Microsoft Powerpoint Templates and Background with business graph success-Bar Graph With Dollar Finance PowerPoint Templates And PowerPoint Themes 0512-These PowerPoint designs and slide layouts can be used for themes relating to -Business graph, success, global, marketing, finance, sales
Tablet With Growth Graph Business PowerPoint Templates And PowerPoint Themes 0912
Tablet With Growth Graph Business PowerPoint Templates And PowerPoint Themes 0912-Microsoft Powerpoint Templates and Background with tablets with a bar graph-Tablets with a bar graph, business, technology, success, finance, marketing

Tablet With Bar Graph Business PowerPoint Templates And PowerPoint Themes 0612
Tablet With Bar Graph Business PowerPoint Templates And PowerPoint Themes 0612-Microsoft Powerpoint Templates and Background with tablets with a bar graph

Bar Graph And Red Arrow Growth Business PowerPoint Templates And PowerPoint Themes 0712
Bar Graph And Red Arrow Growth Business PowerPoint Templates And PowerPoint Themes 0712-Microsoft Powerpoint Templates and Background with bar graph with arrow

Golden Bar Graph With Globe Business PowerPoint Templates And PowerPoint Themes 0712
Golden Bar Graph With Globe Business PowerPoint Templates And PowerPoint Themes Power Point-Microsoft Powerpoint Templates and Background with golden bar graph with globe
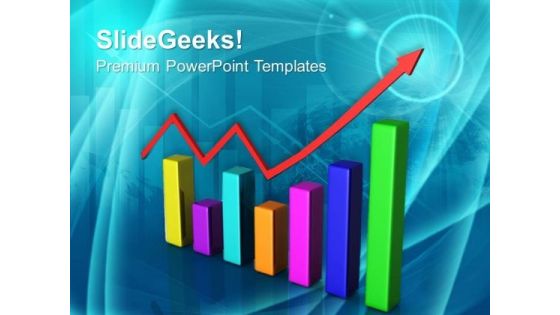
Bar Graph Red Arrow Business PowerPoint Templates And PowerPoint Themes 0712
Bar Graph Red Arrow Business PowerPoint Templates And PowerPoint Themes Business Power Points-Microsoft Powerpoint Templates and Background with bar graph with arrow

Bar Graph With Green Arrow Finance PowerPoint Templates And PowerPoint Themes 0712
Bar Graph With Green Arrow Finance PowerPoint Templates And PowerPoint Themes 0712-Microsoft Powerpoint Templates and Background with bar graph with arrow
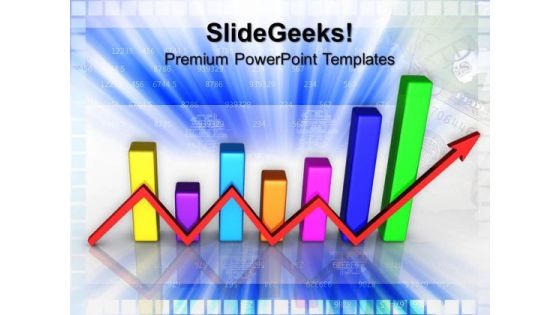
Bar Graph With Red Arrow Finance PowerPoint Templates And PowerPoint Themes 0712
Bar Graph With Red Arrow Finance PowerPoint Templates And PowerPoint Themes 0712-Microsoft Powerpoint Templates and Background with bar graph with arrow

Bar Graph And Dollars Money PowerPoint Templates And PowerPoint Themes 0912
Bar Graph And Dollars Money PowerPoint Templates And PowerPoint Themes 0912-Microsoft Powerpoint Templates and Background with bar graph and dollar money
Business Diagram Bar Graph With Different Icons For Business Presentation Template
Our above diagram slide displays bar graph graph that shows relationships between different data series. Use this diagram in your presentations to get good remarks from your viewers.

Arrow Around Bar Graph Business PowerPoint Templates And PowerPoint Themes 0712
Arrow Around Bar Graph Business PowerPoint Templates And PowerPoint Themes 0712-Microsoft Powerpoint Templates and Background with circular arrow placed around the bottom of a multi color bar chart
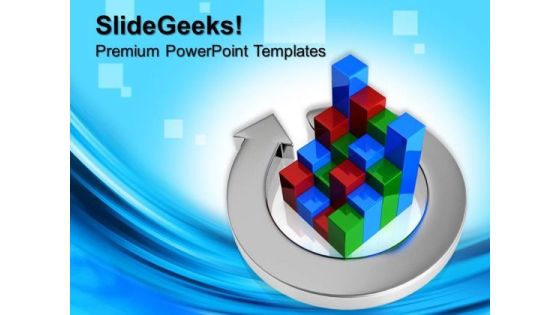
Metallic Arrow Around Bar Graph Finance PowerPoint Templates And PowerPoint Themes 0712
Metallic Arrow Around Bar Graph Finance PowerPoint Templates And PowerPoint Themes 0712-Microsoft Powerpoint Templates and Background with circular arrow placed around the bottom of a bar chart

Trend Chart Depicting Diminishing Graph And Chart Sales And Production Structure PDF
Pitch your topic with ease and precision using this Trend Chart Depicting Diminishing Graph And Chart Sales And Production Structure PDF. This layout presents information on Trend Chart Depicting, Diminishing Graph, Chart Sales And Production. It is also available for immediate download and adjustment. So, changes can be made in the color, design, graphics or any other component to create a unique layout.

Blue Dollar Graph Up Business PowerPoint Templates And PowerPoint Themes 0712
Blue Dollar Graph Up Business PowerPoint Templates And PowerPoint Themes 0712-Microsoft Powerpoint Templates and Background with arrow diagram moving up over dollar graph bar

Bar Graph Showing Revenues Generated By Sales Department Ppt Portfolio Graphics Example PDF
This graph or chart is linked to excel, and changes automatically based on data. Just left click on it and select edit data. Showcasing this set of slides titled bar graph showing revenues generated by sales department ppt portfolio graphics example pdf. The topics addressed in these templates are yearly sales revenues, sales team, profits. All the content presented in this PPT design is completely editable. Download it and make adjustments in color, background, font etc. as per your unique business setting.

IT Security Evaluation Scorecard With Bar Graph Ppt Gallery Design Templates PDF
This graph or chart is linked to excel, and changes automatically based on data. Just left click on it and select Edit Data. Deliver and pitch your topic in the best possible manner with this IT Security Evaluation Scorecard With Bar Graph Ppt Gallery Design Templates PDF. Use them to share invaluable insights on CPU Utilization Memory, Utilization Packet Loss and impress your audience. This template can be altered and modified as per your expectations. So, grab it now.

Area Graph Displaying Yearly Performance Analysis Ppt PowerPoint Presentation Slides Diagrams
Presenting this set of slides with name area graph displaying yearly performance analysis ppt powerpoint presentation slides diagrams. The topics discussed in these slide is area graph displaying yearly performance analysis. This is a completely editable PowerPoint presentation and is available for immediate download. Download now and impress your audience.

Sales By Area Graph Showing Revenue From Top Countries Inspiration PDF
Showcasing this set of slides titled Sales By Area Graph Showing Revenue From Top Countries Inspiration PDF. The topics addressed in these templates are Sales Area, Graph Showing, Revenue Countries. All the content presented in this PPT design is completely editable. Download it and make adjustments in color, background, font etc. as per your unique business setting.

Business Graph Showing Factor Income Trend Ppt PowerPoint Presentation Slides Mockup
Presenting this set of slides with name business graph showing factor income trend ppt powerpoint presentation slides mockup. The topics discussed in these slide is business graph showing factor income trend. This is a completely editable PowerPoint presentation and is available for immediate download. Download now and impress your audience.
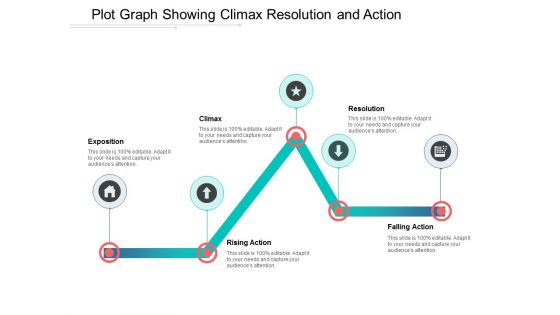
Plot Graph Showing Climax Resolution And Action Ppt Powerpoint Presentation Outline Themes
This is a plot graph showing climax resolution and action ppt powerpoint presentation outline themes. This is a five stage process. The stages in this process are scatter plot, probability plots, plot diagram.
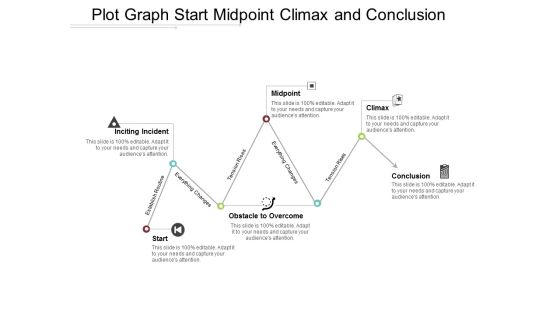
Plot Graph Start Midpoint Climax And Conclusion Ppt Powerpoint Presentation Portfolio Microsoft
This is a plot graph start midpoint climax and conclusion ppt powerpoint presentation portfolio microsoft. This is a six stage process. The stages in this process are scatter plot, probability plots, plot diagram.
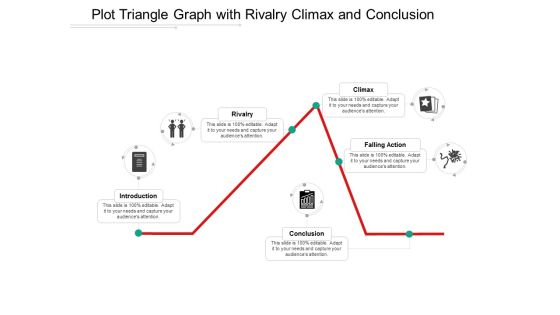
Plot Triangle Graph With Rivalry Climax And Conclusion Ppt Powerpoint Presentation Ideas Design Inspiration
This is a plot triangle graph with rivalry climax and conclusion ppt powerpoint presentation ideas design inspiration. This is a five stage process. The stages in this process are scatter plot, probability plots, plot diagram.

Business Education PowerPoint Templates Business Bar Graph Data Driven Ppt Slides
Business Education PowerPoint Templates Business bar graph data driven PPT Slides-This PowerPoint slide is a data driven Columns Chart. The number of columns depend on the data.-Business Editable PowerPoint Templates Business beveled column chart PPT Slides-This ppt can be used for concepts relating to-chart,, graph, growth, investment, , market, percentage, , presentation report, results, statistics, stock, success and business.
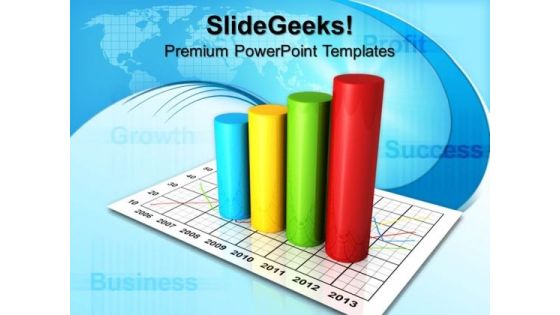
Business Circular Bar Graph Success PowerPoint Templates And PowerPoint Themes 0912
Business Circular Bar Graph Success PowerPoint Templates And PowerPoint Themes Presentations-Microsoft Powerpoint Templates and Background with circular business bar graph-Business Circular Bar Graph Success PowerPoint Templates And PowerPoint Themes PresentationsThis PPT can be used for presentations relating to-Circular business bar graph, cylinders, success, business, marketing, finance

Dollar And Bar Graph Metaphor PowerPoint Templates And PowerPoint Themes 1012
Dollar And Bar Graph Metaphor PowerPoint Templates And PowerPoint Themes 1012-Microsoft Powerpoint Templates and Background with dollar and bar graph-Dollar And Bar Graph Metaphor PowerPoint Templates And PowerPoint Themes 1012-This PowerPoint template can be used for presentations relating to-Dollar and bar graph, money, signs, finance, business, success

Bar Graph Showing Technology Trend Analysis Ppt PowerPoint Presentation File Mockup PDF
Presenting this set of slides with name bar graph showing technology trend analysis ppt powerpoint presentation file mockup pdf. The topics discussed in these slides are expanding rapidly, shrinking slowly. This is a completely editable PowerPoint presentation and is available for immediate download. Download now and impress your audience.

Business Revenue Bar Graph With Business Operational Expenditure Details Summary PDF
This slide represents business revenue bar graph with OPEX details which can be referred by companies to earn more revenue by controlling expenditures. It also provides information about marketing and sales, research and development, administration, total revenue, etc. Pitch your topic with ease and precision using this Business Revenue Bar Graph With Business Operational Expenditure Details Summary PDF. This layout presents information on Cost Of Marketing, Sales, Highest Amount. It is also available for immediate download and adjustment. So, changes can be made in the color, design, graphics or any other component to create a unique layout.

Bar Graph Depicting Liquidity Ratio Analysis For 5 Years Graphics PDF
This showcases bar graph that can help organization to compare the liquidity ratios and take mitigation actions in case of decline. It showcases comparison of cash, quick and current ratio for a period of 5 financial years. Showcasing this set of slides titled Bar Graph Depicting Liquidity Ratio Analysis For 5 Years Graphics PDF. The topics addressed in these templates are Organization To Compare, The Liquidity Ratios, Mitigation Action Decline. All the content presented in this PPT design is completely editable. Download it and make adjustments in color, background, font etc. as per your unique business setting.

Charity Fundraising Marketing Plan Bar Graph Ppt PowerPoint Presentation File Example Introduction PDF
Find highly impressive Charity Fundraising Marketing Plan Bar Graph Ppt PowerPoint Presentation File Example Introduction PDF on Slidegeeks to deliver a meaningful presentation. You can save an ample amount of time using these presentation templates. No need to worry to prepare everything from scratch because Slidegeeks experts have already done a huge research and work for you. You need to download Charity Fundraising Marketing Plan Bar Graph Ppt PowerPoint Presentation File Example Introduction PDF for your upcoming presentation. All the presentation templates are 100 percent editable and you can change the color and personalize the content accordingly. Download now.
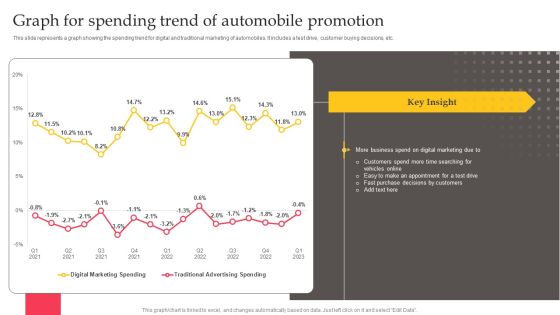
Executing Automotive Marketing Tactics For Sales Boost Graph For Spending Trend Information PDF
This slide represents a graph showing the spending trend for digital and traditional marketing of automobiles. It includes a test drive, customer buying decisions, etc. There are so many reasons you need a Executing Automotive Marketing Tactics For Sales Boost Graph For Spending Trend Information PDF. The first reason is you can not spend time making everything from scratch, Thus, Slidegeeks has made presentation templates for you too. You can easily download these templates from our website easily.

Business Diagram Bar Graph Style Timeline Diagram For Business Presentation Template
This business slide has been designed with bar graph style timeline diagram. Download this diagram to depict business annual plans and growth on your presentations. Make your presentations outshine using this diagram slide.
Dollar Mobile Bar Graph And Monitor Icons In Circles Powerpoint Templates
Our above slide has been designed with dollar, mobile, bar graph and monitor icons. This infographic slide is best to describe text information. You can provide a fantastic explanation of the topic with this slide.

Bar Graph Shows Financial Values Ppt PowerPoint Presentation Infographic Template Gridlines
This is a bar graph shows financial values ppt powerpoint presentation infographic template gridlines. This is a two stage process. The stages in this process are bar, marketing, strategy, finance, planning.

5 Level Bar Graph For Analysis With Icons Ppt PowerPoint Presentation Shapes
This is a 5 level bar graph for analysis with icons ppt powerpoint presentation shapes. This is a five stage process. The stages in this process are business, strategy, marketing, icons, growth, management.

Bar Graph To Show Company Sales Budget Ppt PowerPoint Presentation Sample
This is a bar graph to show company sales budget ppt powerpoint presentation sample. This is a four stage process. The stages in this process are business, finance, growth, success, marketing, arrow.

Bar Graph Icon For Data Analysis Ppt PowerPoint Presentation Pictures Ideas
This is a bar graph icon for data analysis ppt powerpoint presentation pictures ideas. This is a four stage process. The stages in this process are financial analysis, quantitative, statistical modelling.

Bar Graph Finance Planning Ppt PowerPoint Presentation Infographic Template Master Slide
This is a bar graph finance planning ppt powerpoint presentation infographic template master slide. This is a two stage process. The stages in this process are finance, analysis, business, investment, marketing.

Stock Photo World Map On Bar Graph For Data Growth Image Graphics For PowerPoint Slide
This image is designed with blue graph with world map printed on it. This conceptual image portrays the concepts of global business and global economy. This image slide will help you express your views to target audience.
Impact Of COVID 19 On The Hospitality Industry Bar Graph Portrait PDF
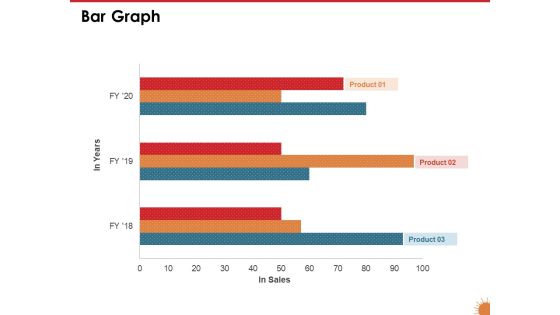
Presenting this set of slides with name impact of covid 19 on the hospitality industry bar graph portrait pdf. The topics discussed in these slide is bar chart. This is a completely editable PowerPoint presentation and is available for immediate download. Download now and impress your audience.

Bar Graph Showing Car Production Report Ppt PowerPoint Presentation Outline Master Slide PDF
Presenting this set of slides with name bar graph showing car production report ppt powerpoint presentation outline master slide pdf. The topics discussed in these slides are sedan model, hatchbacks model, 2017 to 2020. This is a completely editable PowerPoint presentation and is available for immediate download. Download now and impress your audience.

Bar Graph Showing Increase In Annual Cost Ppt PowerPoint Presentation Infographic Template Inspiration PDF
Presenting this set of slides with name bar graph showing increase in annual cost ppt powerpoint presentation infographic template inspiration pdf. The topics discussed in these slides are 2015 to 2020. This is a completely editable PowerPoint presentation and is available for immediate download. Download now and impress your audience.

Bar Graph Showing Sales Projections Ppt PowerPoint Presentation Styles Graphics Download PDF
Presenting this set of slides with name bar graph showing sales projections ppt powerpoint presentation styles graphics download pdf. The topics discussed in these slides are Sales, Forecasted Sales. This is a completely editable PowerPoint presentation and is available for immediate download. Download now and impress your audience.

Bar Graph Showing Imported And Domestic Film Profit Ppt PowerPoint Presentation Icon Model PDF
Presenting this set of slides with name bar graph showing imported and domestic film profit ppt powerpoint presentation icon model pdf. The topics discussed in these slides are imported films, domestic films. This is a completely editable PowerPoint presentation and is available for immediate download. Download now and impress your audience.

Bar Graph Showing Profit Analysis Ppt PowerPoint Presentation Icon Deck PDF
Presenting this set of slides with name bar graph showing profit analysis ppt powerpoint presentation icon deck pdf. The topics discussed in these slides are gross revenue, income. This is a completely editable PowerPoint presentation and is available for immediate download. Download now and impress your audience.
Bar Graph Showing Of Business Income And Expenditure Ppt PowerPoint Presentation Icon Show PDF
Presenting this set of slides with name bar graph showing of business income and expenditure ppt powerpoint presentation icon show pdf. The topics discussed in these slides are expenses, revenue. This is a completely editable PowerPoint presentation and is available for immediate download. Download now and impress your audience.

Business Power Consumption Statistics Bar Graph Ppt PowerPoint Presentation Gallery Slides PDF
Presenting this set of slides with name business power consumption statistics bar graph ppt powerpoint presentation gallery slides pdf. The topics discussed in these slides are electricity, consumption, plant. This is a completely editable PowerPoint presentation and is available for immediate download. Download now and impress your audience.

Bar Graph For Business Sales And Profit Assessment Ppt PowerPoint Presentation File Tips PDF
Presenting this set of slides with name bar graph for business sales and profit assessment ppt powerpoint presentation file tips pdf. The topics discussed in these slides are sales, gross margin, net profit. This is a completely editable PowerPoint presentation and is available for immediate download. Download now and impress your audience.

Bar Graph For Return On Investment Analysis Ppt PowerPoint Presentation Infographics Structure PDF
Presenting this set of slides with name bar graph for return on investment analysis ppt powerpoint presentation infographics structure pdf. The topics discussed in these slides are sales, roi. This is a completely editable PowerPoint presentation and is available for immediate download. Download now and impress your audience.

Bar Graph Showing License Users Of Three Countries Ppt PowerPoint Presentation Outline Guide PDF
Presenting this set of slides with name bar graph showing license users of three countries ppt powerpoint presentation outline guide pdf. The topics discussed in these slides are 2017 to 2020. This is a completely editable PowerPoint presentation and is available for immediate download. Download now and impress your audience.

Bar Graph Showing Profit Ratio Analysis Ppt PowerPoint Presentation Styles Brochure PDF
Presenting this set of slides with name bar graph showing profit ratio analysis ppt powerpoint presentation styles brochure pdf. The topics discussed in these slides are 2015 to 2020. This is a completely editable PowerPoint presentation and is available for immediate download. Download now and impress your audience.

Bar Graph Showing Sales Cost And Profit Analysis Ppt PowerPoint Presentation Infographics Images PDF
Presenting this set of slides with name bar graph showing sales cost and profit analysis ppt powerpoint presentation infographics images pdf. The topics discussed in these slides are sales, cost, roi, profit. This is a completely editable PowerPoint presentation and is available for immediate download. Download now and impress your audience.

Bar Graph Showing The Reasons Behind Bad Employee Performance Ppt PowerPoint Presentation Slides Tips PDF
Presenting this set of slides with name bar graph showing the reasons behind bad employee performance ppt powerpoint presentation slides tips pdf. The topics discussed in these slides are work environment, job satisfaction, promotion prospects, respect from colleagues, job security, competent boss, relaxed working environment. This is a completely editable PowerPoint presentation and is available for immediate download. Download now and impress your audience.
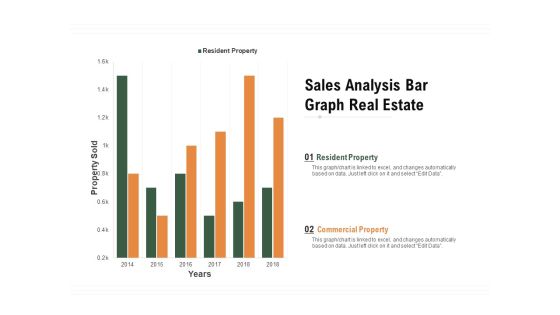
Sales Analysis Bar Graph Real Estate Ppt PowerPoint Presentation Infographic Template Show PDF
Pitch your topic with ease and precision using this sales analysis bar graph real estate ppt powerpoint presentation infographic template show pdf. This layout presents information on resident property, commercial property, property sold, 2014 to 2018. It is also available for immediate download and adjustment. So, changes can be made in the color, design, graphics or any other component to create a unique layout.

Bar Graph Depicting Hike In Price Rate In Recent Years Ppt PowerPoint Presentation Gallery Guidelines PDF
Showcasing this set of slides titled bar graph depicting hike in price rate in recent years ppt powerpoint presentation gallery guidelines pdf. The topics addressed in these templates are prices, target, inflation rate. All the content presented in this PPT design is completely editable. Download it and make adjustments in color, background, font etc. as per your unique business setting.
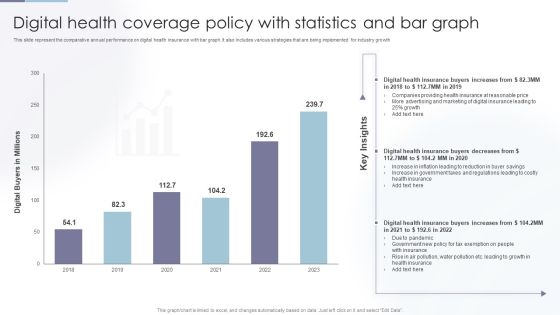
Digital Health Coverage Policy With Statistics And Bar Graph Clipart PDF
Showcasing this set of slides titled Digital Health Coverage Policy With Statistics And Bar Graph Clipart PDF. The topics addressed in these templates are Digital Health, Health Insurance, Insurance At Reasonable. All the content presented in this PPT design is completely editable. Download it and make adjustments in color, background, font etc. as per your unique business setting.

Horizontal Bar Graph With Profit Percentage Of Company Ppt PowerPoint Presentation Shapes
This is a horizontal bar graph with profit percentage of company ppt powerpoint presentation shapes. This is a five stage process. The stages in this process are business, strategy, marketing, analysis, slide bar, target.
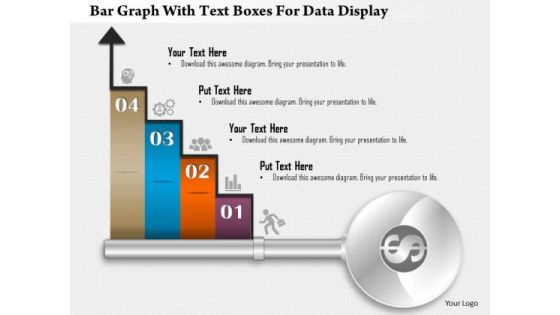
Business Diagram Bar Graph With Text Boxes For Data Display Presentation Template
Our above business diagram displays bar graph. It contains four steps on bar graph with icons. Use this diagram to display four stages of business growth. Download this Power Point slide to build quality presentation for your viewers.

Area Graph Showing Sales Trends Over Time Ppt PowerPoint Presentation Model Background Designs
This is a area graph showing sales trends over time ppt powerpoint presentation model background designs. This is a three stage process. The stages in this process are financial analysis, quantitative, statistical modelling.

Cost Reduction Bar Graph For Organization Optimization Ppt Inspiration Vector PDF
This slide represent cost saving with benefits in an organization and areas where more efficiencies are utilized. It includes travel, administrative and hiring. Pitch your topic with ease and precision using this Cost Reduction Bar Graph For Organization Optimization Ppt Inspiration Vector PDF. This layout presents information on Total Cost Benefits, Promoting Employees, Providing Perks. It is also available for immediate download and adjustment. So, changes can be made in the color, design, graphics or any other component to create a unique layout.

Business Diagram Graph Of Sustainable Environment With Business Growth Presentation Template
This diagram displays bar graph with globes and growth arrow. This image depicts concepts of green environment and business growth .Use this diagram to present your views in a wonderful manner.

Financial Projection Graph Template 1 Ppt PowerPoint Presentation Professional Example Introduction
This is a financial projection graph template 1 ppt powerpoint presentation professional example introduction. This is a three stage process. The stages in this process are business, bar graph, finance, marketing, strategy, analysis.

Financial Projection Graph Template 2 Ppt PowerPoint Presentation Infographic Template Gallery
This is a financial projection graph template 2 ppt powerpoint presentation infographic template gallery. This is a three stage process. The stages in this process are business, bar graph, finance, marketing, strategy, analysis.

Employee Retention Graph For Hotel Business Ppt PowerPoint Presentation Show Skills PDF
Presenting this set of slides with name employee retention graph for hotel business ppt powerpoint presentation show skills pdf. The topics discussed in these slides are bar, counter, kitchen, management, other, server, support. This is a completely editable PowerPoint presentation and is available for immediate download. Download now and impress your audience.

Circular Bar Graph Business Success PowerPoint Templates And PowerPoint Themes 1012
Circular Bar Graph Business Success PowerPoint Templates And PowerPoint Themes 1012-The above template displays a diagram of blue circular progress bars. This image represent the concept of business growth and success. This template imitates economy, finance, global, goal, growth, ideas, information, management, profit and statistics. This image has been conceived to enable you to emphatically communicate your ideas in your Business and Marketing PPT presentations. Use this template for financial analysis, business reviews and statistics. Go ahead and add charm to your presentations with our high quality template.-Circular Bar Graph Business Success PowerPoint Templates And PowerPoint Themes 1012-This PowerPoint template can be used for presentations relating to-Circular success graph, marketing, business, finance, success, circle charts
Bar Graph And Pie Chart Marketing PowerPoint Templates And PowerPoint Themes 0612
Bar Graph And Pie Chart Marketing PowerPoint Templates And PowerPoint Themes 0612-Microsoft Powerpoint Templates and Background with bar and pie chart
Bar Graph And Pie Chart Global PowerPoint Templates And PowerPoint Themes 0612
Bar Graph And Pie Chart Global PowerPoint Templates And PowerPoint Themes Business PPT Templates-Bar and pie chart, background, business, success, finance, marketing
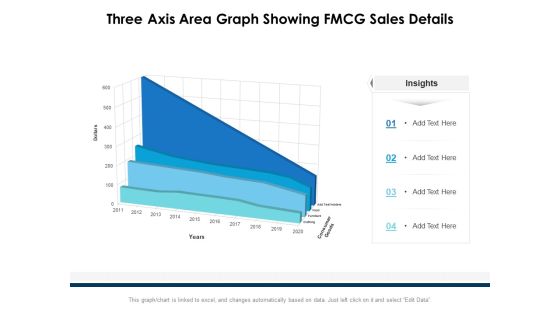
Three Axis Area Graph Showing FMCG Sales Details Ppt PowerPoint Presentation Ideas Layouts PDF
Presenting this set of slides with name three axis area graph showing fmcg sales details ppt powerpoint presentation ideas layouts pdf. The topics discussed in these slides are consumer goods, dollars, 2011 to 2020. This is a completely editable PowerPoint presentation and is available for immediate download. Download now and impress your audience.

Bar Graph And Pie Chat Business PowerPoint Templates And PowerPoint Themes 0712
Bar Graph And Pie Chat Business PowerPoint Templates And PowerPoint Themes 0712-Microsoft Powerpoint Templates and Background with bar and pie chart

Lego Bar Graph Building Business PowerPoint Templates And PowerPoint Themes 0512
Lego Bar Graph Building Business PowerPoint Templates And PowerPoint Themes PPT designs-Microsoft Powerpoint Templates and Background with achievement chart from building blocks
 Home
Home