Kpis

Measure Ad Impression Share With Improvement Strategies Ppt Summary Picture PDF
The following slide covers the impression share metrics to increase engagement and searches. It includes key elements such as description, affecting factors, preference, impact strategies, calculation etc. Welcome to our selection of the Measure Ad Impression Share With Improvement Strategies Ppt Summary Picture PDF. These are designed to help you showcase your creativity and bring your sphere to life. Planning and Innovation are essential for any business that is just starting out. This collection contains the designs that you need for your everyday presentations. All of our PowerPoints are 100 percent editable, so you can customize them to suit your needs. This multi purpose template can be used in various situations. Grab these presentation templates today.

Supply Chain Strategic Planning KPI Dashboard Depicting Inventory And Costs Template PDF
This slide delineates supply planning key performance indicator kpi dashboard depicting inventory and costs which can assist logistics manager in determining demand and supply of products. It includes information about transaction based on units, out of stock products, inventory turnover and month to date expenditures. Showcasing this set of slides titled Supply Chain Strategic Planning KPI Dashboard Depicting Inventory And Costs Template PDF. The topics addressed in these templates are Transaction Based Units, 2016 To 2022. All the content presented in this PPT design is completely editable. Download it and make adjustments in color, background, font etc. as per your unique business setting.

Business Unit Valuation And Development Dashboard Ppt Professional Graphic Tips PDF
This slide shows key performance indicators dashboard which represents number of assets along with their stages of development. It also includes estimated development cost and production index comparison. Pitch your topic with ease and precision using this Business Unit Valuation And Development Dashboard Ppt Professional Graphic Tips PDF. This layout presents information on Estimated Development Cost, Production Index, Development Stage. It is also available for immediate download and adjustment. So, changes can be made in the color, design, graphics or any other component to create a unique layout.
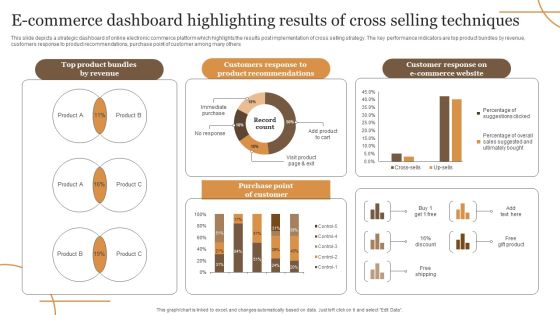
E Commerce Dashboard Highlighting Results Of Cross Selling Techniques Elements PDF
This slide depicts a strategic dashboard of online electronic commerce platform which highlights the results post implementation of cross selling strategy. The key performance indicators are top product bundles by revenue, customers response to product recommendations, purchase point of customer among many others. Showcasing this set of slides titled E Commerce Dashboard Highlighting Results Of Cross Selling Techniques Elements PDF. The topics addressed in these templates are Revenue, E Commerce Website, Purchase. All the content presented in this PPT design is completely editable. Download it and make adjustments in color, background, font etc. as per your unique business setting.

Dashboard To Depict Strategic B2B Communication Rollout Plan Success Portrait PDF
This slide consists of a dashboard that can be used to depict the success of a B2B communication rollout. Key performing indicators included in the slide are products sold, total revenue, client satisfaction, net profit, etc. Showcasing this set of slides titled Dashboard To Depict Strategic B2B Communication Rollout Plan Success Portrait PDF. The topics addressed in these templates are Product Sold, Total Revenue, B2b Client Satisfication. All the content presented in this PPT design is completely editable. Download it and make adjustments in color, background, font etc. as per your unique business setting.
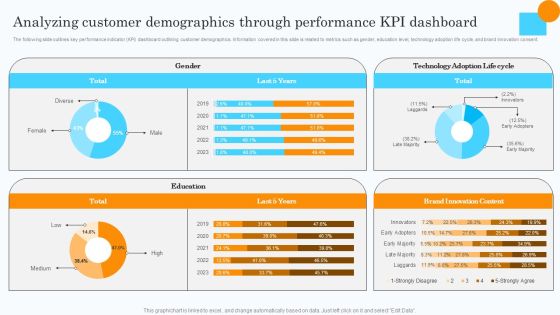
Market Research Assessment Of Target Market Requirements Analyzing Customer Demographics Clipart PDF
The following slide outlines key performance indicator KPI dashboard outlining customer demographics. Information covered in this slide is related to metrics such as gender, education level, technology adoption life cycle, and brand innovation consent. There are so many reasons you need a Market Research Assessment Of Target Market Requirements Analyzing Customer Demographics Clipart PDF. The first reason is you cannot spend time making everything from scratch, Thus, Slidegeeks has made presentation templates for you too. You can easily download these templates from our website easily.

Strategic Management Dashbaord Design To Communicate Effectively Strategy Diagram
Get Out Of The Dock With Our Strategic Management Dashbaord Design To Communicate Effectively Powerpoint Templates. Your Mind Will Be Set Free.
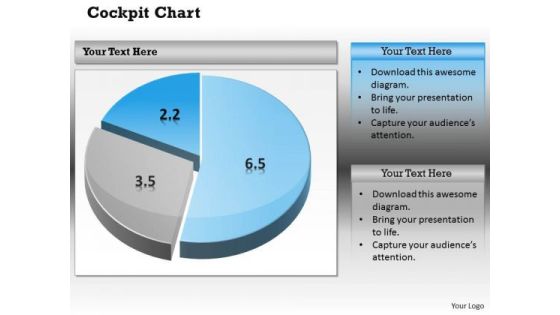
Business Cycle Diagram Pie Chart Dashborad Design Marketing Diagram
Document Your Views On Our Business Cycle Diagram Pie Chart Dashborad Design Marketing Diagram Powerpoint Templates. They Will Create A Strong Impression.
Strategy Diagram Design Of Red Large Building Business Diagram
Open Up Doors That Lead To Success. Our Strategy Diagram Design Of Red Large Building Business Diagram Powerpoint Templates Provide The Handles.

Strategy Diagram Meter Design For Business Progress Sales Diagram
Our Strategy Diagram Meter Design For Business Progress Sales Diagram Powerpoint Templates Abhor Doodling. They Never Let The Interest Flag.
Four Circles With Social Communication Icons Powerpoint Slides
Concept of social communication can be well explained with this power point template. This PPT slide contains the four circles with communication icons. Use this diagram slide to make impressive presentations.
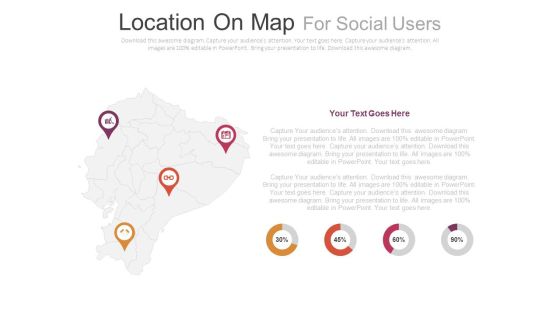
Four Locations On Map With Percentage Analysis Powerpoint Slides
This PowerPoint slide contains diagram of map with location pointers and icons. This professional slide helps to exhibit demographics of social media users. Use this PowerPoint template to make impressive presentations.

Four Steps For Financial Data Analysis Powerpoint Slides
This PowerPoint contains four circles with percentage values. Download this diagram slide to display financial data analysis. This template is editable, You can edit text, color, shade and style of this diagram as per you need.
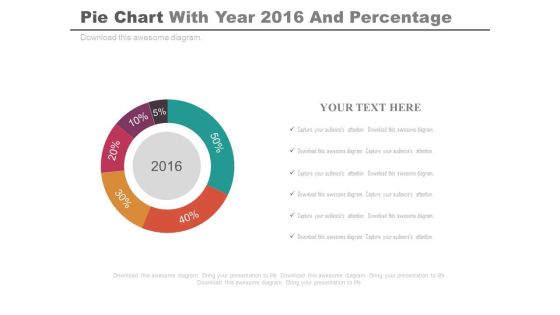
Pie Chart For Projected Profit Of 2016 Powerpoint Slides
Our above PPT slide displays graphics of Pie chart. This PowerPoint template may be used to display projected profit report of 2016. Download this template to leave permanent impression on your audience.
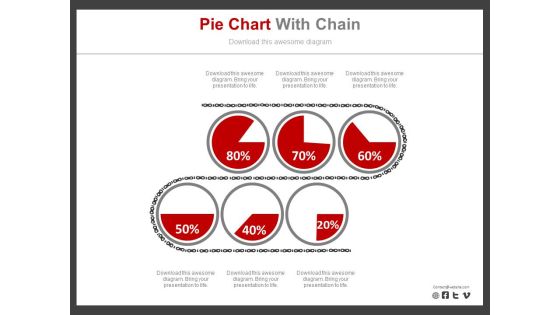
Six Pie Charts For Revenue Analysis Report Powerpoint Slides
Six pie charts have been displayed in this business slide. This business diagram helps to exhibit revenue analysis report. Download this PowerPoint template to build an exclusive presentation.
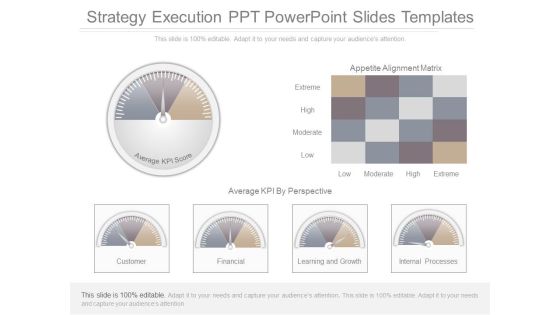
Strategy Execution Ppt Powerpoint Slides Templates
This is a strategy execution ppt powerpoint slides templates. This is a six stage process. The stages in this process are appetite alignment matrix, extreme, high, moderate, low, average kpi by prospective, customer, financial, learning and growth, internal processes, average kpi score.
Social Media Icons With Pie Charts For Marketing Analysis Ppt PowerPoint Presentation Ideas Example
This is a social media icons with pie charts for marketing analysis ppt powerpoint presentation ideas example. This is a six stage process. The stages in this process are kpi proposal, kpi plan, kpi scheme.

Accelerator Meter Speed Icon Ppt Powerpoint Presentation Professional Good
This is a accelerator meter speed icon ppt powerpoint presentation professional good. This is a three stage process. The stages in this process are accelerator, seed accelerators, startup accelerator.

Accelerator Speed Meter Icon Ppt Powerpoint Presentation Outline Layout
This is a accelerator speed meter icon ppt powerpoint presentation outline layout. This is a four stage process. The stages in this process are accelerator, seed accelerators, startup accelerator.
Speed Level Meter Icon Ppt Powerpoint Presentation Inspiration Slides
This is a speed level meter icon ppt powerpoint presentation inspiration slides. This is a four stage process. The stages in this process are accelerator, seed accelerators, startup accelerator.
Speed Meter Vector Icon Ppt Powerpoint Presentation Model Inspiration
This is a speed meter vector icon ppt powerpoint presentation model inspiration. This is a four stage process. The stages in this process are accelerator, seed accelerators, startup accelerator.
Speedometer Vector Icon Ppt Powerpoint Presentation Gallery Objects
This is a speedometer vector icon ppt powerpoint presentation gallery objects. This is a four stage process. The stages in this process are accelerator, seed accelerators, startup accelerator.
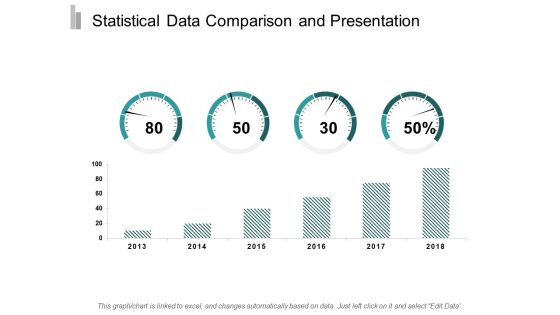
Statistical Data Comparison And Presentation Ppt Powerpoint Presentation Gallery Backgrounds
This is a statistical data comparison and presentation ppt powerpoint presentation gallery backgrounds. This is a two stage process. The stages in this process are data presentation, content presentation, information presentation.
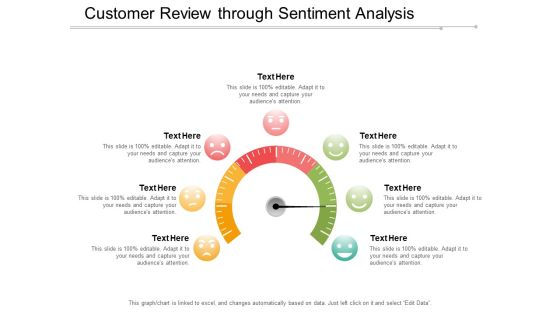
Customer Review Through Sentiment Analysis Ppt Powerpoint Presentation Show Design Templates
This is a customer review through sentiment analysis ppt powerpoint presentation show design templates. This is a six stage process. The stages in this process are feeling, emotion, sentiment.

Customer Satisfaction Levels Good Great Excellent Ppt PowerPoint Presentation Professional Deck
Presenting this set of slides with name customer satisfaction levels good great excellent ppt powerpoint presentation professional deck. This is a six stage process. The stages in this process are product quality, product improvement, rating scale. This is a completely editable PowerPoint presentation and is available for immediate download. Download now and impress your audience.

Customer Service Feedback Survey Ppt PowerPoint Presentation Outline Background Image
Presenting this set of slides with name customer service feedback survey ppt powerpoint presentation outline background image. This is a three stage process. The stages in this process are product quality, product improvement, rating scale. This is a completely editable PowerPoint presentation and is available for immediate download. Download now and impress your audience.
Emoji Reactions For Service Feedback Ppt PowerPoint Presentation Icon Brochure
Presenting this set of slides with name emoji reactions for service feedback ppt powerpoint presentation icon brochure. This is a five stage process. The stages in this process are product quality, product improvement, rating scale. This is a completely editable PowerPoint presentation and is available for immediate download. Download now and impress your audience.

Levels Of Customer Satisfaction Ppt PowerPoint Presentation Infographic Template Designs
Presenting this set of slides with name levels of customer satisfaction ppt powerpoint presentation infographic template designs. This is a five stage process. The stages in this process are product quality, product improvement, rating scale. This is a completely editable PowerPoint presentation and is available for immediate download. Download now and impress your audience.
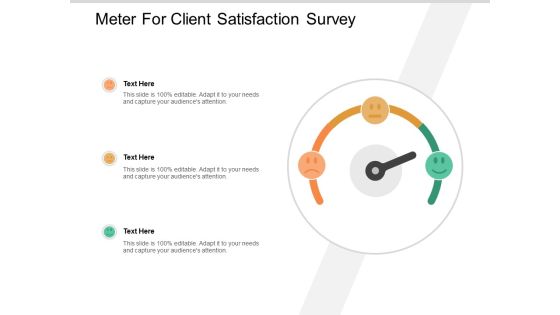
Meter For Client Satisfaction Survey Ppt PowerPoint Presentation Portfolio Outline
Presenting this set of slides with name meter for client satisfaction survey ppt powerpoint presentation portfolio outline. This is a three stage process. The stages in this process are product quality, product improvement, rating scale. This is a completely editable PowerPoint presentation and is available for immediate download. Download now and impress your audience.
Red Yellow Green Emoticons For Feedback Ppt PowerPoint Presentation Infographics Deck
Presenting this set of slides with name red yellow green emoticons for feedback ppt powerpoint presentation infographics deck. This is a three stage process. The stages in this process are product quality, product improvement, rating scale. This is a completely editable PowerPoint presentation and is available for immediate download. Download now and impress your audience.
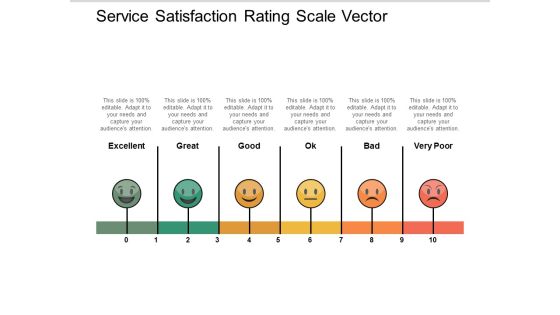
Service Satisfaction Rating Scale Vector Ppt PowerPoint Presentation Professional Background Image
Presenting this set of slides with name service satisfaction rating scale vector ppt powerpoint presentation professional background image. This is a six stage process. The stages in this process are product quality, product improvement, rating scale. This is a completely editable PowerPoint presentation and is available for immediate download. Download now and impress your audience.
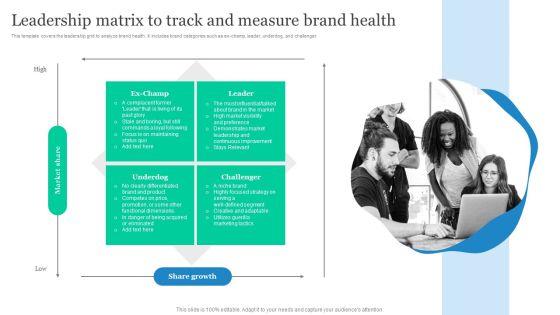
Effective Product Positioning Approach Leadership Matrix To Track And Measure Brand Health Inspiration PDF
This template covers the leadership grid to analyze brand health. It includes brand categories such as ex-champ, leader, underdog, and challenger. From laying roadmaps to briefing everything in detail, our templates are perfect for you. You can set the stage with your presentation slides. All you have to do is download these easy to edit and customizable templates. Effective Product Positioning Approach Leadership Matrix To Track And Measure Brand Health Inspiration PDF will help you deliver an outstanding performance that everyone would remember and praise you for. Do download this presentation today.

Best Techniques To Enhance New Product Management Efficiency Considerations That Affect Product Diagrams PDF
This slide focuses on key considerations that affects product differentiation success such as features, technology, performance, design, customer service and quality. This is a best techniques to enhance new product management efficiency comparing product metrics themes pdf template with various stages. Focus and dispense information on three stages using this creative set, that comes with editable features. It contains large content boxes to add your information on topics like proprietary technology, performance, customer service. You can also showcase facts, figures, and other relevant content using this PPT layout. Grab it now.
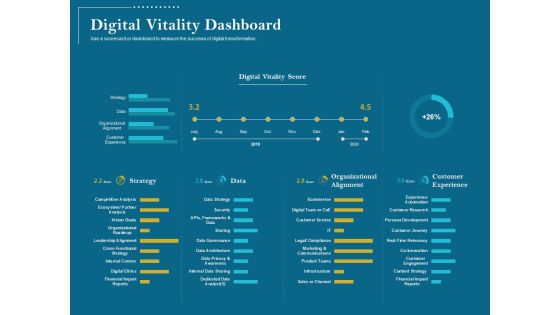
Utilizing Cyber Technology For Change Process Digital Vitality Dashboard Guidelines PDF
Use a scorecard or dashboard to measure the success of digital transformation. Deliver an awe-inspiring pitch with this creative utilizing cyber technology for change process digital vitality dashboard guidelines pdf. bundle. Topics like organizational alignment, ecommerce, digital team or coe, customer service, marketing and communications, product teams, infrastructure can be discussed with this completely editable template. It is available for immediate download depending on the needs and requirements of the user.
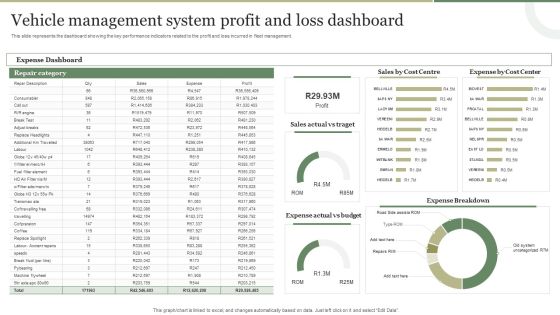
Vehicle Management System Profit And Loss Dashboard Brochure PDF
This slide represents the dashboard showing the key performance indicators related to the profit and loss incurred in fleet management. Showcasing this set of slides titled Vehicle Management System Profit And Loss Dashboard Brochure PDF. The topics addressed in these templates are Vehicle Management System, Profit And Loss Dashboard. All the content presented in this PPT design is completely editable. Download it and make adjustments in color, background, font etc. as per your unique business setting.

Storage Facility Orders Productivity Management Dashboard Diagrams PDF
This slide showcases a dashboard for tracking and managing orders productivity performance at warehouse. It includes key components such as collection time, daily orders, number of workers per shift, top ordered products and least ordered products. Showcasing this set of slides titled Storage Facility Orders Productivity Management Dashboard Diagrams PDF. The topics addressed in these templates are Top Most Ordered Products, Least Ordered Products, Orders Per Day. All the content presented in this PPT design is completely editable. Download it and make adjustments in color, background, font etc. as per your unique business setting.
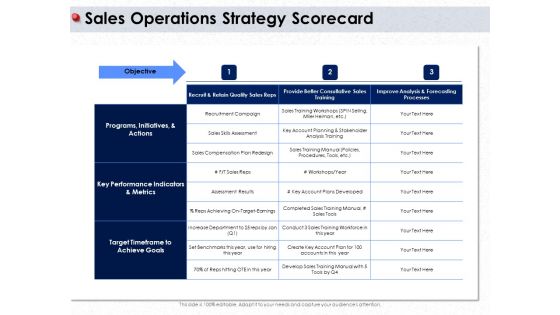
Ways To Design Impactful Trading Solution Sales Operations Strategy Scorecard Ppt PowerPoint Presentation Show Slide Portrait PDF
Presenting this set of slides with name ways to design impactful trading solution sales operations strategy scorecard ppt powerpoint presentation show slide portrait pdf. The topics discussed in these slides are programs, initiatives, and actions, key performance indicators and metrics, target timeframe to achieve goals, sales compensation plan redesign, sales skills assessment. This is a completely editable PowerPoint presentation and is available for immediate download. Download now and impress your audience.
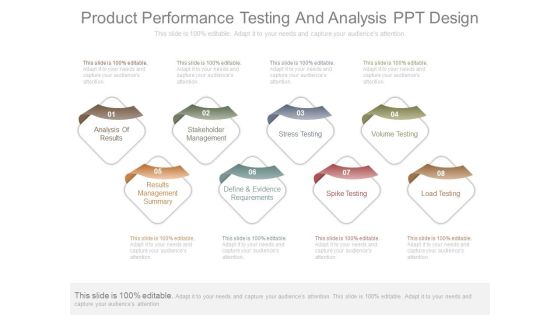
Product Performance Testing And Analysis Ppt Design
This is a product performance testing and analysis ppt design. This is a eight stage process. The stages in this process are analysis of results, stakeholder management, stress testing, volume testing, results management summary, define and evidence requirements, spike testing, load testing.
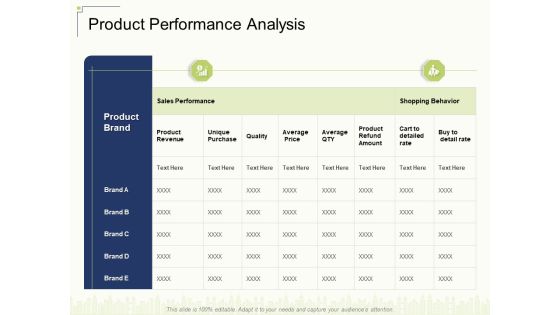
Product Performance Analysis Ppt Ideas Topics PDF
Deliver an awe inspiring pitch with this creative product performance analysis ppt ideas topics pdf bundle. Topics like revenue, purchase, price, rate, buy can be discussed with this completely editable template. It is available for immediate download depending on the needs and requirements of the user.

Quarterly Business Information Dashboard With Product Segments Slides PDF
This slide displays dashboard for performance analysis of key business operations to compare companys growth in different quarters. It further includes information such as sales, revenue, gross profit, income and expenditure, etc. Showcasing this set of slides titled Quarterly Business Information Dashboard With Product Segments Slides PDF. The topics addressed in these templates are Quarterly Business Information, Dashboard With Product Segments. All the content presented in this PPT design is completely editable. Download it and make adjustments in color, background, font etc. as per your unique business setting.
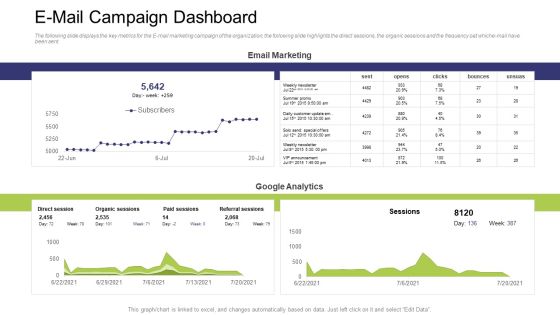
E Mail Campaign Dashboard Ppt Infographic Template Clipart Images PDF
The following slide displays the key metrics for the E-mail marketing campaign of the organization, the following slide highlights the direct sessions, the organic sessions and the frequency oat whiche-mail have been sent Deliver and pitch your topic in the best possible manner with this e mail campaign dashboard ppt infographic template clipart images pdf. Use them to share invaluable insights on direct session, paid sessions, organic sessions, referral sessions and impress your audience. This template can be altered and modified as per your expectations. So, grab it now.

Online Marketing KPI Dashboard With Cost Trend Slides PDF
The following slide highlights the key metrics of digital marketing to reach the target audience in the most cost effective way. It includes average daily impressions, click through rate, cost per click, lead generation, conversion and scoring etc. Pitch your topic with ease and precision using this Online Marketing KPI Dashboard With Cost Trend Slides PDF. This layout presents information on Average Daily Impressions, Click Through Rate, Cost Per Click, Lead Generation, Conversion And Scoring. It is also available for immediate download and adjustment. So, changes can be made in the color, design, graphics or any other component to create a unique layout.

Media Advertising Social Media Channel Performance Dashboard Pictures PDF
This slide depicts the key metrics used to track the performance of social media channels in form of increase in followers, clicks and likes. This modern and well-arranged Media Advertising Social Media Channel Performance Dashboard Pictures PDF provides lots of creative possibilities. It is very simple to customize and edit with the Powerpoint Software. Just drag and drop your pictures into the shapes. All facets of this template can be edited with Powerpoint, no extra software is necessary. Add your own material, put your images in the places assigned for them, adjust the colors, and then you can show your slides to the world, with an animated slide included.
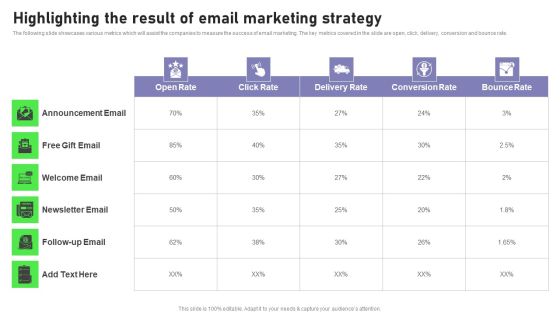
Retail Outlet Opening To Enhance Product Sale Highlighting The Result Of Email Themes PDF
The following slide showcases various metrics which will assist the companies to measure the success of email marketing. The key metrics covered in the slide are open, click, delivery, conversion and bounce rate. This Retail Outlet Opening To Enhance Product Sale Highlighting The Result Of Email Themes PDF from Slidegeeks makes it easy to present information on your topic with precision. It provides customization options, so you can make changes to the colors, design, graphics, or any other component to create a unique layout. It is also available for immediate download, so you can begin using it right away. Slidegeeks has done good research to ensure that you have everything you need to make your presentation stand out. Make a name out there for a brilliant performance.
Product Performance And Product Competitive Analysis Icons Slide Download PDF
Help your business to create an attention grabbing presentation using our product performance and product performance and product competitive analysis icons slide download pdf set of slides. The slide contains innovative icons that can be flexibly edited. Choose this product performance and product competitive analysis icons slide download pdf template to create a satisfactory experience for your customers. Go ahead and click the download button.

New Product Development Process Optimization Measuring Affect Of Development Professional PDF
This slide covers the impact of product development strategies on product volume, revenues, sales, time to market, process and product quality with difference in relative profit growth. Deliver and pitch your topic in the best possible manner with this new product development process optimization measuring affect of development professional pdf . Use them to share invaluable insights on dashboard depicting product usage metrics and impress your audience. This template can be altered and modified as per your expectations. So, grab it now.

Implementing Marketing Mix Strategy To Enhance Overall Performance Social Media Dashboard To Understand Marketing Efforts Guidelines PDF
The following dashboard helps the organization in analyzing the key metrics to track performance of their social media digital marketing strategy, these metrics are followers, likes and visits. Deliver and pitch your topic in the best possible manner with this Implementing Marketing Mix Strategy To Enhance Overall Performance Social Media Dashboard To Understand Marketing Efforts Guidelines PDF. Use them to share invaluable insights on Sales, New Customer, New Revenue and impress your audience. This template can be altered and modified as per your expectations. So, grab it now.

Organization Compliance Metrics Ppt Slides Master Slide PDF
This slide covers the metrics that measure what you are doing with the awareness project, exactly how you will train and how. Such metrics are of particular importance for purposes of compliance and monitoring. Deliver and pitch your topic in the best possible manner with this organization compliance metrics ppt slides master slide pdf. Use them to share invaluable insights on procedures, organization, measured, metric and impress your audience. This template can be altered and modified as per your expectations. So, grab it now.
Waste Bin Kpi Dashboard Ppt PowerPoint Presentation Icon Show PDF
This slide covers the Key performance indicator for waste bins such as fill level, odour level and weight. Deliver an awe inspiring pitch with this creative waste bin kpi dashboard ppt powerpoint presentation icon show pdf bundle. Topics like waste bin kpi dashboard can be discussed with this completely editable template. It is available for immediate download depending on the needs and requirements of the user.
Waste Management Tracking Dashboard Ppt PowerPoint Presentation File Information PDF
This slide covers the key performance indicators for waste management including waste trucks tracker, green house gasses emissions, energy used and many more. Deliver an awe inspiring pitch with this creative waste management tracking dashboard ppt powerpoint presentation file information pdf bundle. Topics like waste management tracking dashboard can be discussed with this completely editable template. It is available for immediate download depending on the needs and requirements of the user.

Dangerous Waste Management Waste Bin KPI Dashboard Formats PDF
This slide covers the Key performance indicator for waste bins such as fill level, odour level and weight. Deliver and pitch your topic in the best possible manner with this dangerous waste management waste bin kpi dashboard formats pdf. Use them to share invaluable insights on waste bin kpi dashboard and impress your audience. This template can be altered and modified as per your expectations. So, grab it now.

Dangerous Waste Management Waste Management Tracking Dashboard Summary PDF
This slide covers the key performance indicators for waste management including waste trucks tracker, green house gasses emissions, energy used and many more Deliver and pitch your topic in the best possible manner with this dangerous waste management waste management tracking dashboard summary pdf. Use them to share invaluable insights on waste management tracking dashboard and impress your audience. This template can be altered and modified as per your expectations. So, grab it now.
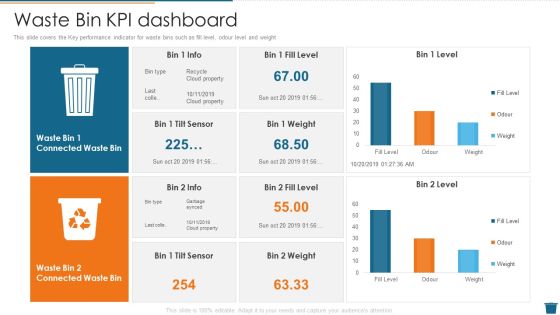
Factory Waste Management Waste Bin Kpi Dashboard Demonstration PDF
This slide covers the Key performance indicator for waste bins such as fill level, odour level and weight Deliver and pitch your topic in the best possible manner with this factory waste management waste bin kpi dashboard demonstration pdf. Use them to share invaluable insights on waste bin kpi dashboard and impress your audience. This template can be altered and modified as per your expectations. So, grab it now.

Software Market Penetration KPI Dashboard Ppt Outline Aids PDF
This slide shows market penetration key performance indicator KPI dashboard for software sector. It provides information about growth rate, portfolio, platform, applications, services, on premises, cloud, etc. Pitch your topic with ease and precision using this Software Market Penetration KPI Dashboard Ppt Outline Aids PDF. This layout presents information on Market Size, Global Market, Cloud. It is also available for immediate download and adjustment. So, changes can be made in the color, design, graphics or any other component to create a unique layout.
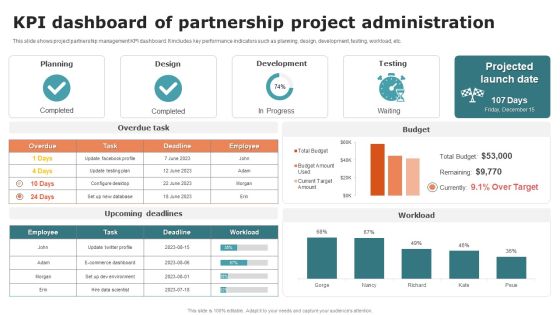
KPI Dashboard Of Partnership Project Administration Ideas PDF
This slide shows project partnership management KPI dashboard. It includes key performance indicators such as planning, design, development, testing, workload, etc. Showcasing this set of slides titled KPI Dashboard Of Partnership Project Administration Ideas PDF. The topics addressed in these templates are Planning, Design, Development. All the content presented in this PPT design is completely editable. Download it and make adjustments in color, background, font etc. as per your unique business setting.

Project Risk Management Progress KPI Dashboard Template PDF
This slide depicts project risk management progress dashboard. It provides information about key performance indicators, risks, issues, planned and actual hours spent, etc. Pitch your topic with ease and precision using this Project Risk Management Progress KPI Dashboard Template PDF. This layout presents information on Current Progress, Risk And Issues. It is also available for immediate download and adjustment. So, changes can be made in the color, design, graphics or any other component to create a unique layout.

KPI Dashboard Post Implementing Results Of Website Management Themes PDF
This slide depicts the key performance indicator dashboard post implementation of website maintenance. It covers information about top software updates, recent backups, site audits and log errors. Showcasing this set of slides titled KPI Dashboard Post Implementing Results Of Website Management Themes PDF. The topics addressed in these templates are Website Updates, Website Uptime, Connected Websites. All the content presented in this PPT design is completely editable. Download it and make adjustments in color, background, font etc. as per your unique business setting.
Plan Dashboard For Tracking Location Wise Revenue Diagrams PDF
This slide presents a dashboard which will assist managers to track the revenue of each branch having geographical presence in different corners of the world. The key performance indicators are total revenue, location wise rent, branch performance among many others.Pitch your topic with ease and precision using this Plan Dashboard For Tracking Location Wise Revenue Diagrams PDF. This layout presents information on Taxes Paid, Current Month, Branch Performance, Previous Quarter. It is also available for immediate download and adjustment. So, changes can be made in the color, design, graphics or any other component to create a unique layout.

Advertising And Marketing Campaign Strategy Success Communication Dashboard Inspiration PDF
This slide depicts a multi channel dashboard for tracking advertising and marketing campaign plan success which provides real time data to track the performance of marketing efforts. The various key performing indicators are cost, conversions and channel performance Showcasing this set of slides titled Advertising And Marketing Campaign Strategy Success Communication Dashboard Inspiration PDF. The topics addressed in these templates are Conversions, Spend, Channel. All the content presented in this PPT design is completely editable. Download it and make adjustments in color, background, font etc. as per your unique business setting.

Dashboard To Analyse Effectiveness Of Promotions Execution Plan Diagrams PDF
This slide depicts analysis dashboard for tracking marketing activities with implementations and continuously updates data so businesses can track the marketing effectiveness. The various key performing indicators are cost, conversions and channel performance. Showcasing this set of slides titled Dashboard To Analyse Effectiveness Of Promotions Execution Plan Diagrams PDF. The topics addressed in these templates are Channel Performance, Cost, Conversions. All the content presented in this PPT design is completely editable. Download it and make adjustments in color, background, font etc. as per your unique business setting.
 Home
Home