Kpi Comparison
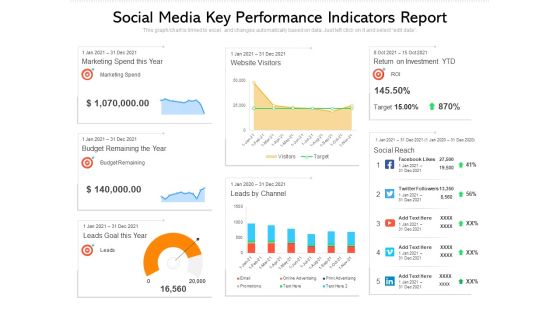
Social Media Key Performance Indicators Report Ppt PowerPoint Presentation Pictures Example File PDF
Pitch your topic with ease and precision using this social media key performance indicators report ppt powerpoint presentation pictures example file pdf. This layout presents information on social media key performance indicators report. It is also available for immediate download and adjustment. So, changes can be made in the color, design, graphics or any other component to create a unique layout.
Key Performance Indicators For IT Strategy Ppt Icon Slide Download PDF
Pitch your topic with ease and precision using this key performance indicators for it strategy ppt icon slide download pdf. This layout presents information on key performance indicators, goals, network program. It is also available for immediate download and adjustment. So, changes can be made in the color, design, graphics or any other component to create a unique layout.

Partnership Marketing Plan With Key Performance Indicators Ppt PowerPoint Presentation File Rules PDF
Pitch your topic with ease and precision using this partnership marketing plan with key performance indicators ppt powerpoint presentation file rules pdf. This layout presents information on performance, goals, initiatives. It is also available for immediate download and adjustment. So, changes can be made in the color, design, graphics or any other component to create a unique layout.
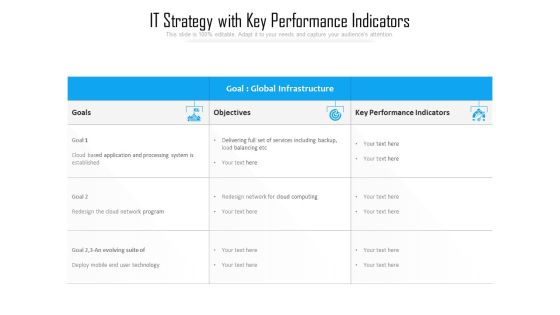
IT Strategy With Key Performance Indicators Ppt PowerPoint Presentation Gallery Example Introduction PDF
Pitch your topic with ease and precision using this it strategy with key performance indicators ppt powerpoint presentation gallery example introduction pdf. This layout presents information on goals, objectives, performance. It is also available for immediate download and adjustment. So, changes can be made in the color, design, graphics or any other component to create a unique layout.

Real Estate Business Sales Pipeline With Performance Indicators Background PDF
This slide showcases a sales funnel for real estate company to generate and acquire leads and maximize business profitability. It includes key components such as lead enters funnel, lead qualification, newsletter signup, schedule showing, negotiation, close, real estate deal won, etc. Presenting Real Estate Business Sales Pipeline With Performance Indicators Background PDF to dispense important information. This template comprises eight stages. It also presents valuable insights into the topics including Budget Preference, Newsletter Signup, Real Estate Deal Won. This is a completely customizable PowerPoint theme that can be put to use immediately. So, download it and address the topic impactfully.
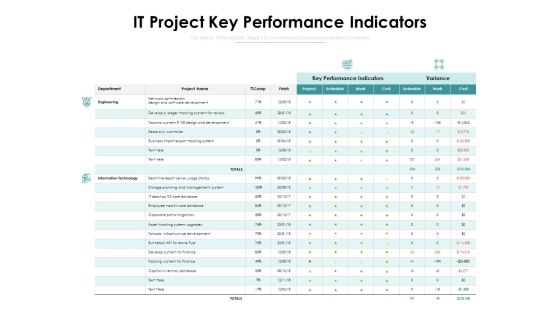
IT Project Key Performance Indicators Ppt PowerPoint Presentation File Introduction PDF
Pitch your topic with ease and precision using this it project key performance indicators ppt powerpoint presentation file introduction pdf. This layout presents information on engineering, technology, develop. It is also available for immediate download and adjustment. So, changes can be made in the color, design, graphics or any other component to create a unique layout.

Human Resource Key Performance Indicators Ppt PowerPoint Presentation Gallery Introduction PDF
Pitch your topic with ease and precision using this human resource key performance indicators ppt powerpoint presentation gallery introduction pdf. This layout presents information on training, cost, occupation. It is also available for immediate download and adjustment. So, changes can be made in the color, design, graphics or any other component to create a unique layout.
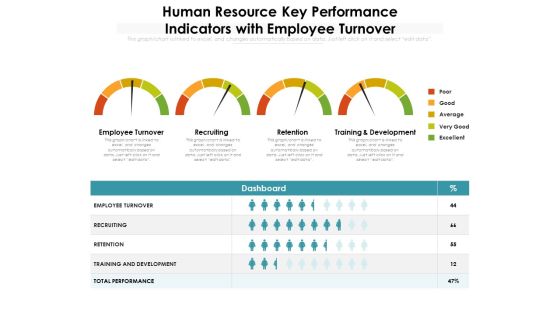
Human Resource Key Performance Indicators With Employee Turnover Ppt PowerPoint Presentation Gallery Good PDF
Pitch your topic with ease and precision using this human resource key performance indicators with employee turnover ppt powerpoint presentation gallery good pdf. This layout presents information on training, development, retention. It is also available for immediate download and adjustment. So, changes can be made in the color, design, graphics or any other component to create a unique layout.

Key Performance Indicator For Sales And Marketing Business Plan Review Brochure PDF
The following slide showcases components of various department to track record and make further improvement plans. The key departments covered are marketing, sales and workforce and their status and owner. Pitch your topic with ease and precision using this Key Performance Indicator For Sales And Marketing Business Plan Review Brochure PDF. This layout presents information on Marketing, Sales, Workforce. It is also available for immediate download and adjustment. So, changes can be made in the color, design, graphics or any other component to create a unique layout.
Multiple Project Progress Tracking Report Dashboard With Key Performance Indicators Brochure PDF
This slide shows the dashboard representing status of various projects and tracking their performance with the help of key performance indicators which are as follows schedule, budget, resources, risk and issues and quality of projects.Pitch your topic with ease and precision using this Multiple Project Progress Tracking Report Dashboard With Key Performance Indicators Brochure PDF. This layout presents information on Risks Issues, Quality Open Defects, Techno Blogger. It is also available for immediate download and adjustment. So, changes can be made in the color, design, graphics or any other component to create a unique layout.

Employee Risk Key Performance Indicator Dashboard With Case Incident Rate Ppt Professional Information PDF
The following slide highlights the employee safety key performance indicator dashboard with case incident rate illustrating total case occurrence rate, last reported case, days without reported, causing items, corrective actions, incident pyramid, incident by month and major causes. Pitch your topic with ease and precision using this Employee Risk Key Performance Indicator Dashboard With Case Incident Rate Ppt Professional Information PDF. This layout presents information on Total Case, Incident Rate, Last Incident Reported, Incident Causing Items. It is also available for immediate download and adjustment. So, changes can be made in the color, design, graphics or any other component to create a unique layout.

Patient Health And Risk Key Performance Indicator Dashboard Ppt Infographic Template Summary PDF
The following slide highlights the patient health and safety key performance indicator dashboard illustrating admission by department, admission by cost, patient satisfaction, total patients, operations cost, patient density, total staff, waiting time, treatment satisfaction and treatment confidence. Pitch your topic with ease and precision using this Patient Health And Risk Key Performance Indicator Dashboard Ppt Infographic Template Summary PDF. This layout presents information on Admission By Department, Admission Vs Cost, Patient Satisfaction. It is also available for immediate download and adjustment. So, changes can be made in the color, design, graphics or any other component to create a unique layout.

Risk Key Performance Indicator Dashboard For Manufacturing Company Ppt Gallery Graphics Design PDF
The following slide highlights the safety key performance indicator dashboard for manufacturing company. It showcases safety incident per employee, total number of cases, safety events avoided, accumulated total and safety incidents. Pitch your topic with ease and precision using this Risk Key Performance Indicator Dashboard For Manufacturing Company Ppt Gallery Graphics Design PDF. This layout presents information on Safety Incidents, Safety Incident Avoided, Safety Incident Accumulated. It is also available for immediate download and adjustment. So, changes can be made in the color, design, graphics or any other component to create a unique layout.
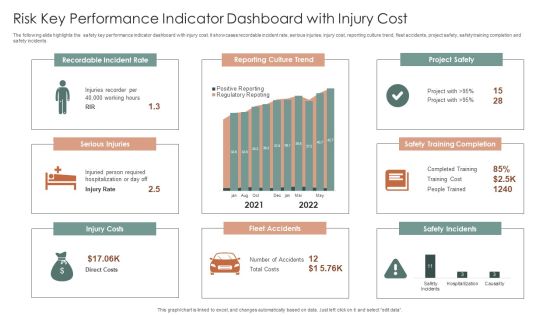
Risk Key Performance Indicator Dashboard With Injury Cost Ppt Summary Brochure PDF
The following slide highlights the safety key performance indicator dashboard with injury cost. It showcases recordable incident rate, serious injuries, injury cost, reporting culture trend, fleet accidents, project safety, safety training completion and safety incidents. Pitch your topic with ease and precision using this Risk Key Performance Indicator Dashboard With Injury Cost Ppt Summary Brochure PDF. This layout presents information on Recordable Incident Rate, Reporting Culture Trend, Project Safety. It is also available for immediate download and adjustment. So, changes can be made in the color, design, graphics or any other component to create a unique layout.
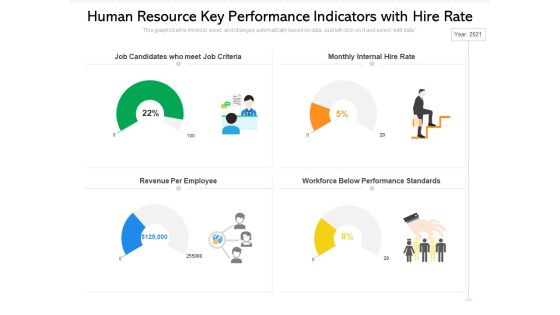
Human Resource Key Performance Indicators With Hire Rate Ppt PowerPoint Presentation Summary Examples PDF
Pitch your topic with ease and precision using this human resource key performance indicators with hire rate ppt powerpoint presentation summary examples pdf. This layout presents information on job candidates who meet job criteria, monthly internal hire rate, revenue per employee. It is also available for immediate download and adjustment. So, changes can be made in the color, design, graphics or any other component to create a unique layout.
Five Different Types Of Calculate Facebook Key Performance Indicator Results Icons PDF
Pitch your topic with ease and precision using this five different types of calculate facebook key performance indicator results icons pdf. This layout presents information on reach kpis, traffic kpis, engagement kpis, conversions kpis, brand awareness kpis. It is also available for immediate download and adjustment. So, changes can be made in the color, design, graphics or any other component to create a unique layout.
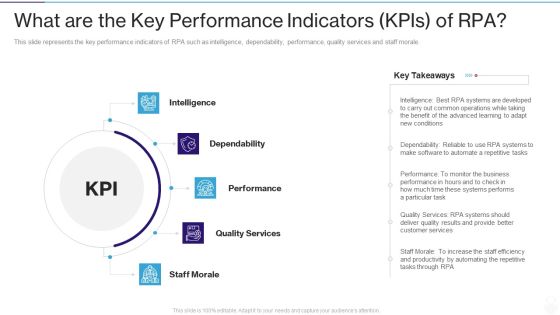
RPA IT What Are The Key Performance Indicators Kpis Of RPA Ppt Professional Design Templates PDF
This slide represents the key performance indicators of RPA such as intelligence, dependability, performance, quality services and staff morale. This is a rpa it what are the key performance indicators kpis of rpa ppt professional design templates pdf template with various stages. Focus and dispense information on five stages using this creative set, that comes with editable features. It contains large content boxes to add your information on topics like staff morale, quality services, performance, dependability, intelligence. You can also showcase facts, figures, and other relevant content using this PPT layout. Grab it now.
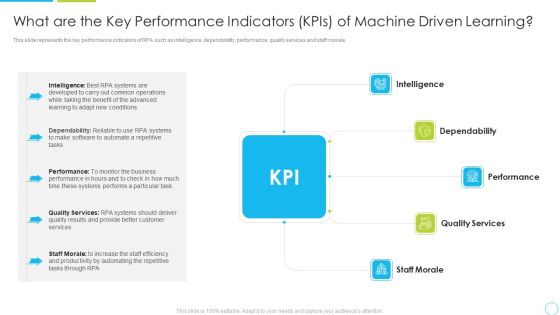
What Are The Key Performance Indicators Kpis Of Machine Driven Learning Ppt Styles Slideshow PDF
This slide represents the key performance indicators of RPA such as intelligence, dependability, performance, quality services and staff morale. This is a what are the key performance indicators kpis of machine driven learning ppt styles slideshow pdf template with various stages. Focus and dispense information on five stages using this creative set, that comes with editable features. It contains large content boxes to add your information on topics like dependability, intelligence, performance, quality services, staff morale. You can also showcase facts, figures, and other relevant content using this PPT layout. Grab it now.
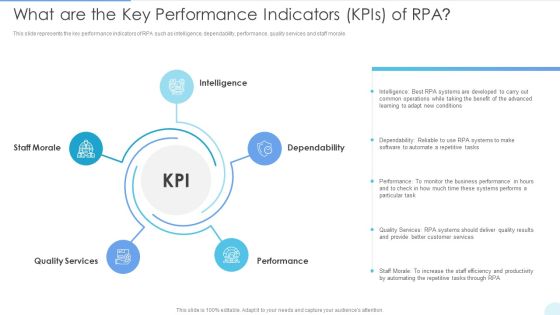
What Are The Key Performance Indicators Kpis Of RPA Structure PDF
This slide represents the key performance indicators of RPA such as intelligence, dependability, performance, quality services and staff morale. This is a What Are The Key Performance Indicators Kpis Of RPA Structure PDF template with various stages. Focus and dispense information on five stages using this creative set, that comes with editable features. It contains large content boxes to add your information on topics like Dependability, Performance, Quality Services. You can also showcase facts, figures, and other relevant content using this PPT layout. Grab it now.

What Are The Key Performance Indicators Kpis Of RPA Robotic Process Automation Technology Graphics PDF
This slide represents the key performance indicators of RPA such as intelligence, dependability, performance, quality services and staff morale.This is a What Are The Key Performance Indicators Kpis Of RPA Robotic Process Automation Technology Graphics PDF template with various stages. Focus and dispense information on five stages using this creative set, that comes with editable features. It contains large content boxes to add your information on topics like Dependability, Intelligence, Quality Services. You can also showcase facts, figures, and other relevant content using this PPT layout. Grab it now.

Classified Data Memo Record With Strategic Goals Key Performance Indicators Of The Company Guidelines PDF
This slide provides information about the key performance indicators of the company for 5 years in terms of turnover, gross profit, operating profit margin etc. This is a classified data memo record with strategic goals key performance indicators of the company guidelines pdf template with various stages. Focus and dispense information on five stages using this creative set, that comes with editable features. It contains large content boxes to add your information on topics like turnover, gross profit, gross profit margin, operating profit, operating profit margin. You can also showcase facts, figures, and other relevant content using this PPT layout. Grab it now.
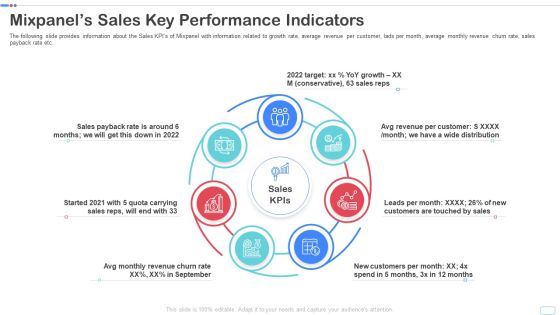
Mixpanel Capital Raising Pitch Deck Mixpanels Sales Key Performance Indicators Clipart PDF
The following slide provides information about the Sales KPIs of Mixpanel with information related to growth rate, average revenue per customer, lads per month, average monthly revenue churn rate, sales payback rate etc. This is a mixpanel capital raising pitch deck mixpanels sales key performance indicators clipart pdf template with various stages. Focus and dispense information on seven stages using this creative set, that comes with editable features. It contains large content boxes to add your information on topics like mixpanels sales key performance indicators. You can also showcase facts, figures, and other relevant content using this PPT layout. Grab it now.

Marketing Strategy For Shipping Business Key Performance Indicator Dashboard Graphics PDF
The following slide depicts the key areas in Marketing Strategy for Shipping Business to monitor and optimize supply chain processes. It includes elements such as fleet and shipment status, country wise revenue, location wise delivery, average shipment time etc.Pitch your topic with ease and precision using this Marketing Strategy For Shipping Business Key Performance Indicator Dashboard Graphics PDF. This layout presents information on Shipment Status, Average Shipment, Wise Revenue. It is also available for immediate download and adjustment. So, changes can be made in the color, design, graphics or any other component to create a unique layout.
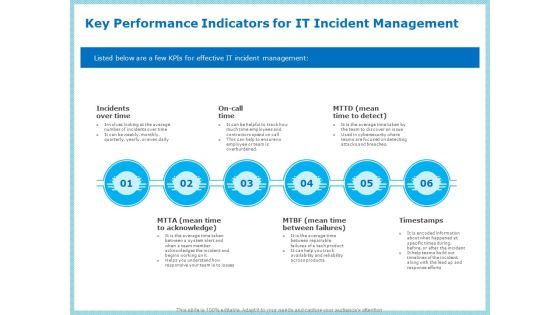
IT Infrastructure Library Incident Handling Procedure Key Performance Indicators For IT Incident Management Professional PDF
This is a it infrastructure library incident handling procedure key performance indicators for it incident management professional pdf template with various stages. Focus and dispense information on six stages using this creative set, that comes with editable features. It contains large content boxes to add your information on topics like incidents over time, timestamps, mean time to detect, on call time. You can also showcase facts, figures, and other relevant content using this PPT layout. Grab it now.
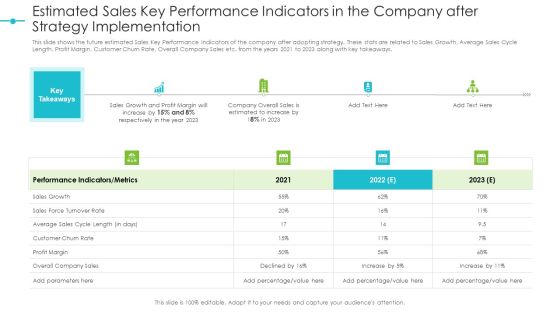
Estimated Sales Key Performance Indicators In The Company After Strategy Implementation Structure PDF
This slide shows the future estimated Sales Key Performance Indicators of the company after adopting strategy. These stats are related to Sales Growth, Average Sales Cycle Length, Profit Margin, Customer Churn Rate, Overall Company Sales etc. from the years 2021 to 2023 along with key takeaways. This is a estimated sales key performance indicators in the company after strategy implementation structure pdf template with various stages. Focus and dispense information on four stages using this creative set, that comes with editable features. It contains large content boxes to add your information on topics like performance, sales, growth, profit margin. You can also showcase facts, figures, and other relevant content using this PPT layout. Grab it now.
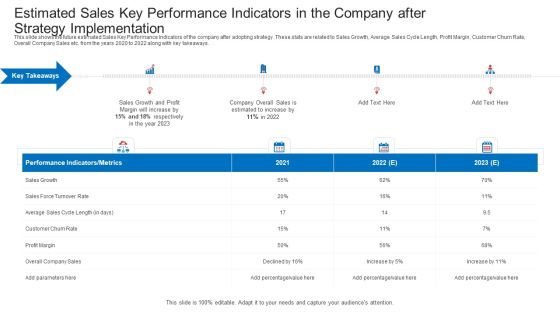
Estimated Sales Key Performance Indicators In The Company After Strategy Implementation Information PDF
This slide shows the future estimated Sales Key Performance Indicators of the company after adopting strategy. These stats are related to Sales Growth, Average Sales Cycle Length, Profit Margin, Customer Churn Rate, Overall Company Sales etc. from the years 2021 to 2023 along with key takeaways. This is a estimated sales key performance indicators in the company after strategy implementation information pdf template with various stages. Focus and dispense information on four stages using this creative set, that comes with editable features. It contains large content boxes to add your information on topics like performance, sales, growth, profit margin. You can also showcase facts, figures, and other relevant content using this PPT layout. Grab it now.
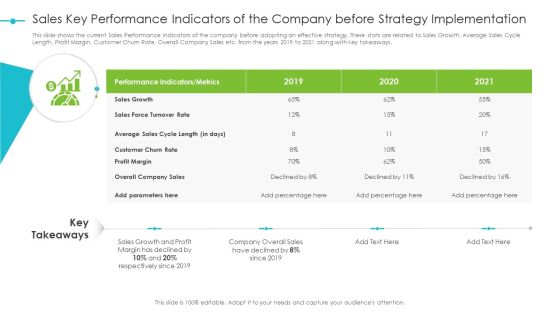
Tools For Improving Sales Plan Effectiveness Sales Key Performance Indicators Of The Company Before Strategy Implementation Topics PDF
This slide shows the current Sales Performance Indicators of the company before adopting an effective strategy. These stats are related to Sales Growth, Average Sales Cycle Length, Profit Margin, Customer Churn Rate, Overall Company Sales etc. from the years 2019 to 2021 along with key takeaways. Deliver and pitch your topic in the best possible manner with this tools for improving sales plan effectiveness sales key performance indicators of the company before strategy implementation topics pdf. Use them to share invaluable insights on sales, growth, profit margin, performance and impress your audience. This template can be altered and modified as per your expectations. So, grab it now.

Strategic Plan To Increase Sales Volume And Revenue Sales Key Performance Indicators Of The Company Before Strategy Implementation Download PDF
This slide shows the current Sales Performance Indicators of the company before adopting an effective strategy. These stats are related to Sales Growth, Average Sales Cycle Length, Profit Margin, Customer Churn Rate, Overall Company Sales etc. from the years 2019 to 2021 along with key takeaways. Deliver and pitch your topic in the best possible manner with this strategic plan to increase sales volume and revenue sales key performance indicators of the company before strategy implementation download pdf. Use them to share invaluable insights on sales, growth, profit margin, performance and impress your audience. This template can be altered and modified as per your expectations. So, grab it now.

Employee Key Performance Indicators Ppt PowerPoint Presentation Complete Deck With Slides
Boost your confidence and team morale with this well-structured Employee Key Performance Indicators Ppt PowerPoint Presentation Complete Deck With Slides This prefabricated set gives a voice to your presentation because of its well-researched content and graphics. Our experts have added all the components very carefully, thus helping you deliver great presentations with a single click. Not only that, it contains a set of eighteen slides that are designed using the right visuals, graphics, etc. Various topics can be discussed, and effective brainstorming sessions can be conducted using the wide variety of slides added in this complete deck. Apart from this, our PPT design contains clear instructions to help you restructure your presentations and create multiple variations. The color, format, design anything can be modified as deemed fit by the user. Not only this, it is available for immediate download. So, grab it now.

Risk Key Performance Indicator Dashboard Ppt PowerPoint Presentation Complete Deck With Slides
Boost your confidence and team morale with this well-structured Risk Key Performance Indicator Dashboard Ppt PowerPoint Presentation Complete Deck With Slides. This prefabricated set gives a voice to your presentation because of its well-researched content and graphics. Our experts have added all the components very carefully, thus helping you deliver great presentations with a single click. Not only that, it contains a set of sixteen slides that are designed using the right visuals, graphics, etc. Various topics can be discussed, and effective brainstorming sessions can be conducted using the wide variety of slides added in this complete deck. Apart from this, our PPT design contains clear instructions to help you restructure your presentations and create multiple variations. The color, format, design anything can be modified as deemed fit by the user. Not only this, it is available for immediate download. So, grab it now.

Key Performance Indicator Tree Variable Revenue Ppt PowerPoint Presentation Complete Deck With Slides
This key performance indicator tree variable revenue ppt powerpoint presentation complete deck with slides acts as backup support for your ideas, vision, thoughts, etc. Use it to present a thorough understanding of the topic. This PPT slideshow can be utilized for both in-house and outside presentations depending upon your needs and business demands. Entailing twelve slides with a consistent design and theme, this template will make a solid use case. As it is intuitively designed, it suits every business vertical and industry. All you have to do is make a few tweaks in the content or any other component to design unique presentations. The biggest advantage of this complete deck is that it can be personalized multiple times once downloaded. The color, design, shapes, and other elements are free to modify to add personal touches. You can also insert your logo design in this PPT layout. Therefore a well-thought and crafted presentation can be delivered with ease and precision by downloading this key performance indicator tree variable revenue ppt powerpoint presentation complete deck with slides PPT slideshow.
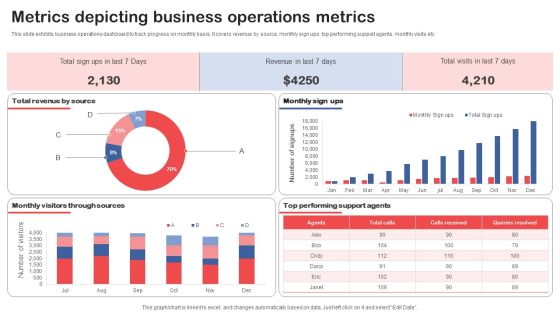
Metrics Depicting Business Operations Metrics Diagrams PDF
Pitch your topic with ease and precision using this Metrics Depicting Business Operations Metrics Diagrams PDF. This layout presents information on Metrics Depicting, Business, Operations Metrics. It is also available for immediate download and adjustment. So, changes can be made in the color, design, graphics or any other component to create a unique layout.

Calculate Facebook Key Performance Indicator Ppt PowerPoint Presentation Complete Deck With Slides
This complete deck acts as a great communication tool. It helps you in conveying your business message with personalized sets of graphics, icons etc. Comprising a set of eleven slides, this complete deck can help you persuade your audience. It also induces strategic thinking as it has been thoroughly researched and put together by our experts. Not only is it easily downloadable but also editable. The color, graphics, theme any component can be altered to fit your individual needs. So grab it now.
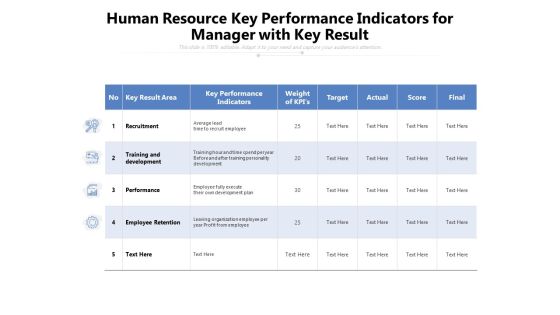
Human Resource Key Performance Indicators For Manager With Key Result Ppt PowerPoint Presentation File Graphics Tutorials PDF
Pitch your topic with ease and precision using this human resource key performance indicators for manager with key result ppt powerpoint presentation file graphics tutorials pdf. This layout presents information on training, development, performance. It is also available for immediate download and adjustment. So, changes can be made in the color, design, graphics or any other component to create a unique layout.

Advance IT Service Delivery Methods To Drive Key Performance Indicators Related Business Results Complete Deck
This complete deck acts as a great communication tool. It helps you in conveying your business message with personalized sets of graphics, icons etc. Comprising a set of fifty six slides, this complete deck can help you persuade your audience. It also induces strategic thinking as it has been thoroughly researched and put together by our experts. Not only is it easily downloadable but also editable. The color, graphics, theme any component can be altered to fit your individual needs. So grab it now.

Pyramid Showing Key Performance Indicators For IT Department Performance Evaluation Ppt PowerPoint Presentation Show Graphics Design PDF
Persuade your audience using this pyramid showing key performance indicators for it department performance evaluation ppt powerpoint presentation show graphics design pdf. This PPT design covers five stages, thus making it a great tool to use. It also caters to a variety of topics including it roi, team attrition rate, server downtime, number of new features developed, number of projects completed. Download this PPT design now to present a convincing pitch that not only emphasizes the topic but also showcases your presentation skills.

Metrics To Measure Business Performance Agenda Ppt Layouts Graphic Images PDF
This is a Metrics To Measure Business Performance Agenda Ppt Layouts Graphic Images PDF template with various stages. Focus and dispense information on three stages using this creative set, that comes with editable features. It contains large content boxes to add your information on topics like Key Performance Indicators, Financial Profitability, Customer Satisfaction. You can also showcase facts, figures, and other relevant content using this PPT layout. Grab it now.

Case Competition Reduction In Existing Customer Of Telecommunication Company Key Performance Indicators Ppt Layouts Graphics Pictures PDF
This is a case competition reduction in existing customer of telecommunication company key performance indicators ppt layouts graphics pictures pdf template with various stages. Focus and dispense information on seven stages using this creative set, that comes with editable features. It contains large content boxes to add your information on topics like key performance indicator, subscribers, technology users, average revenue, customer satisfaction level . You can also showcase facts, figures, and other relevant content using this PPT layout. Grab it now.

B2B Digital Marketing Program With Key Metrics Ppt Slides Sample PDF
This slide represents the plan for b2b marketing. It includes details related to objectives, substantiation, strategies and tactics to achieve goals and key performance indicators. Pitch your topic with ease and precision using this B2B Digital Marketing Program With Key Metrics Ppt Slides Sample PDF. This layout presents information on Objectives, Substantiation, Achieve Goals. It is also available for immediate download and adjustment. So, changes can be made in the color, design, graphics or any other component to create a unique layout.
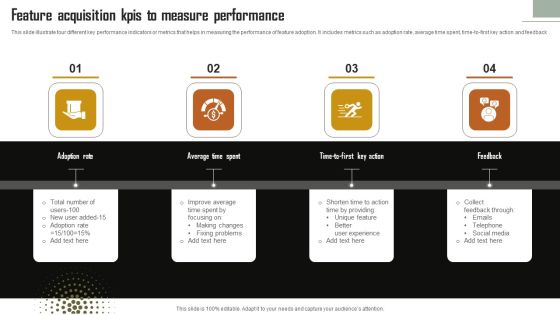
Feature Acquisition Kpis To Measure Performance Themes PDF
This slide illustrate four different key performance indicators or metrics that helps in measuring the performance of feature adoption. It includes metrics such as adoption rate, average time spent, time-to-first key action and feedback. Persuade your audience using this Feature Acquisition Kpis To Measure Performance Themes PDF. This PPT design covers four stages, thus making it a great tool to use. It also caters to a variety of topics including Adoption Rate, Average Time Spent, Feedback. Download this PPT design now to present a convincing pitch that not only emphasizes the topic but also showcases your presentation skills.

Project Metrics Dashboard With Responsibilities Graphics PDF
This slide focuses on project management dashboard which shows the number of projects, types of objects, key performance indicators, viewpoints, overall project status with actions and progress, responsibilities with linked object types and actions, etc. Pitch your topic with ease and precision using this Project Metrics Dashboard With Responsibilities Graphics PDF. This layout presents information on Project Metrics, Dashboard With Responsibilities. It is also available for immediate download and adjustment. So, changes can be made in the color, design, graphics or any other component to create a unique layout.

Return On Equity Indicators To Measure Company Financial Performance Mockup PDF
This slide showcases a graph of return on equity that represents how well the firm can manage the capital invested by shareholders. Pitch your topic with ease and precision using this Return On Equity Indicators To Measure Company Financial Performance Mockup PDF. This layout presents information on Return On Equity, Key Insights, Positive Return. It is also available for immediate download and adjustment. So, changes can be made in the color, design, graphics or any other component to create a unique layout.
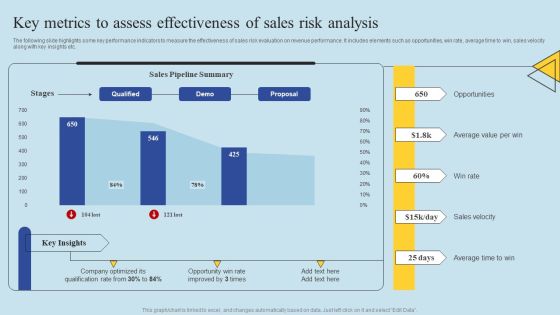
Determining Risks In Sales Administration Procedure Key Metrics To Assess Effectiveness Of Sales Pictures PDF
The following slide highlights some key performance indicators to measure the effectiveness of sales risk evaluation on revenue performance. It includes elements such as opportunities, win rate, average time to win, sales velocity along with key insights etc. This Determining Risks In Sales Administration Procedure Key Metrics To Assess Effectiveness Of Sales Pictures PDF from Slidegeeks makes it easy to present information on your topic with precision. It provides customization options, so you can make changes to the colors, design, graphics, or any other component to create a unique layout. It is also available for immediate download, so you can begin using it right away. Slidegeeks has done good research to ensure that you have everything you need to make your presentation stand out. Make a name out there for a brilliant performance.

Key Metrics To Measure Success Of Email Marketing Campaign Demonstration PDF
The following slide outlines multiple metrics that can assist realtors in highlighting email marketing campaign performance. The key performance indicators KPIs outlined in slide are open rate, click-through rate CTR, customer conversion rate, bounce rate, unsubscribe rate, return on investment ROI, etc. Presenting this PowerPoint presentation, titled Key Metrics To Measure Success Of Email Marketing Campaign Demonstration PDF, with topics curated by our researchers after extensive research. This editable presentation is available for immediate download and provides attractive features when used. Download now and captivate your audience. Presenting this Key Metrics To Measure Success Of Email Marketing Campaign Demonstration PDF. Our researchers have carefully researched and created these slides with all aspects taken into consideration. This is a completely customizable Key Metrics To Measure Success Of Email Marketing Campaign Demonstration PDF that is available for immediate downloading. Download now and make an impact on your audience. Highlight the attractive features available with our PPTs.
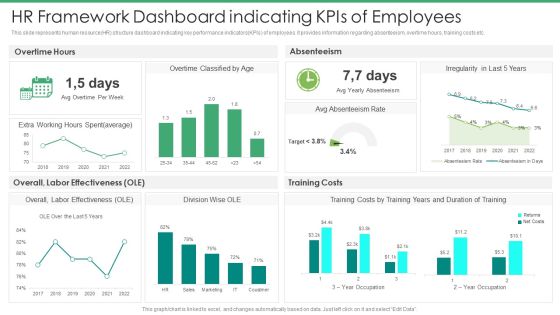
HR Framework Dashboard Indicating Kpis Of Employees Introduction PDF
This slide represents human resource HR structure dashboard indicating key performance indicators KPIs of employees. it provides information regarding absenteeism, overtime hours, training costs etc.Pitch your topic with ease and precision using this HR Framework Dashboard Indicating Kpis Of Employees Introduction PDF. This layout presents information on Absenteeism Rate, Costs, Average. It is also available for immediate download and adjustment. So, changes can be made in the color, design, graphics or any other component to create a unique layout.
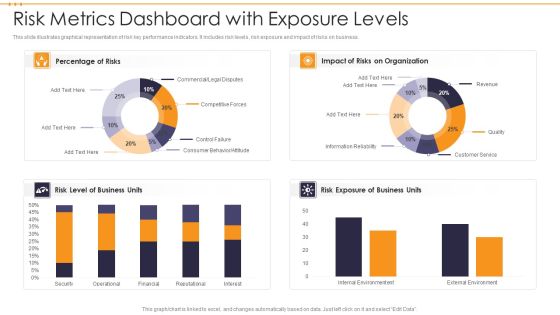
Risk Metrics Dashboard With Exposure Levels Template PDF
This slide illustrates graphical representation of risk key performance indicators. It includes risk levels, risk exposure and impact of risks on business. Pitch your topic with ease and precision using this Risk Metrics Dashboard With Exposure Levels Template PDF. This layout presents information on Risk Metrics Dashboard With Exposure Levels. It is also available for immediate download and adjustment. So, changes can be made in the color, design, graphics or any other component to create a unique layout.
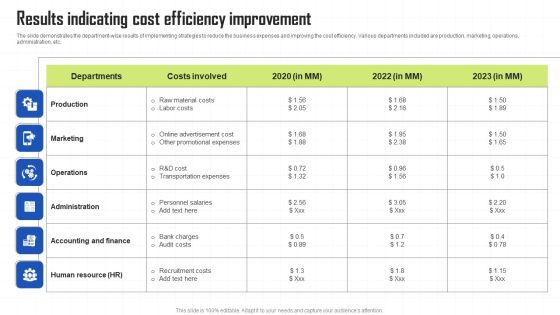
Key Techniques To Enhance Cost Efficiency Results Indicating Cost Efficiency Improvement Sample PDF
The slide demonstrates the department wise results of implementing strategies to reduce the business expenses and improving the cost efficiency. Various departments included are production, marketing, operations, administration, etc. This Key Techniques To Enhance Cost Efficiency Results Indicating Cost Efficiency Improvement Sample PDF from Slidegeeks makes it easy to present information on your topic with precision. It provides customization options, so you can make changes to the colors, design, graphics, or any other component to create a unique layout. It is also available for immediate download, so you can begin using it right away. Slidegeeks has done good research to ensure that you have everything you need to make your presentation stand out. Make a name out there for a brilliant performance.

Corporate Earnings And Risk Metrics Dashboard Guidelines PDF
This slide illustrates graphical representation of risk key performance indicators. It includes financial risks, operational risk and risk expenditure etc. Pitch your topic with ease and precision using this Corporate Earnings And Risk Metrics Dashboard Guidelines PDF. This layout presents information on Financial Risk, Operational Risk Expenditure. It is also available for immediate download and adjustment. So, changes can be made in the color, design, graphics or any other component to create a unique layout.
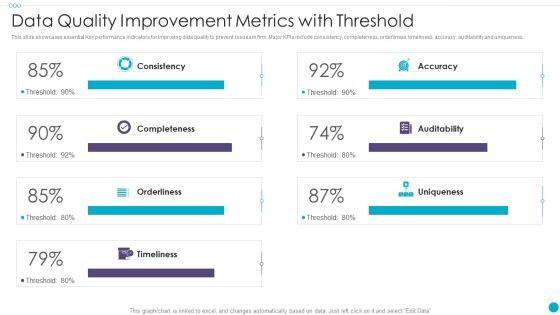
Data Quality Improvement Metrics With Threshold Formats PDF
This slide showcases essential Key performance indicators for improving data quality to prevent issues in firm. Major KPIs include consistency, completeness, orderliness, timeliness, accuracy, auditability and uniqueness. Pitch your topic with ease and precision using this Data Quality Improvement Metrics With Threshold Formats PDF This layout presents information on Auditability, Completeness, Consistency It is also available for immediate download and adjustment. So, changes can be made in the color, design, graphics or any other component to create a unique layout.
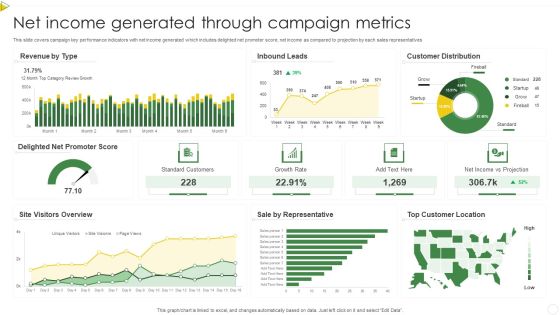
Net Income Generated Through Campaign Metrics Summary PDF
This slide covers campaign key performance indicators with net income generated which includes delighted net promoter score, net income as compared to projection by each sales representatives. Pitch your topic with ease and precision using this Net Income Generated Through Campaign Metrics Summary PDF. This layout presents information on Standard Customers, Growth Rate, Net Income. It is also available for immediate download and adjustment. So, changes can be made in the color, design, graphics or any other component to create a unique layout.
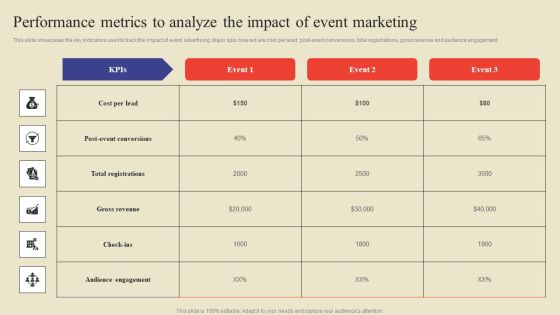
Performance Metrics To Analyze The Impact Of Event Marketing Ppt Professional Structure PDF
This slide showcases the key indicators used to track the impact of event advertising. Major kpis covered are cost per lead, post-event conversions, total registrations, gross revenue and audience engagement. This Performance Metrics To Analyze The Impact Of Event Marketing Ppt Professional Structure PDF from Slidegeeks makes it easy to present information on your topic with precision. It provides customization options, so you can make changes to the colors, design, graphics, or any other component to create a unique layout. It is also available for immediate download, so you can begin using it right away. Slidegeeks has done good research to ensure that you have everything you need to make your presentation stand out. Make a name out there for a brilliant performance.
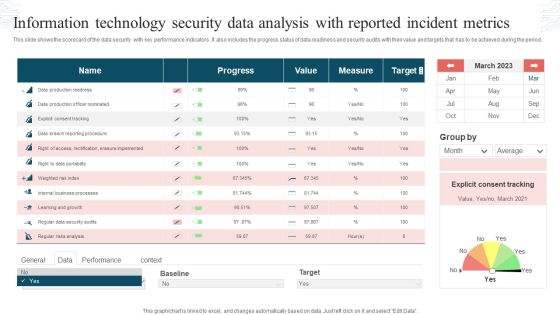
Information Technology Security Data Analysis With Reported Incident Metrics Rules PDF
This slide shows the scorecard of the data security with key performance indicators. It also includes the progress status of data readiness and security audits with their value and targets that has to be achieved during the period. Pitch your topic with ease and precision using this Information Technology Security Data Analysis With Reported Incident Metrics Rules PDF. This layout presents information on Progress, Value, Measure, Target. It is also available for immediate download and adjustment. So, changes can be made in the color, design, graphics or any other component to create a unique layout.
KPIs And Metrics To Measure Pharmaceutical Drug Of Pharmaceutical Company Icons PDF
Mentioned slide showcases various key performance indicators KPIs which can be used to measure the development of pharmaceutical companies in different years. The key metrics are productivity, competency, quality of care and financial. Showcasing this set of slides titled KPIs And Metrics To Measure Pharmaceutical Drug Of Pharmaceutical Company Icons PDF. The topics addressed in these templates are Productivity, Competency, Quality Of Care. All the content presented in this PPT design is completely editable. Download it and make adjustments in color, background, font etc. as per your unique business setting.

Application Project Portfolio Scorecard Scoring Metrics Information PDF
The slide showcases a project portfolio scorecard which help visualize and manage all of the projects in a portfolio, review portfolios progress and costs, make notes on the risks, and perform a cost-benefit analysis. includes a section for details about each project in the portfolio and categories include priority, status, planned versus actual costs, hours, and quality index rating. Showcasing this set of slides titled Application Project Portfolio Scorecard Scoring Metrics Information PDF. The topics addressed in these templates are Project Management Overview, Projects Key Performance Indicators, Additional Comments. All the content presented in this PPT design is completely editable. Download it and make adjustments in color, background, font etc. as per your unique business setting.

Metrics To Manage Company Cash Flow Ppt Model Gridlines PDF
This slide showcases key metrics used by organizations to manage cashflow. The key performance indicators included are days, receivable, inventory and payable outstanding. Pitch your topic with ease and precision using this Metrics To Manage Company Cash Flow Ppt Model Gridlines PDF. This layout presents information on Days Receivable Outstanding, Days Inventory Outstanding, Days Payable Outstanding. It is also available for immediate download and adjustment. So, changes can be made in the color, design, graphics or any other component to create a unique layout.

Current Vendor Management System Efficiency Indicators In The Company Microsoft PDF
This slide shows the current Vendor Management System Efficiency Indicators of the company that are compared for 3 years. Some indicators are Timely Order Fulfilment, Communication Time Lags, Delivery Lead Time, Vendor Availability, Supplier Risk etc. Deliver an awe-inspiring pitch with this creative current vendor management system efficiency indicators in the company microsoft pdf bundle. Topics like performance indicators, key takeaways can be discussed with this completely editable template. It is available for immediate download depending on the needs and requirements of the user.
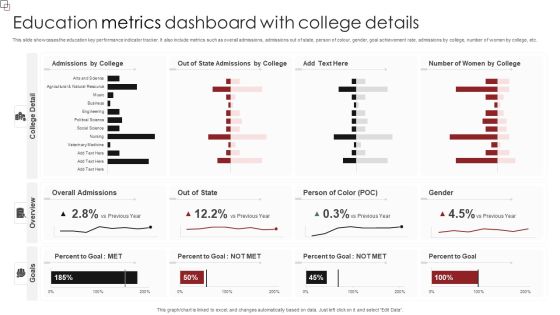
Education Metrics Dashboard With College Details Formats PDF
This slide showcases the education key performance indicator tracker. It also include metrics such as overall admissions, admissions out of state, person of colour, gender, goal achievement rate, admissions by college, number of women by college, etc. Pitch your topic with ease and precision using this Education Metrics Dashboard With College Details Formats PDF. This layout presents information on Overall Admissions, Person Of Color, Percent To Goal. It is also available for immediate download and adjustment. So, changes can be made in the color, design, graphics or any other component to create a unique layout.
Tracking Channel Campaign Metrics To Measure Web Traffic Sample PDF
This slide covers measuring campaign key performance indicators through tracking channel web traffic which includes total visit, cost per click, engagement rate and total impressions. Pitch your topic with ease and precision using this Tracking Channel Campaign Metrics To Measure Web Traffic Sample PDF. This layout presents information on Revenue By Channel, Website Demographics, Product Sales Trend. It is also available for immediate download and adjustment. So, changes can be made in the color, design, graphics or any other component to create a unique layout.
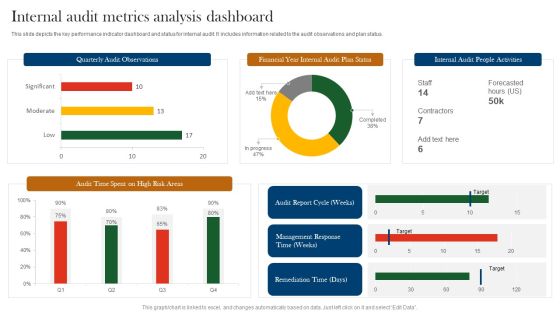
Internal Audit Metrics Analysis Dashboard Ppt Ideas Clipart Images PDF
This slide depicts the key performance indicator dashboard and status for internal audit. It includes information related to the audit observations and plan status. Pitch your topic with ease and precision using this Internal Audit Metrics Analysis Dashboard Ppt Ideas Clipart Images PDF. This layout presents information on Quarterly Audit Observations, Financial Year Internal, Audit Plan Status. It is also available for immediate download and adjustment. So, changes can be made in the color, design, graphics or any other component to create a unique layout.

Measuring Overall Health Of Company Using Customer Churn Metrics Formats PDF
Mentioned slide outlines different key performance indicators KPIs that will assist corporates to evaluate the success of customer churn prevention strategies. The major metrics covered in the slide are revenue growth rate, monthly active users MAU, net promoter score NPS, customer satisfaction score CSAT, and customer acquisition cost CAC. Are you searching for a Measuring Overall Health Of Company Using Customer Churn Metrics Formats PDF that is uncluttered, straightforward, and original Its easy to edit, and you can change the colors to suit your personal or business branding. For a presentation that expresses how much effort you have put in, this template is ideal. With all of its features, including tables, diagrams, statistics, and lists, its perfect for a business plan presentation. Make your ideas more appealing with these professional slides. Download Measuring Overall Health Of Company Using Customer Churn Metrics Formats PDF from Slidegeeks today.

 Home
Home