Kpi Comparison

Communication KPI Dashboard With KPI Comparison Ideas PDF
Pitch your topic with ease and precision using this Communication KPI Dashboard With KPI Comparison Ideas PDF This layout presents information on Increase In Brand, Employees Knowledge, Vision Statement It is also available for immediate download and adjustment. So, changes can be made in the color, design, graphics or any other component to create a unique layout.

Competitors Product KPI Comparison Scorecard Matrix With Attributes And Rating Topics PDF
This slide covers products compared on basis of different attributes for various competitors products. It includes market awareness, product quality, design, price, etc. Showcasing this set of slides titled Competitors Product KPI Comparison Scorecard Matrix With Attributes And Rating Topics PDF. The topics addressed in these templates are Product Quality, Product Design, Price. All the content presented in this PPT design is completely editable. Download it and make adjustments in color, background, font etc. as per your unique business setting.
Two Product KPI Attributes Comparison Scorecard Icon Formats PDF
Persuade your audience using this Two Product KPI Attributes Comparison Scorecard Icon Formats PDF. This PPT design covers four stages, thus making it a great tool to use. It also caters to a variety of topics including Product Kpi Attributes, Comparison Scorecard Icon. Download this PPT design now to present a convincing pitch that not only emphasizes the topic but also showcases your presentation skills.
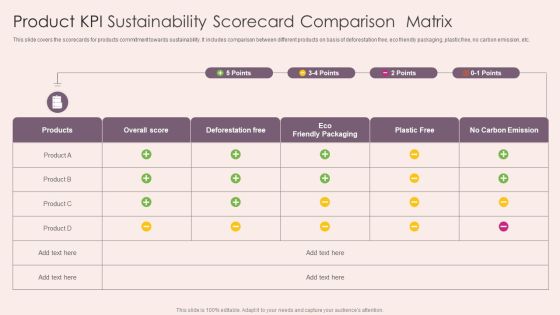
Product KPI Sustainability Scorecard Comparison Matrix Demonstration PDF
This slide covers the scorecards for products commitment towards sustainability. It includes comparison between different products on basis of deforestation free, eco friendly packaging, plastic free, no carbon emission, etc. Showcasing this set of slides titled Product KPI Sustainability Scorecard Comparison Matrix Demonstration PDF. The topics addressed in these templates are Product Kpi Sustainability, Scorecard Comparison Matrix. All the content presented in this PPT design is completely editable. Download it and make adjustments in color, background, font etc. as per your unique business setting.
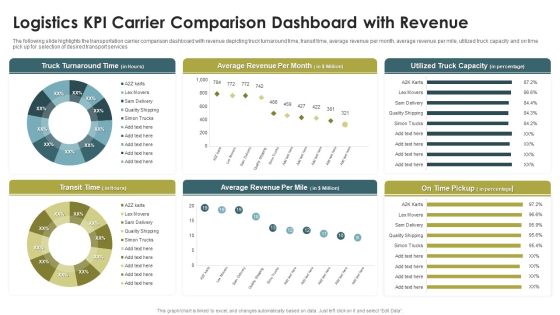
Logistics KPI Carrier Comparison Dashboard With Revenue Ppt Infographics Portfolio PDF
The following slide highlights the transportation carrier comparison dashboard with revenue depicting truck turnaround time, transit time, average revenue per month, average revenue per mile, utilized truck capacity and on time pick up for selection of desired transport services. Pitch your topic with ease and precision using this Logistics KPI Carrier Comparison Dashboard With Revenue Ppt Infographics Portfolio PDF. This layout presents information on Truck Turnaround Time, Average Revenue, Per Month, Transit Time. It is also available for immediate download and adjustment. So, changes can be made in the color, design, graphics or any other component to create a unique layout.

Catering Business Advertisement Plan KPI Dashboard With Revenue Comparison Icons PDF
This slide shows the KPI dashboard of the catering industry to evaluate the actual and potential targets. It includes KPIs such as expenditure, sales revenue, beverage, etc. Showcasing this set of slides titled Catering Business Advertisement Plan KPI Dashboard With Revenue Comparison Icons PDF. The topics addressed in these templates are Expenditure, Revenue Comparison, Department. All the content presented in this PPT design is completely editable. Download it and make adjustments in color, background, font etc. as per your unique business setting.

KPI Dashboard Of Customer And Product Sales Performance Comparison Information PDF
This slide shows the KPI dashboard of client and product sales comparison. It also includes sales by location and total sales. Pitch your topic with ease and precision using this KPI Dashboard Of Customer And Product Sales Performance Comparison Information PDF. This layout presents information on Product Sales, Client Sales, Tim Santana. It is also available for immediate download and adjustment. So, changes can be made in the color, design, graphics or any other component to create a unique layout.
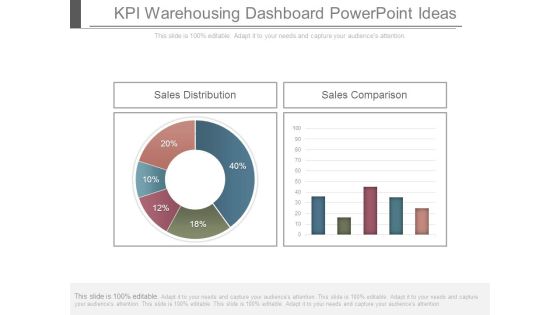
Kpi Warehousing Dashboard Powerpoint Ideas
This is a kpi warehousing dashboard powerpoint ideas. This is a two stage process. The stages in this process are sales distribution, sales comparison.
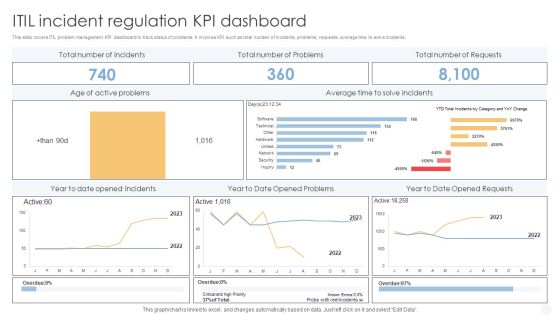
ITIL Incident Regulation Kpi Dashboard Background PDF
This slide covers ITIL problem management KPI dashboard to track status of problems. It involves KPI such as total number of incidents, problems, requests, average time to solve incidents.Pitch your topic with ease and precision using this ITIL Incident Regulation Kpi Dashboard Background PDF. This layout presents information on Active Problems, Average Incidents, Opened Problems. It is also available for immediate download and adjustment. So, changes can be made in the color, design, graphics or any other component to create a unique layout.
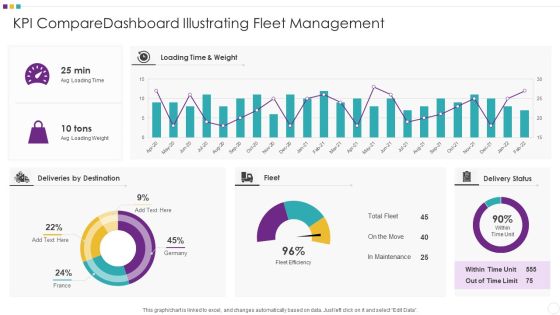
KPI Comparedashboard Illustrating Fleet Management Clipart PDF
Pitch your topic with ease and precision using this KPI Comparedashboard Illustrating Fleet Management Clipart PDF This layout presents information on KPI Comparedashboard Illustrating Fleet Management It is also available for immediate download and adjustment. So, changes can be made in the color, design, graphics or any other component to create a unique layout.
KPI Dashboard Of Client Support Icons PDF
This slide shows customer service delivery key performance indicators dashboard. It includes KPIs such as issues received, average time to close issues, first call resolution, top performers, etc. Pitch your topic with ease and precision using this KPI Dashboard Of Client Support Icons PDF. This layout presents information on KPI Dashboard, Client Support. It is also available for immediate download and adjustment. So, changes can be made in the color, design, graphics or any other component to create a unique layout.

Vehicle Management System KPI Dashboard Introduction PDF
This slide represents the dashboard showing real time data of fleet management to cut down operational costs and improve efficiency. It includes key metrics such as vehicles with errors, warnings, deviation from route, total vehicles, vehicles condition etc. Pitch your topic with ease and precision using this Vehicle Management System KPI Dashboard Introduction PDF. This layout presents information on Vehicle Management System, KPI Dashboard. It is also available for immediate download and adjustment. So, changes can be made in the color, design, graphics or any other component to create a unique layout.

Client Support KPI Dashboard Rules PDF
This slide shows key performance indicators of customer service delivery. It includes service level, request volume, cost of revenue, customer satisfaction, customer retention, etc. Pitch your topic with ease and precision using this Client Support KPI Dashboard Rules PDF. This layout presents information on Customer Retention, Cost Per Support, Average Issue Solving Time. It is also available for immediate download and adjustment. So, changes can be made in the color, design, graphics or any other component to create a unique layout.

Initial Funding Management Kpi Dashboard Rules PDF
The slide presents a dashboard for managing and tracking initial investment performance. It includes key components like total value, risk score, contribution, status, investments and percentages. Pitch your topic with ease and precision using this Initial Funding Management Kpi Dashboard Rules PDF. This layout presents information on Performance, Diversity, Expected Growth. It is also available for immediate download and adjustment. So, changes can be made in the color, design, graphics or any other component to create a unique layout.

KPI Dashboard Showcasing Product Management Guidelines PDF
This slide showcases dashboard providing product development team performance status with determined KPIs. It provides details such as product development team score, average result scores and result KPIs. Pitch your topic with ease and precision using this KPI Dashboard Showcasing Product Management Guidelines PDF. This layout presents information on Average Rating, Innovation, Design. It is also available for immediate download and adjustment. So, changes can be made in the color, design, graphics or any other component to create a unique layout.

KPI Dashboard Highlighting Business Problems Microsoft PDF
This slide depicts a dashboard which highlights the problems faced by organizations to easily track the issues and offer solutions for the same. The various key performance indicators in this dashboard are pain points by status, unresolved pain points for march 2023 etc. Showcasing this set of slides titled KPI Dashboard Highlighting Business Problems Microsoft PDF. The topics addressed in these templates are Unresolved Pain Points, Resolved Pain Points, Project Components. All the content presented in this PPT design is completely editable. Download it and make adjustments in color, background, font etc. as per your unique business setting.

Employee Recruitment Analysis KPI Dashboard Slides PDF
The following slide presents a hiring assessment dashboard to manage HR metrics. It includes KPIs such as average time taken, cost required in hiring process along with the major sources of recruitment etc. Pitch your topic with ease and precision using this Employee Recruitment Analysis KPI Dashboard Slides PDF. This layout presents information on Agile Hiring, Non Agile Hiring, Hiring Cost Assessment. It is also available for immediate download and adjustment. So, changes can be made in the color, design, graphics or any other component to create a unique layout.

Garment Production Quality KPI Dashboard Portrait PDF
The following slide shows dashboard that shows KPIs to measure garment manufacturing quality . Major KPIs covered are factory efficiency , quality to production, cut to ship ratio.Pitch your topic with ease and precision using this Garment Production Quality KPI Dashboard Portrait PDF This layout presents information on Production Downtime, Time Delivery Over The Quarters, Average Style Changeover Time It is also available for immediate download and adjustment. So, changes can be made in the color, design, graphics or any other component to create a unique layout.
Tracking Goals Alignment KPI Dashboard Guidelines PDF
This slide showcases a tracking dashboard for determining the alignment and progress percentage of the assigned objectives. It also includes the objective evaluation KPIs such as active objectives, overall progress, total employees, objective as per employees, aligned, organizational and departmental objectives. Pitch your topic with ease and precision using this Tracking Goals Alignment KPI Dashboard Guidelines PDF. This layout presents information on Employee, Organizational Objectives, Departmental Objectives. It is also available for immediate download and adjustment. So, changes can be made in the color, design, graphics or any other component to create a unique layout.

Retail Inventory Management Kpi Dashboard Rules PDF
This slide gives overview of inventory management in retail industry showcasing expected date of order placed for top selling item, sales return by product category, average inventory value in FY 2022 and purchase order summary. Pitch your topic with ease and precision using this Retail Inventory Management Kpi Dashboard Rules PDF. This layout presents information on Retail Inventory Management, Dashboard. It is also available for immediate download and adjustment. So, changes can be made in the color, design, graphics or any other component to create a unique layout.

Organization Demand Administration KPI Dashboard Designs PDF
The following slide represents some kpis to plan further sales and manufacturing processes. It includes elements such as total inventory cost, anticipated surplus stock, out of stock value, slow moving inventory value etc. Pitch your topic with ease and precision using this Organization Demand Administration KPI Dashboard Designs PDF. This layout presents information on Anticipated Surplus Stock, Out Of Stock, Slow Moving Inventory. It is also available for immediate download and adjustment. So, changes can be made in the color, design, graphics or any other component to create a unique layout.

SEO Content Review KPI Dashboard Summary PDF
The following slide highlights the KPAs of content strategy to determine keyword gaps and get quality traffic. It includes KPIs such as no. of pages crawled, content health status, basic web requirements, site user experience, major concerns etc. Pitch your topic with ease and precision using this SEO Content Review KPI Dashboard Summary PDF. This layout presents information on Fundamental Web Requirements, Needs Improvement. It is also available for immediate download and adjustment. So, changes can be made in the color, design, graphics or any other component to create a unique layout.
Project Error Tracking KPI Dashboard Themes PDF
This slide illustrates the dashboard for the project issue tracking and management. It includes the column chart for issues assignee, incomplete issues by priority and project, monthly percentage increase in issues created and closed, etc. Pitch your topic with ease and precision using this Project Error Tracking KPI Dashboard Themes PDF. This layout presents information on Issues Assignee, Issue Status, Incomplete Issues. It is also available for immediate download and adjustment. So, changes can be made in the color, design, graphics or any other component to create a unique layout.
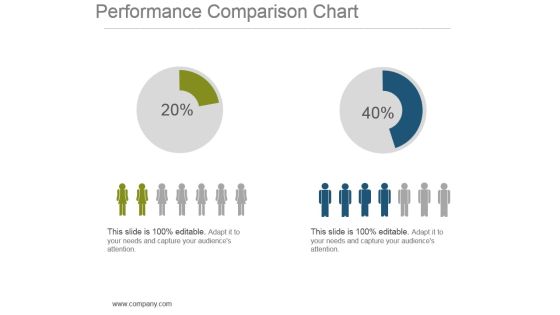
Performance Comparison Chart Powerpoint Show
This is a performance comparison chart powerpoint show. This is a two stage process. The stages in this process are finance, compare, strategy, management, planning.

Logistics KPI Status Dashboard With Monthly KPI Ppt Infographic Template Layout PDF
The following slide highlights the transportation status dashboard with monthly KPI illustrating order status with customer, order date and delivery date. It shows financial performance for four quarters as well as todays order, inventory and monthly KPI with Inventory, shipping cost for past 30 days. Pitch your topic with ease and precision using this Logistics KPI Status Dashboard With Monthly KPI Ppt Infographic Template Layout PDF. This layout presents information on Order Status, Today Order, Inventory, Monthly KPI. It is also available for immediate download and adjustment. So, changes can be made in the color, design, graphics or any other component to create a unique layout.

KPI Dashboard Highlighting Results Of Multichannel Retail Marketing Rules PDF
The purpose of this slide is to highlight a comprehensive dashboard of omnichannel retail. The key metrics covered in the slide are types of marketing channels, comparison of channels for two different years, transactions by months etc. Pitch your topic with ease and precision using this KPI Dashboard Highlighting Results Of Multichannel Retail Marketing Rules PDF. This layout presents information on Comparison Of Channel Sales, Percentage Of Sales, Transactions By Month. It is also available for immediate download and adjustment. So, changes can be made in the color, design, graphics or any other component to create a unique layout.

Commercial Marketing KPI With Accumulated Sales And Profit Portrait PDF
This slide template covers about key performing indicators like number of sales with revenue and profit generated in comparison with cost input and breakdown.Showcasing this set of slides titled Commercial Marketing KPI With Accumulated Sales And Profit Portrait PDF. The topics addressed in these templates are Cost Breakdown, Accumulated Revenue, Incremental Sales. All the content presented in this PPT design is completely editable. Download it and make adjustments in color, background, font etc. as per your unique business setting.

Product KPI Benefits And Operational Cost Scorecard Portrait PDF
This slide covers scorecard for product benefits in comparison with operational cost. It includes customer experience, affordability, convenient packaging, technical feasibility, etc. Pitch your topic with ease and precision using this Product KPI Benefits And Operational Cost Scorecard Portrait PDF. This layout presents information on Customer Experience, Technical Feasibility, Benefit. It is also available for immediate download and adjustment. So, changes can be made in the color, design, graphics or any other component to create a unique layout.

KPI Dashboard Of Projected Vs Actual Business Budget Pictures PDF
This slide shows the comparison between actual and Projected Budget dashboard of different departments. It includes sales, HR, marketing, research and development budget. Showcasing this set of slides titled KPI Dashboard Of Projected Vs Actual Business Budget Pictures PDF. The topics addressed in these templates are Marketing Budget, Development Budget, Sales Budget. All the content presented in this PPT design is completely editable. Download it and make adjustments in color, background, font etc. as per your unique business setting.

KPI Dashboard To Monitor Public Promotion Marketing Practices Template PDF
Mentioned slide demonstrates dashboard for tracking monthly public relations marketing practices to determine marketing department performance. It includes key components such as month press release for product, blogs and articles posts, social media channel uploads, etc. Pitch your topic with ease and precision using this KPI Dashboard To Monitor Public Promotion Marketing Practices Template PDF. This layout presents information on Paid Media, Owned Media, Total News Release, Comparison Graph. It is also available for immediate download and adjustment. So, changes can be made in the color, design, graphics or any other component to create a unique layout.

Sales Kpi Performance Summary Ppt PowerPoint Presentation Infographic Template Elements
This is a sales kpi performance summary ppt powerpoint presentation infographic template elements. This is a seven stage process. The stages in this process are revenue comparison, quantity comparison, product sales mix, regional sales mix, budget.
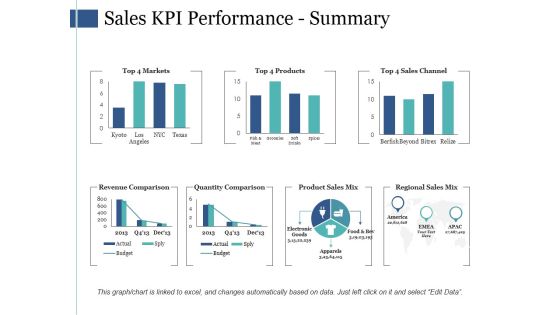
Sales Kpi Performance Summary Ppt PowerPoint Presentation Infographic Template Infographics
This is a sales kpi performance summary ppt powerpoint presentation infographic template infographics. This is a seven stage process. The stages in this process are revenue comparison, quantity comparison, product sales mix, regional sales mix.

Sales Kpi Performance Summary Ppt PowerPoint Presentation Ideas Graphics Template
This is a sales kpi performance summary ppt powerpoint presentation ideas graphics template. This is a seven stage process. The stages in this process are revenue comparison, quantity comparison, product sales mix, regional sales mix.
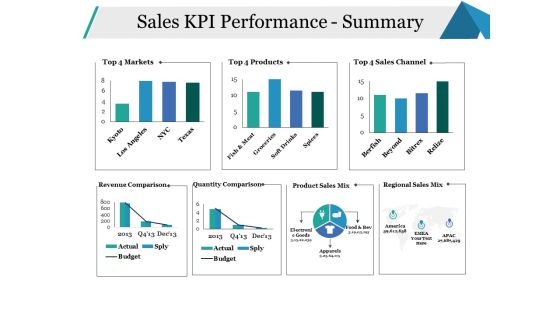
Sales KPI Performance Summary Ppt PowerPoint Presentation Infographics Model
This is a sales kpi performance summary ppt powerpoint presentation infographics model. This is a seven stage process. The stages in this process are sales channel, revenue comparison, quantity comparison, business, marketing.

Sales Kpi Performance Summary Ppt PowerPoint Presentation Show Inspiration
This is a sales kpi performance summary ppt powerpoint presentation show inspiration. This is a two stage process. The stages in this process are revenue comparison, quantity comparison, product sales mix, regional sales mix, budget.
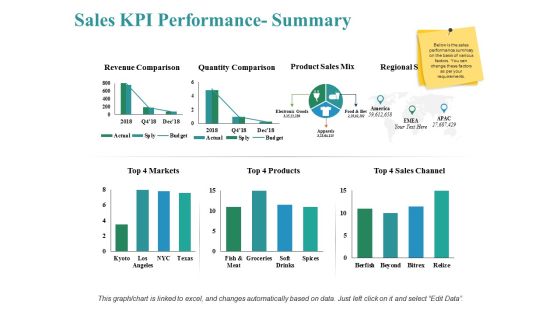
Sales Kpi Performance Summary Ppt PowerPoint Presentation Show Themes
This is a sales kpi performance summary ppt powerpoint presentation show themes. This is a three stage process. The stages in this process are revenue comparison, quantity comparison, product sales mix, markets, sales channel.
Healthcare Project Management KPI Tracking Sheet Demonstration PDF
This slide depicts healthcare project management key performance indicators KPI tracking sheet. It contains information about KPI, details, progress, measurement and comments. Pitch your topic with ease and precision using this healthcare project management kpi tracking sheet demonstration pdf. This layout presents information on kpi, management, progress, cost, scope, measurement. It is also available for immediate download and adjustment. So, changes can be made in the color, design, graphics or any other component to create a unique layout.

KPI Dashboard To Measure Overall Business Performance Themes PDF
Deliver and pitch your topic in the best possible manner with this KPI Dashboard To Measure Overall Business Performance Themes PDF. Use them to share invaluable insights on Sales Comparison, Product Category, Brand Profitability and impress your audience. This template can be altered and modified as per your expectations. So, grab it now.
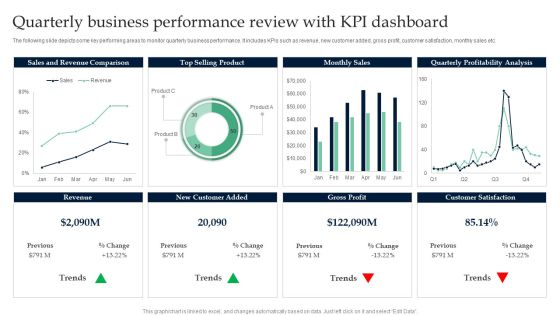
Quarterly Business Performance Review With KPI Dashboard Infographics PDF
Pitch your topic with ease and precision using this Quarterly Business Performance Review With KPI Dashboard Infographics PDF. This layout presents information on Sales And Revenue Comparison, Top Selling Product. It is also available for immediate download and adjustment. So, changes can be made in the color, design, graphics or any other component to create a unique layout.

Open Organizational Management Transformation Kpi Dashboard Information PDF
This slide covers the KPI tracking dashboard for optimizing open changes. It includes metrics such as open changes by risk, status, due date, waiting for approval, etc. Pitch your topic with ease and precision using this Open Organizational Management Transformation Kpi Dashboard Information PDF. This layout presents information on Open Organizational Management, Transformation Kpi Dashboard. It is also available for immediate download and adjustment. So, changes can be made in the color, design, graphics or any other component to create a unique layout.
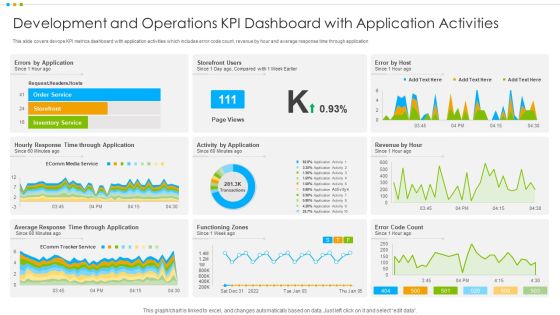
Development And Operations KPI Dashboard With Application Activities Information PDF
This slide covers devops KPI metrics dashboard with application activities which includes error code count, revenue by hour and average response time through application.Pitch your topic with ease and precision using this Development And Operations KPI Dashboard With Application Activities Information PDF This layout presents information on Development Operations Kpi Dashboard, Application Activities It is also available for immediate download and adjustment. So, changes can be made in the color, design, graphics or any other component to create a unique layout.
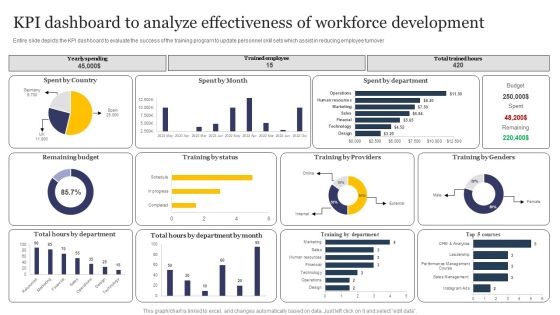
KPI Dashboard To Analyze Effectiveness Of Workforce Development Formats PDF
Entire slide depicts the KPI dashboard to evaluate the success of the training program to update personnel skill sets which assist in reducing employee turnover. Pitch your topic with ease and precision using this KPI Dashboard To Analyze Effectiveness Of Workforce Development Formats PDF. This layout presents information on Kpi Dashboard, Analyze Effectiveness, Workforce Development. It is also available for immediate download and adjustment. So, changes can be made in the color, design, graphics or any other component to create a unique layout.

Dashboard For Key Performance Indicator Of Financial KPI Background PDF
Pitch your topic with ease and precision using this Dashboard For Key Performance Indicator Of Financial KPI Background PDF. This layout presents information on Dashboard For Key, Performance Indicator, Financial KPI. It is also available for immediate download and adjustment. So, changes can be made in the color, design, graphics or any other component to create a unique layout.

B2B Lead Generation KPI Metrics Social Ppt Ideas Example PDF
This is a b2b lead generation kpi metrics social ppt ideas example pdf template with various stages. Focus and dispense information on one stages using this creative set, that comes with editable features. It contains large content boxes to add your information on topics like kpi metrics. You can also showcase facts, figures, and other relevant content using this PPT layout. Grab it now.
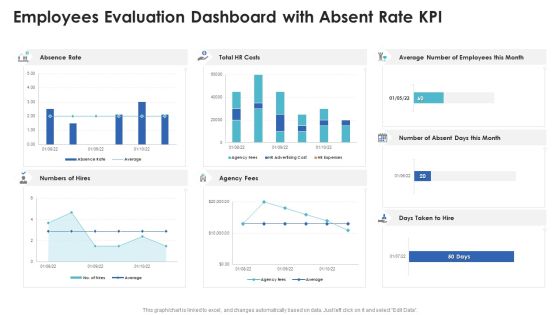
Employees Evaluation Dashboard With Absent Rate Kpi Microsoft PDF
Pitch your topic with ease and precision using this employees evaluation dashboard with absent rate kpi microsoft pdf. This layout presents information on employees evaluation dashboard with absent rate kpi. It is also available for immediate download and adjustment. So, changes can be made in the color, design, graphics or any other component to create a unique layout.
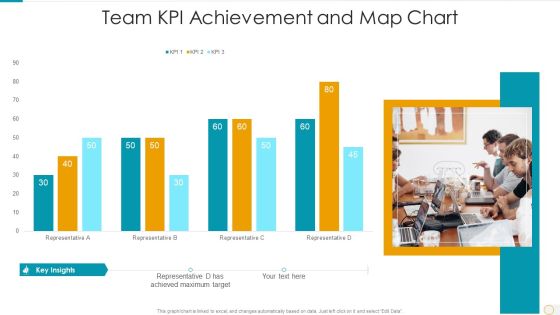
Team Kpi Achievement And Map Chart Portrait PDF
Pitch your topic with ease and precision using this team kpi achievement and map chart portrait pdf. This layout presents information on team kpi achievement and map chart. It is also available for immediate download and adjustment. So, changes can be made in the color, design, graphics or any other component to create a unique layout.

KPI Compare Dashboard Depicting Sales Performance Summary PDF
Pitch your topic with ease and precision using this KPI Compare Dashboard Depicting Sales Performance Summary PDF This layout presents information on KPI Compare Dashboard Depicting Sales Performance It is also available for immediate download and adjustment. So, changes can be made in the color, design, graphics or any other component to create a unique layout.
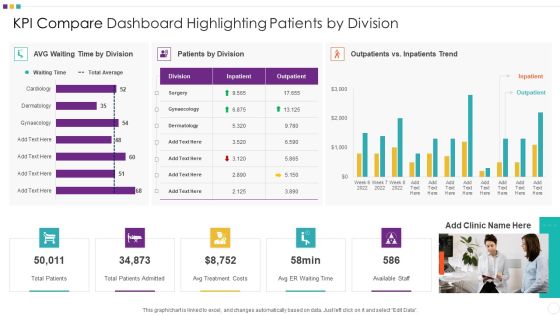
KPI Compare Dashboard Highlighting Patients By Division Elements PDF
Pitch your topic with ease and precision using this KPI Compare Dashboard Highlighting Patients By Division Elements PDF This layout presents information on KPI Compare Dashboard Highlighting Patients By Division It is also available for immediate download and adjustment. So, changes can be made in the color, design, graphics or any other component to create a unique layout.
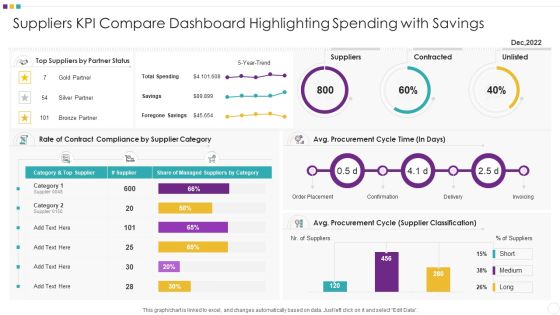
Suppliers KPI Compare Dashboard Highlighting Spending With Savings Background PDF
Pitch your topic with ease and precision using this Suppliers KPI Compare Dashboard Highlighting Spending With Savings Background PDF This layout presents information on Suppliers KPI Compare Dashboard Highlighting Spending With Savings It is also available for immediate download and adjustment. So, changes can be made in the color, design, graphics or any other component to create a unique layout.
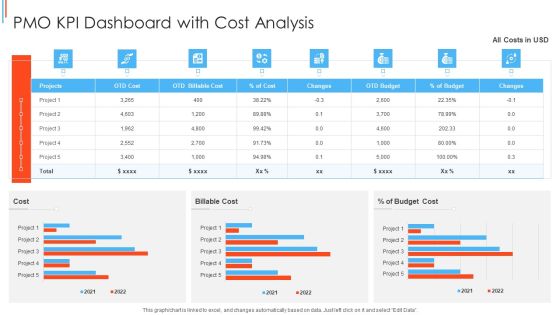
PMO KPI Dashboard With Cost Analysis Summary PDF
Pitch your topic with ease and precision using this PMO KPI Dashboard With Cost Analysis Summary PDF This layout presents information on Pmo Kpi Dashboard With Cost Analysis It is also available for immediate download and adjustment. So, changes can be made in the color, design, graphics or any other component to create a unique layout.

Online Marketing Performance Analysis KPI Matrix Summary PDF
Following slide depicts the various KPI for analysis of digital marketing performance to keep a record for to forecast the objectives or targets. The KPI are led generation, website traffic, SEO. Showcasing this set of slides titled Online Marketing Performance Analysis KPI Matrix Summary PDF. The topics addressed in these templates are Lead Generation, Website Traffic, SEO Search Engine Optimization. All the content presented in this PPT design is completely editable. Download it and make adjustments in color, background, font etc. as per your unique business setting.

Batch Processing KPI Metrics Dashboard With Rejection Rate Topics PDF
Mentioned slide highlights performance KPI dashboard of batch processing system. The KPIs covered in the slide are batch rejection rate by product, number of reprocessed lots, rejection by product and reasons for the rejection. Pitch your topic with ease and precision using this Batch Processing KPI Metrics Dashboard With Rejection Rate Topics PDF. This layout presents information on Batch Processing KPI Metrics, Dashboard Rejection Rate. It is also available for immediate download and adjustment. So, changes can be made in the color, design, graphics or any other component to create a unique layout.

Marketing Kpi Dashboard Showing Campaign Outcomes Pictures PDF
The purpose of this slide is to outline KPI dashboard of various results generated from marketing campaign. The results highlighted in the slide are total visits, average session duration, bounce rate, traffic sources, top channels by conversion etc. Pitch your topic with ease and precision using this Marketing Kpi Dashboard Showing Campaign Outcomes Pictures PDF. This layout presents information on Marketing Kpi Dashboard Showing Campaign Outcomes. It is also available for immediate download and adjustment. So, changes can be made in the color, design, graphics or any other component to create a unique layout.

Web Analysis Summary KPI Dashboard With Visit Trends Professional PDF
This slide covers website analytics report KPI dashboard to track website performance. It involves details such as total number of visits, visit trends by medium, pagers per visit and new vs returning visitors. Pitch your topic with ease and precision using this Web Analysis Summary KPI Dashboard With Visit Trends Professional PDF. This layout presents information on Web Analysis Summary, KPI Dashboard, Visit Trends. It is also available for immediate download and adjustment. So, changes can be made in the color, design, graphics or any other component to create a unique layout.

KPI Dashboard To Evaluate Corporate Sales Introduction PDF
This slide contains KPI dashboard which can be used by company to track e-commerce sales. It includes kpis such as total orders, order quantity, sales quantity, sales by location, etc. Pitch your topic with ease and precision using this KPI Dashboard To Evaluate Corporate Sales Introduction PDF. This layout presents information on KPI Dashboard, Evaluate Corporate Sales. It is also available for immediate download and adjustment. So, changes can be made in the color, design, graphics or any other component to create a unique layout.

Continuous Process Improvement KPI Dashboard For IT Industry Clipart PDF
Following slide depicts the IT industry KPI dashboard which will assist in generating more of profit by improving strategic plan according to changing environment with clients preferences .The KPI mentioned in a slide are such as risk analysis, outstanding task , upcoming task, budget analysis, etc. Pitch your topic with ease and precision using this Continuous Process Improvement KPI Dashboard For IT Industry Clipart PDF. This layout presents information on Overall Progress, Risk Analysis, Budget Analysis. It is also available for immediate download and adjustment. So, changes can be made in the color, design, graphics or any other component to create a unique layout.

Corporate Scam Risk Analysis Report KPI Dashboard Themes PDF
Following slides show the report dashboard on corporate fraud risk which will assist in creating fraud prevention strategies .It includes KPI such as risk matrix, transaction split , transaction alert, etc. Pitch your topic with ease and precision using this Corporate Scam Risk Analysis Report KPI Dashboard Themes PDF. This layout presents information on Global Transaction Flow, Risk Matrix, Transaction Split, Analysis Report Kpi Dashboard. It is also available for immediate download and adjustment. So, changes can be made in the color, design, graphics or any other component to create a unique layout.
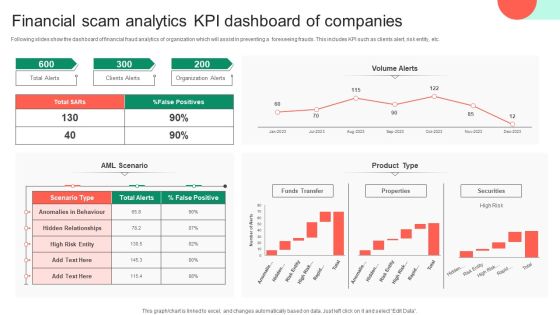
Financial Scam Analytics KPI Dashboard Of Companies Clipart PDF
Following slides show the dashboard of financial fraud analytics of organization which will assist in preventing a foreseeing frauds. This includes KPI such as clients alert, risk entity, etc. Pitch your topic with ease and precision using this Financial Scam Analytics KPI Dashboard Of Companies Clipart PDF. This layout presents information on Financial Scam Analytics, Kpi Dashboard Of Companies. It is also available for immediate download and adjustment. So, changes can be made in the color, design, graphics or any other component to create a unique layout.
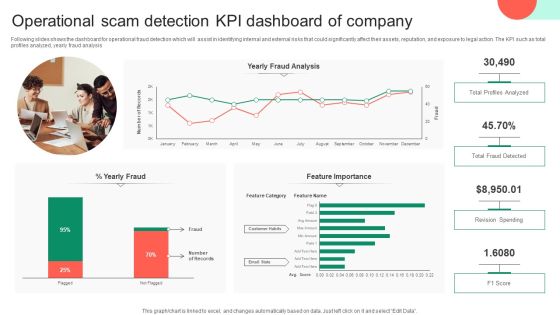
Operational Scam Detection KPI Dashboard Of Company Topics PDF
Following slides shows the dashboard for operational fraud detection which will assist in identifying internal and external risks that could significantly affect their assets, reputation, and exposure to legal action. The KPI such as total profiles analyzed, yearly fraud analysis. Pitch your topic with ease and precision using this Operational Scam Detection KPI Dashboard Of Company Topics PDF. This layout presents information on Profiles Analyzed, Operational Scam Detection, Kpi Dashboard Of Company. It is also available for immediate download and adjustment. So, changes can be made in the color, design, graphics or any other component to create a unique layout.
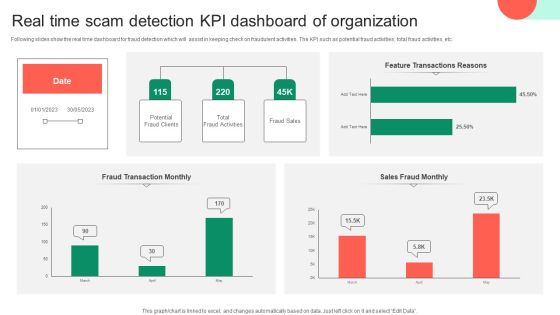
Real Time Scam Detection KPI Dashboard Of Organization Information PDF
Following slides show the real time dashboard for fraud detection which will assist in keeping check on fraudulent activities. The KPI such as potential fraud activities, total fraud activities, etc. Pitch your topic with ease and precision using this Real Time Scam Detection KPI Dashboard Of Organization Information PDF. This layout presents information on Real Time Scam Detection, Kpi Dashboard Of Organization. It is also available for immediate download and adjustment. So, changes can be made in the color, design, graphics or any other component to create a unique layout.

 Home
Home