Kpi Accounting
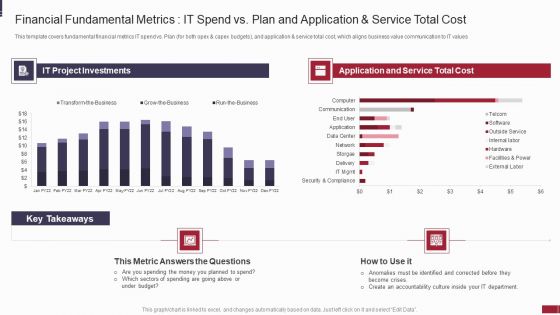
IT Value Story Significant To Corporate Leadership Financial Fundamental Metrics Diagrams PDF
These indicators assist IT leaders in stewarding technology expenditures and investments, and they are essential to managing the IT company. These measures aid in the management of the departments financial health and may indicate levers for cost reduction, improved resource allocation, and enhanced accountability. Deliver and pitch your topic in the best possible manner with this it value story significant to corporate leadership financial fundamental metrics diagrams pdf. Use them to share invaluable insights on organizations, budget, metric, cost and impress your audience. This template can be altered and modified as per your expectations. So, grab it now.
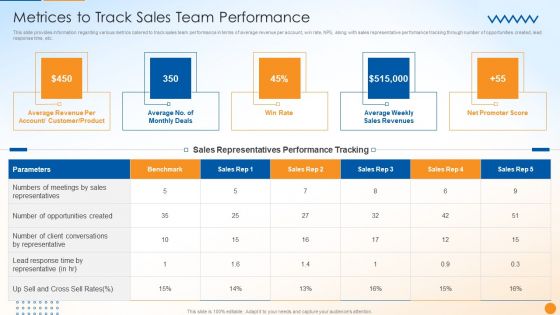
B2B Sales Techniques Playbook Metrices To Track Sales Team Performance Formats PDF
This slide provides information regarding various metrics catered to track sales team performance in terms of average revenue per account, win rate, NPS, along with sales representative performance tracking through number of opportunities created, lead response time, etc. Presenting B2B Sales Techniques Playbook Metrices To Track Sales Team Performance Formats PDF to provide visual cues and insights. Share and navigate important information on four stages that need your due attention. This template can be used to pitch topics like Conversations Representative, Opportunities Created, Sales Revenues. In addtion, this PPT design contains high resolution images, graphics, etc, that are easily editable and available for immediate download.
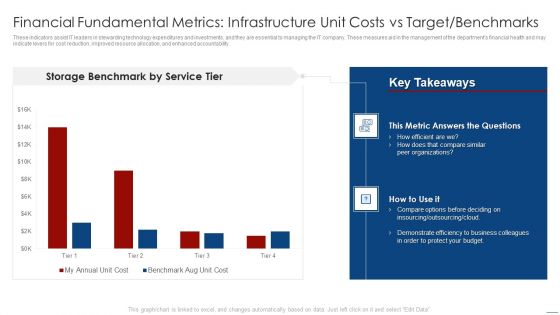
How To Evaluate And Develop The Organizational Value Of IT Service Financial Fundamental Metrics Slides PDF
These indicators assist IT leaders in stewarding technology expenditures and investments, and they are essential to managing the IT company. These measures aid in the management of the departments financial health and may indicate levers for cost reduction, improved resource allocation, and enhanced accountability. Deliver and pitch your topic in the best possible manner with this how to evaluate and develop the organizational value of it service financial fundamental metrics slides pdf. Use them to share invaluable insights on organizations, budget, business, efficiency and impress your audience. This template can be altered and modified as per your expectations. So, grab it now.
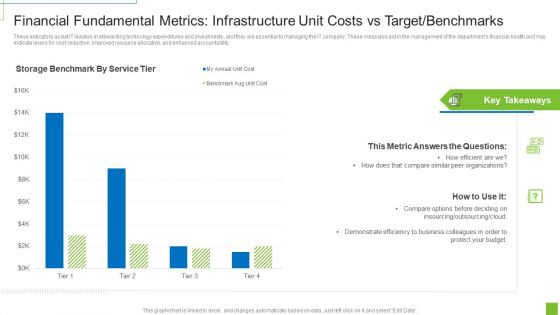
Financial Fundamental Metrics Infrastructure Unit Costs Vs Target Benchmarks Ppt Professional Example PDF
These indicators assist IT leaders in stewarding technology expenditures and investments, and they are essential to managing the IT company. These measures aid in the management of the departments financial health and may indicate levers for cost reduction, improved resource allocation, and enhanced accountability. Deliver and pitch your topic in the best possible manner with this financial fundamental metrics infrastructure unit costs vs target benchmarks ppt professional example pdf. Use them to share invaluable insights on outsourcing, organizations, budget and impress your audience. This template can be altered and modified as per your expectations. So, grab it now.

Communicate Company Value To Your Stakeholders Financial Fundamental Metrics Graphics PDF
These indicators assist IT leaders in stewarding technology expenditures and investments, and they are essential to managing the IT company. These measures aid in the management of the departments financial health and may indicate levers for cost reduction, improved resource allocation, and enhanced accountability. Deliver and pitch your topic in the best possible manner with this communicate company value to your stakeholders financial fundamental metrics graphics pdf. Use them to share invaluable insights on organizations, budget, protect and impress your audience. This template can be altered and modified as per your expectations. So, grab it now.

Project Metrics Dashboard With Responsibilities Graphics PDF
This slide focuses on project management dashboard which shows the number of projects, types of objects, key performance indicators, viewpoints, overall project status with actions and progress, responsibilities with linked object types and actions, etc. Pitch your topic with ease and precision using this Project Metrics Dashboard With Responsibilities Graphics PDF. This layout presents information on Project Metrics, Dashboard With Responsibilities. It is also available for immediate download and adjustment. So, changes can be made in the color, design, graphics or any other component to create a unique layout.
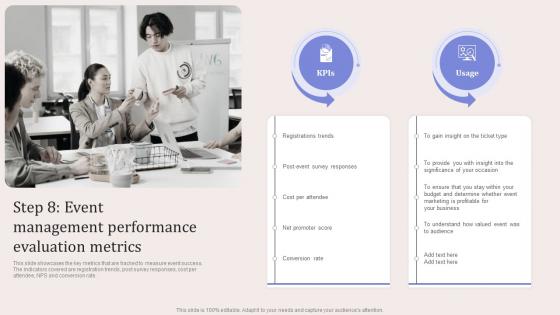
Step 8 Event Management Performance Virtual Event Promotion To Capture Professional Pdf
This slide showcases the key metrics that are tracked to measure event success. The indicators covered are registration trends, post survey responses, cost per attendee, NPS and conversion rate. Create an editable Step 8 Event Management Performance Virtual Event Promotion To Capture Professional Pdf that communicates your idea and engages your audience. Whether you are presenting a business or an educational presentation, pre-designed presentation templates help save time. Step 8 Event Management Performance Virtual Event Promotion To Capture Professional Pdf is highly customizable and very easy to edit, covering many different styles from creative to business presentations. Slidegeeks has creative team members who have crafted amazing templates. So, go and get them without any delay.

Inventory Stock Out And Decline Of Sales Analysis Dashboard Inspiration PDF
Following slide presents a key performance indicating dashboard that can be used by businesses to track Inventory stock out and lost sales. Major key performance indicators are percentage stockouts, amount of sales, lost sales accountability, etc. Pitch your topic with ease and precision using this Inventory Stock Out And Decline Of Sales Analysis Dashboard Inspiration PDF. This layout presents information on Lost Sales Summary, Stock Out Details It is also available for immediate download and adjustment. So, changes can be made in the color, design, graphics or any other component to create a unique layout.

Debt Retrieval Techniques Debt Management Dashboard Ppt Gallery Example File PDF
Purpose of the following slide is to show the key debt metrics such as total payable account, overdue, percentage overdue and the invoice by status Deliver an awe inspiring pitch with this creative debt retrieval techniques debt management dashboard ppt gallery example file pdf bundle. Topics like debt management dashboard can be discussed with this completely editable template. It is available for immediate download depending on the needs and requirements of the user.
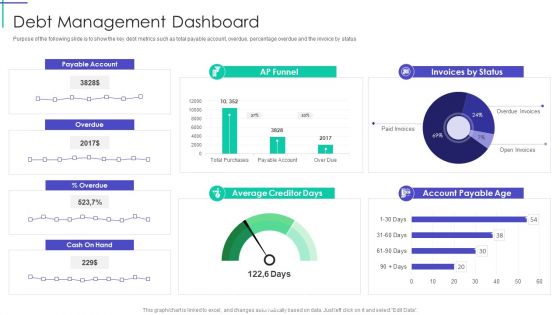
Mortgage Recovery Strategy For Finance Companies Debt Management Dashboard Inspiration PDF
Purpose of the following slide is to show the key debt metrics such as total payable account, overdue, percentage overdue and the invoice by status Deliver an awe inspiring pitch with this creative Mortgage Recovery Strategy For Finance Companies Debt Management Dashboard Inspiration PDF bundle. Topics like Average Creditor Days, Debt Management Dashboard can be discussed with this completely editable template. It is available for immediate download depending on the needs and requirements of the user.
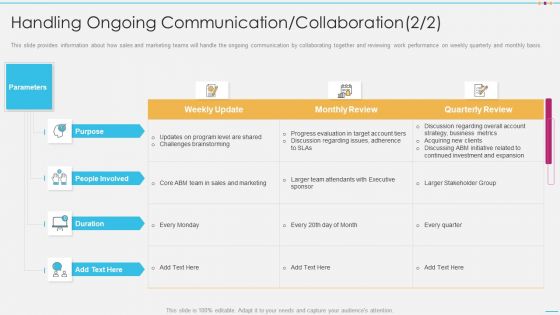
Handling Ongoing Communication Collaboration Infographics PDF
This slide provides information about how sales and marketing teams will handle the ongoing communication by collaborating together and reviewing work performance on weekly quarterly and monthly basis. Deliver an awe inspiring pitch with this creative handling ongoing communication collaboration infographics pdf bundle. Topics like progress evaluation, target account, metrics, business, strategy can be discussed with this completely editable template. It is available for immediate download depending on the needs and requirements of the user.
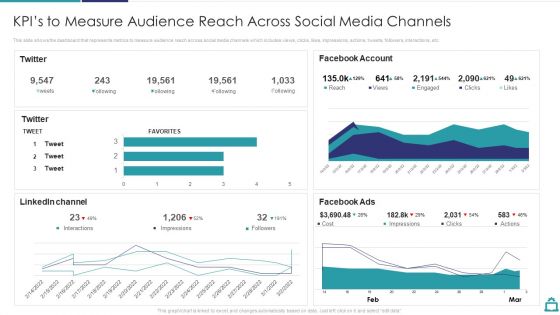
Deploying B2C Social Media Kpis To Measure Audience Reach Across Social Media Channels Introduction PDF
This slide shows the dashboard that represents metrics to measure audience reach across social media channels which includes views, clicks, likes, impressions, actions, tweets, followers, interactions, etc.Deliver an awe inspiring pitch with this creative Deploying B2C Social Media Kpis To Measure Audience Reach Across Social Media Channels Introduction PDF bundle. Topics like Facebook Account, Linkedin Channel, Facebook Ads can be discussed with this completely editable template. It is available for immediate download depending on the needs and requirements of the user.
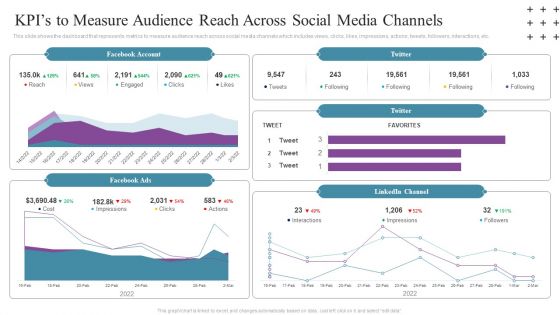
Social Networking Program Kpis To Measure Audience Reach Across Social Media Channels Summary PDF
This slide shows the dashboard that represents metrics to measure audience reach across social media channels which includes views, clicks, likes, impressions, actions, tweets, followers, interactions, etc. Deliver an awe inspiring pitch with this creative Social Networking Program Kpis To Measure Audience Reach Across Social Media Channels Summary PDF bundle. Topics like Facebook Account, 2022, Reach can be discussed with this completely editable template. It is available for immediate download depending on the needs and requirements of the user.
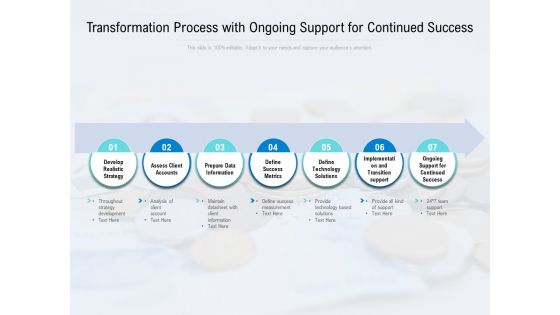
Transformation Process With Ongoing Support For Continued Success Ppt PowerPoint Presentation Summary Graphic Tips
Presenting this set of slides with name transformation process with ongoing support for continued success ppt powerpoint presentation summary graphic tips. This is a seven stage process. The stages in this process are develop realistic strategy, assess client accounts, prepare data information, define success metrics, define technology solutions, implementation and transition support, ongoing support for continued success. This is a completely editable PowerPoint presentation and is available for immediate download. Download now and impress your audience.
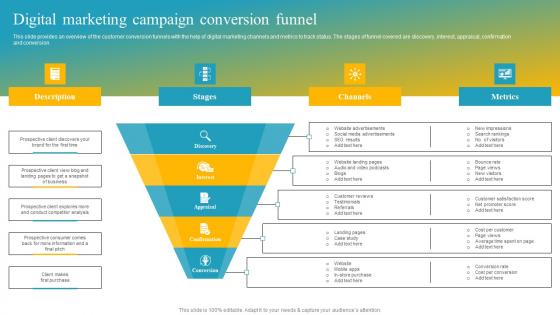
Effective Customer Engagement With Direct Response Digital Marketing Campaign Professional Pdf
This slide provides an overview of the customer conversion funnels with the help of digital marketing channels and metrics to track status. The stages of funnel covered are discovery, interest, appraisal, confirmation and conversion. Make sure to capture your audiences attention in your business displays with our gratis customizable Effective Customer Engagement With Direct Response Digital Marketing Campaign Professional Pdf. These are great for business strategies, office conferences, capital raising or task suggestions. If you desire to acquire more customers for your tech business and ensure they stay satisfied, create your own sales presentation with these plain slides.

Startup Business Financial Dashboard With Key Metrics Sample PDF
This slide represents the financial dashboard for startup company with key performance indicators. It includes details related to current working capital, cash conversion cycle in days and vendor payment error rate. Pitch your topic with ease and precision using this Startup Business Financial Dashboard With Key Metrics Sample PDF. This layout presents information on Cash Conversion Cycle, Current Working Capital, Current Liabilities Debt. It is also available for immediate download and adjustment. So, changes can be made in the color, design, graphics or any other component to create a unique layout.
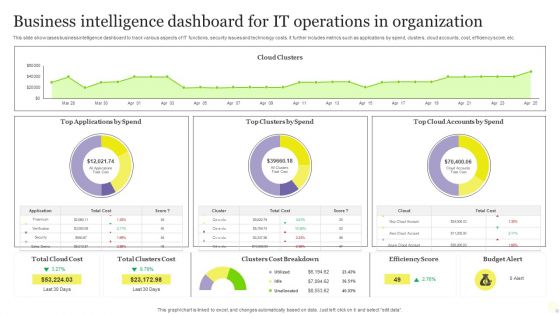
Business Intelligence Dashboard For It Operations In Organization Themes PDF
This slide showcases business intelligence dashboard to track various aspects of IT functions, security issues and technology costs. It further includes metrics such as applications by spend, clusters, cloud accounts, cost, efficiency score, etc. Showcasing this set of slides titled Business Intelligence Dashboard For It Operations In Organization Themes PDF. The topics addressed in these templates are Business Intelligence Dashboard, IT Operations, Organization. All the content presented in this PPT design is completely editable. Download it and make adjustments in color, background, font etc. as per your unique business setting.
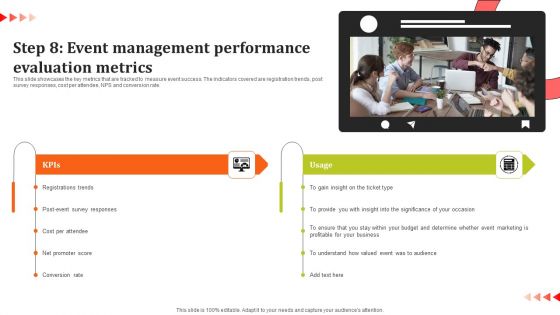
Step 8 Event Management Performance Evaluation Metrics Inspiration PDF
This slide showcases the key metrics that are tracked to measure event success. The indicators covered are registration trends, post survey responses, cost per attendee, NPS and conversion rate. There are so many reasons you need a Step 8 Event Management Performance Evaluation Metrics Inspiration PDF. The first reason is you can not spend time making everything from scratch, Thus, Slidegeeks has made presentation templates for you too. You can easily download these templates from our website easily.
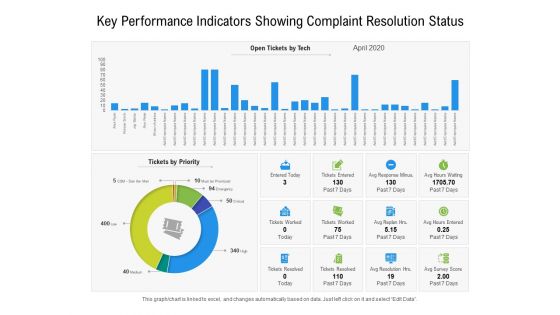
Key Performance Indicators Showing Complaint Resolution Status Ppt PowerPoint Presentation File Styles PDF
Presenting this set of slides with name key performance indicators showing complaint resolution status ppt powerpoint presentation file styles pdf. The topics discussed in these slides are priority, survey, response. This is a completely editable PowerPoint presentation and is available for immediate download. Download now and impress your audience.
Tracking First Response Time Improving Customer Retention PPT Presentation
The following slide depicts key performance indicators to review call resolution time and offer real time support. It also includes elements such as unsolved calls, weekly response time analysis, best day to call etc. Presenting this PowerPoint presentation, titled Tracking First Response Time Improving Customer Retention PPT Presentation, with topics curated by our researchers after extensive research. This editable presentation is available for immediate download and provides attractive features when used. Download now and captivate your audience. Presenting this Tracking First Response Time Improving Customer Retention PPT Presentation. Our researchers have carefully researched and created these slides with all aspects taken into consideration. This is a completely customizable Tracking First Response Time Improving Customer Retention PPT Presentation that is available for immediate downloading. Download now and make an impact on your audience. Highlight the attractive features available with our PPTs.
Tracking First Response Time Enhancing Customer Experience Ppt Presentation
The following slide depicts key performance indicators to review call resolution time and offer real time support. It also includes elements such as unsolved calls, weekly response time analysis, best day to call etc. Presenting this PowerPoint presentation, titled Tracking First Response Time Enhancing Customer Experience Ppt Presentation, with topics curated by our researchers after extensive research. This editable presentation is available for immediate download and provides attractive features when used. Download now and captivate your audience. Presenting this Tracking First Response Time Enhancing Customer Experience Ppt Presentation. Our researchers have carefully researched and created these slides with all aspects taken into consideration. This is a completely customizable Tracking First Response Time Enhancing Customer Experience Ppt Presentation that is available for immediate downloading. Download now and make an impact on your audience. Highlight the attractive features available with our PPTs.

Key Company Financial Operation Performance Metrics Ppt Infographic Template Example Introduction PDF
This slide showcases key performance indicators for every business. Key metrics covered are return on assets and equity, working capital ratio, debt and equity ratio. Showcasing this set of slides titled Key Company Financial Operation Performance Metrics Ppt Infographic Template Example Introduction PDF. The topics addressed in these templates are Return on Assets, Working Capital Ratio, Return on Equity. All the content presented in this PPT design is completely editable. Download it and make adjustments in color, background, font etc. as per your unique business setting.

Step 8 Event Management Performance Evaluation Metrics Themes PDF
This slide showcases the key metrics that are tracked to measure event success. The indicators covered are registration trends, post survey responses, cost per attendee, NPS and conversion rate. Take your projects to the next level with our ultimate collection of Step 8 Event Management Performance Evaluation Metrics Themes PDF. Slidegeeks has designed a range of layouts that are perfect for representing task or activity duration, keeping track of all your deadlines at a glance. Tailor these designs to your exact needs and give them a truly corporate look with your own brand colors they will make your projects stand out from the rest
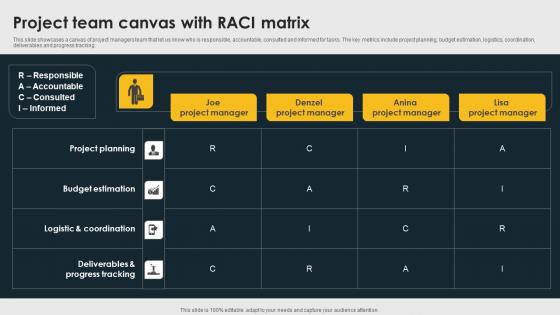
Project Team Canvas With RACI Matrix Demonstration Pdf
This slide showcases a canvas of project managers team that let us know who is responsible, accountable, consulted and informed for tasks. The key metrics include project planning, budget estimation, logistics, coordination, deliverables and progress tracking. Showcasing this set of slides titled Project Team Canvas With RACI Matrix Demonstration Pdf. The topics addressed in these templates are Joe Project Manager, Denzel Project Manager, Lisa Project Manager. All the content presented in this PPT design is completely editable. Download it and make adjustments in color, background, font etc. as per your unique business setting.
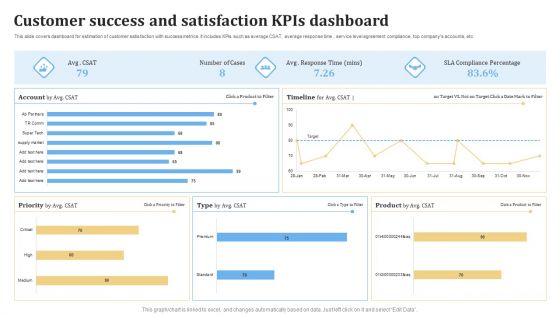
Customer Success And Satisfaction KPIS Dashboard Ppt PowerPoint Presentation Outline Visuals PDF
This slide covers dashboard for estimation of customer satisfaction with success metrics. It includes KPIs such as average CSAT, average response time , service level agreement compliance, top companys accounts, etc. Pitch your topic with ease and precision using this Customer Success And Satisfaction KPIS Dashboard Ppt PowerPoint Presentation Outline Visuals PDF. This layout presents information on Customer Success, Satisfaction KPIs Dashboard. It is also available for immediate download and adjustment. So, changes can be made in the color, design, graphics or any other component to create a unique layout.
Sales Process Catalogue Template Sales Management Activities Tracking Dashboard Summary PDF
This slide provides information regarding various metrics catered to track sales team performance in terms of average revenue per account, win rate, NPS, along with sales representative performance tracking through number of opportunities created, lead response time, etc. Deliver an awe inspiring pitch with this creative sales process catalogue template sales management activities tracking dashboard summary pdf bundle. Topics like sales pipeline, sales activity by sales rep, sales pipeline by sales rep, closed business, month over month growth, forecast by month can be discussed with this completely editable template. It is available for immediate download depending on the needs and requirements of the user.
Marketing Playbook To Maximize ROI Sales Management Activities Tracking Dashboard Guidelines PDF
This slide provides information regarding various metrics catered to track sales team performance in terms of average revenue per account, win rate, NPS, along with sales representative performance tracking through number of opportunities created, lead response time, etc. Deliver and pitch your topic in the best possible manner with this marketing playbook to maximize roi sales management activities tracking dashboard guidelines pdf. Use them to share invaluable insights on closed business, sales pipeline, month over month growth, sales activity by sales rep and impress your audience. This template can be altered and modified as per your expectations. So, grab it now.
Sales Techniques Playbook Sales Management Activities Tracking Dashboard Introduction PDF
This slide provides information regarding various metrics catered to track sales team performance in terms of average revenue per account, win rate, NPS, along with sales representative performance tracking through number of opportunities created, lead response time, etc. Deliver an awe inspiring pitch with this creative sales techniques playbook sales management activities tracking dashboard introduction pdf bundle. Topics like growth, sales can be discussed with this completely editable template. It is available for immediate download depending on the needs and requirements of the user.
Salesman Principles Playbook Sales Management Activities Tracking Dashboard Ideas PDF
This slide provides information regarding various metrics catered to track sales team performance in terms of average revenue per account, win rate, NPS, along with sales representative performance tracking through number of opportunities created, lead response time, etc. Deliver and pitch your topic in the best possible manner with this salesman principles playbook sales management activities tracking dashboard ideas pdf Use them to share invaluable insights on sales management activities tracking dashboard and impress your audience. This template can be altered and modified as per your expectations. So, grab it now.
Sales Management Playbook Sales Management Activities Tracking Dashboard Themes PDF
This slide provides information regarding various metrics catered to track sales team performance in terms of average revenue per account, win rate, NPS, along with sales representative performance tracking through number of opportunities created, lead response time, etc. Deliver an awe inspiring pitch with this creative Sales Management Playbook Sales Management Activities Tracking Dashboard Themes PDF bundle. Topics like Sales Management Activities Tracking Dashboard can be discussed with this completely editable template. It is available for immediate download depending on the needs and requirements of the user.

Customer Lifetime Value Based Success KPIS Dashboard Ppt PowerPoint Presentation Layouts Gridlines PDF
This slide covers dashboard for estimation of customer lifetime value as success metrics. It includes KPIs such as customer lifetime value, customer lifetime period, customer risk, customer contact rate, customer retention costs, average lifetime value, customer churn rate, average revenue per account, etc. Pitch your topic with ease and precision using this Customer Lifetime Value Based Success KPIS Dashboard Ppt PowerPoint Presentation Layouts Gridlines PDF. This layout presents information on Average Revenue, Customer Lifetime, Customer Risk. It is also available for immediate download and adjustment. So, changes can be made in the color, design, graphics or any other component to create a unique layout.
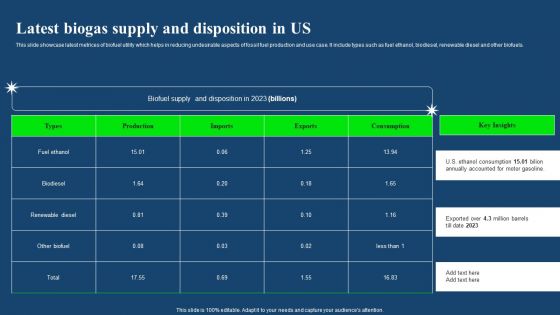
Latest Biogas Supply And Disposition In US Diagrams PDF

Company Product Quarterly Sales Performance Analysis Introduction PDF
This slide depicts quarterly product sales performance which helps managers to encourage productivity and increases representatives accountability. It includes performance metrics such as average profit margin, booking, conversion rate, average sales price, win rate, total ACV and average ACV.Showcasing this set of slides titled Company Product Quarterly Sales Performance Analysis Introduction PDF. The topics addressed in these templates are Average Profit Margin, Conversion Rate. All the content presented in this PPT design is completely editable. Download it and make adjustments in color, background, font etc. as per your unique business setting.

Inventory Audit Team RACI Model Boosting Efficiency In Inventory Auditing
This slide showcases RACI metric for inventory audit team such as responsible, accountable, consulted and informed. Do you know about Slidesgeeks Inventory Audit Team RACI Model Boosting Efficiency In Inventory Auditing These are perfect for delivering any kind od presentation. Using it, create PowerPoint presentations that communicate your ideas and engage audiences. Save time and effort by using our pre-designed presentation templates that are perfect for a wide range of topic. Our vast selection of designs covers a range of styles, from creative to business, and are all highly customizable and easy to edit. Download as a PowerPoint template or use them as Google Slides themes.

Online Marketing Tactics To Enhance Sales Kpis To Measure Audience Reach Across Social Media Professional PDF
This slide shows the dashboard that represents metrics to measure audience reach across social media channels which includes views, clicks, likes, impressions, actions, tweets, followers, interactions, etc. Deliver an awe inspiring pitch with this creative Online Marketing Tactics To Enhance Sales Kpis To Measure Audience Reach Across Social Media Professional PDF bundle. Topics like LinkedIn Channel, Facebook Account, Twitter, Facebook Ads can be discussed with this completely editable template. It is available for immediate download depending on the needs and requirements of the user.
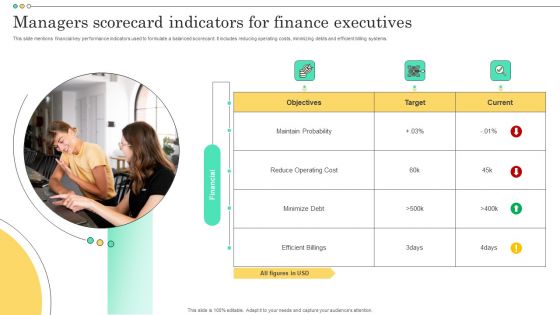
Managers Scorecard Indicators For Finance Executives Topics PDF
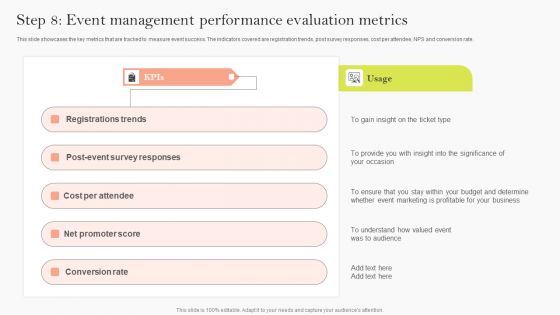
Step 8 Event Management Performance Evaluation Metrics Ppt Gallery Designs Download PDF
This slide showcases the key metrics that are tracked to measure event success. The indicators covered are registration trends, post survey responses, cost per attendee, NPS and conversion rate. There are so many reasons you need a Step 8 Event Management Performance Evaluation Metrics Ppt Gallery Designs Download PDF. The first reason is you can not spend time making everything from scratch, Thus, Slidegeeks has made presentation templates for you too. You can easily download these templates from our website easily.
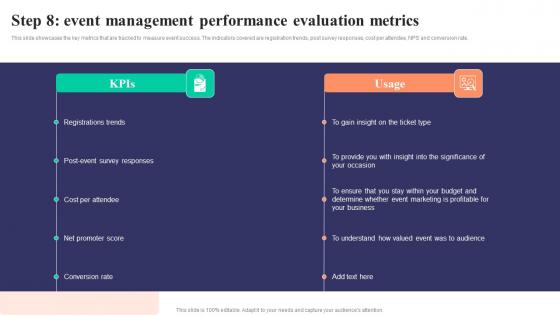
Step 8 Event Management Performance Strategies To Develop Successful Mockup Pdf
This slide showcases the key metrics that are tracked to measure event success. The indicators covered are registration trends, post survey responses, cost per attendee, NPS and conversion rate. This Step 8 Event Management Performance Strategies To Develop Successful Mockup Pdf from Slidegeeks makes it easy to present information on your topic with precision. It provides customization options, so you can make changes to the colors, design, graphics, or any other component to create a unique layout. It is also available for immediate download, so you can begin using it right away. Slidegeeks has done good research to ensure that you have everything you need to make your presentation stand out. Make a name out there for a brilliant performance.

Security Operations Metrics For Detection And Response Effectiveness Structure PDF
Showcasing this set of slides titled Security Operations Metrics For Detection And Response Effectiveness Structure PDF. The topics addressed in these templates are Operations Metrics, Detection, Response Effectiveness. All the content presented in this PPT design is completely editable. Download it and make adjustments in color, background, font etc. as per your unique business setting.
Lead Tracking Metrics Dashboard With User Responses Diagrams PDF
This slide showcases dashboard for lead conversion metrics that can help organization to filter out total leads interested from the leads who have responded to the phone calls by organization. It also showcases key metrics such as leads busiest hours, leads busiest days, phone number types and lead types. Showcasing this set of slides titled Lead Tracking Metrics Dashboard With User Responses Diagrams PDF. The topics addressed in these templates are Busiest Hours Leads, Conversion Metrics, Lead Types. All the content presented in this PPT design is completely editable. Download it and make adjustments in color, background, font etc. as per your unique business setting.
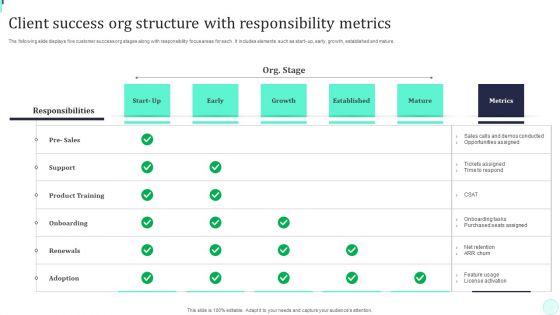
Client Success Org Structure With Responsibility Metrics Introduction PDF
The following slide displays five customer success org stages along with responsibility focus areas for each . It includes elements such as start- up, early, growth, established and mature. Showcasing this set of slides titled Client Success Org Structure With Responsibility Metrics Introduction PDF. The topics addressed in these templates are Responsibilities, Product Training, Onboarding. All the content presented in this PPT design is completely editable. Download it and make adjustments in color, background, font etc. as per your unique business setting.
Disciplined Agile Distribution Responsibilities Agile Delivery Metrics Quality Formats PDF
Listed here are the metrics used by the organisation to measure agile capability on the basis of product performance, security level and user satisfaction. Deliver an awe-inspiring pitch with this creative disciplined agile distribution responsibilities agile delivery metrics quality formats pdf bundle. Topics like organisation, measure agile capability, product performance, security, planning can be discussed with this completely editable template. It is available for immediate download depending on the needs and requirements of the user.

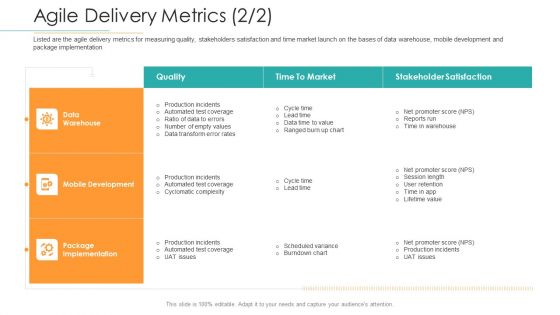
Disciplined Agile Distribution Responsibilities Agile Delivery Metrics Elements PDF
Listed are the agile delivery metrics for measuring quality, stakeholders satisfaction and time market launch on the bases of data warehouse, mobile development and package implementation. Deliver an awe-inspiring pitch with this creative disciplined agile distribution responsibilities agile delivery metrics elements pdf bundle. Topics like data warehouse, mobile development, package implementation can be discussed with this completely editable template. It is available for immediate download depending on the needs and requirements of the user.
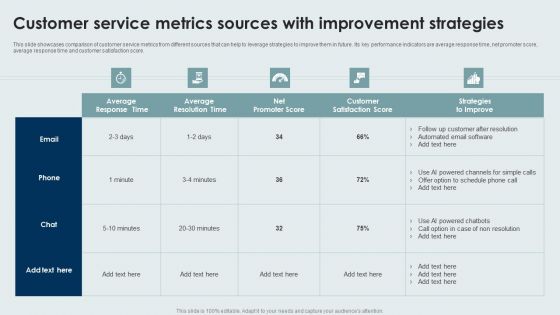
Customer Service Metrics Sources With Improvement Strategies Rules PDF
This slide showcases comparison of customer service metrics from different sources that can help to leverage strategies to improve them in future. Its key performance indicators are average response time, net promoter score, average response time and customer satisfaction score. Showcasing this set of slides titled Customer Service Metrics Sources With Improvement Strategies Rules PDF. The topics addressed in these templates are Average, Strategies, Customer Satisfaction Score. All the content presented in this PPT design is completely editable. Download it and make adjustments in color, background, font etc. as per your unique business setting.

Step 8 Event Management Performance Evaluation Metrics Ppt Layouts Inspiration PDF
This slide showcases the key metrics that are tracked to measure event success. The indicators covered are registration trends, post survey responses, cost per attendee, NPS and conversion rate. Do you have an important presentation coming up Are you looking for something that will make your presentation stand out from the rest Look no further than Step 8 Event Management Performance Evaluation Metrics Ppt Layouts Inspiration PDF. With our professional designs, you can trust that your presentation will pop and make delivering it a smooth process. And with Slidegeeks, you can trust that your presentation will be unique and memorable. So why wait Grab Step 8 Event Management Performance Evaluation Metrics Ppt Layouts Inspiration PDF today and make your presentation stand out from the rest.
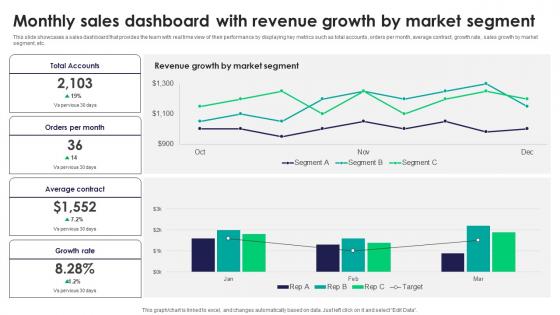
Monthly Sales Dashboard With Revenue Growth By Tactics For Improving Field Sales Team SA SS V
This slide showcases a sales dashboard that provides the team with real time view of their performance by displaying key metrics such as total accounts, orders per month, average contract, growth rate, sales growth by market segment, etc. The Monthly Sales Dashboard With Revenue Growth By Tactics For Improving Field Sales Team SA SS V is a compilation of the most recent design trends as a series of slides. It is suitable for any subject or industry presentation, containing attractive visuals and photo spots for businesses to clearly express their messages. This template contains a variety of slides for the user to input data, such as structures to contrast two elements, bullet points, and slides for written information. Slidegeeks is prepared to create an impression.

Monthly Sales Dashboard With Revenue Efficient Sales Territory Management To Build SA SS V
This slide showcases a sales dashboard that provides the team with real time view of their performance by displaying key metrics such as total accounts, orders per month, average contract, growth rate, sales growth by market segment, etc. The Monthly Sales Dashboard With Revenue Efficient Sales Territory Management To Build SA SS V is a compilation of the most recent design trends as a series of slides. It is suitable for any subject or industry presentation, containing attractive visuals and photo spots for businesses to clearly express their messages. This template contains a variety of slides for the user to input data, such as structures to contrast two elements, bullet points, and slides for written information. Slidegeeks is prepared to create an impression.

Debt Recovery Dashboard With Cash Flow Metrics Summary PDF
This slide showcase debt collection dashboard with cash flow metrics which contains 12 month collection totals by client, non payers, client with most debtors, paid vs. owed debtor and income by agent. It can assist businesses in reviewing the money collected and lent to various clients.Pitch your topic with ease and precision using this Debt Recovery Dashboard With Cash Flow Metrics Summary PDF This layout presents information on Debt Recovery, Dashboard Cash, Flow Metrics It is also available for immediate download and adjustment. So, changes can be made in the color, design, graphics or any other component to create a unique layout.

Marketing Technology Stack Performance Measurement Dashboard Demonstration PDF
The purpose of the following slide is to display various metrices and key performing indicators to measure the future performance of the marketing technology stack. Deliver and pitch your topic in the best possible manner with this marketing technology stack performance measurement dashboard demonstration pdf. Use them to share invaluable insights on average response time, user satisfaction score, error rate and impress your audience. This template can be altered and modified as per your expectations. So, grab it now.
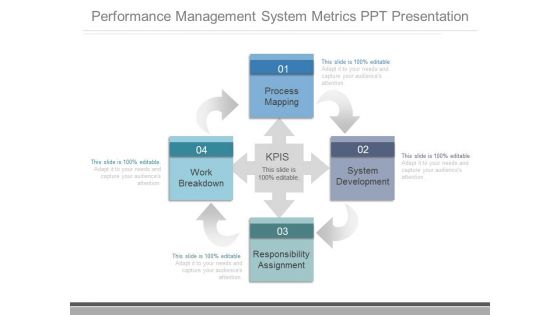
Performance Management System Metrics Ppt Presentation
This is a performance management system metrics ppt presentation. This is a four stage process. The stages in this process are process mapping, work breakdown, responsibility assignment, system development, kpis.
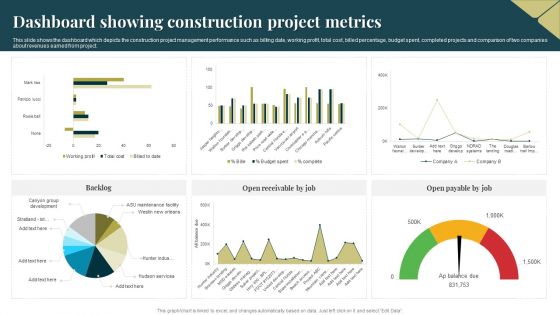
Dashboard Showing Construction Project Metrics Sample PDF
This slide shows the dashboard which depicts the construction project management performance such as billing date, working profit, total cost, billed percentage, budget spent, completed projects and comparison of two companies about revenues earned from project. Showcasing this set of slides titled Dashboard Showing Construction Project Metrics Sample PDF. The topics addressed in these templates are Dashboard, Construction Project Metrics. All the content presented in this PPT design is completely editable. Download it and make adjustments in color, background, font etc. as per your unique business setting.
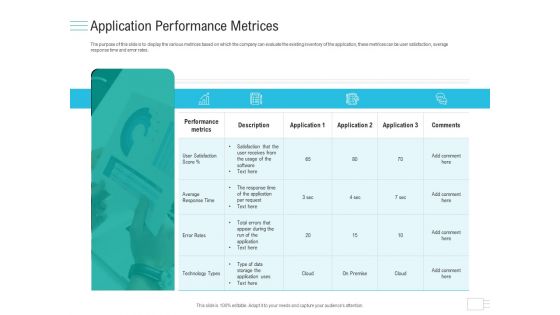
Business API Management Application Performance Metrices Brochure PDF
Deliver and pitch your topic in the best possible manner with this business API management application performance metrices brochure pdf. Use them to share invaluable insights on performance metrics, technology types, average response time, satisfaction that user receives from usage software and impress your audience. This template can be altered and modified as per your expectations. So, grab it now.
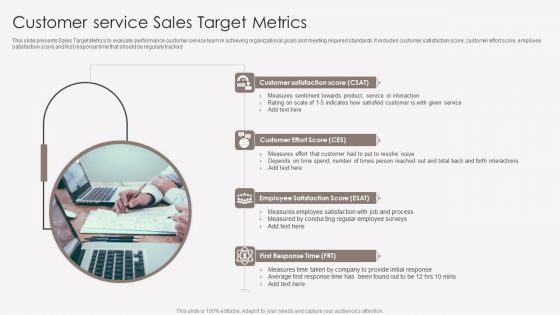
Customer Service Sales Target Metrics Download PDF
This slide presents Sales Target Metrics to evaluate performance customer service team in achieving organizational goals and meeting required standards. It includes customer satisfaction score, customer effort score, employee satisfaction score and first response time that should be regularly tracked. Persuade your audience using this Customer Service Sales Target Metrics Download PDF. This PPT design covers four stages, thus making it a great tool to use. It also caters to a variety of topics including Customer Satisfaction, Employee Satisfaction, First Response Time. Download this PPT design now to present a convincing pitch that not only emphasizes the topic but also showcases your presentation skills.
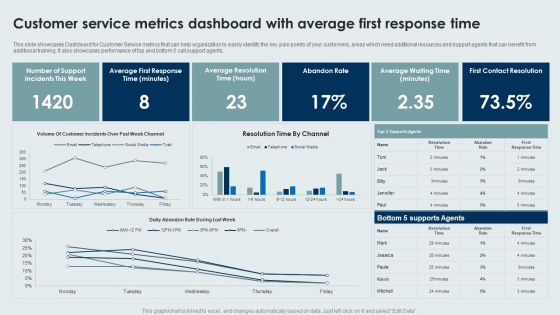
Customer Service Metrics Dashboard With Average First Response Time Background PDF
This slide showcases Dashboard for Customer Service metrics that can help organization to easily identify the key pain points of your customers, areas which need additional resources and support agents that can benefit from additional training. It also showcases performance of top and bottom 5 call support agents. Pitch your topic with ease and precision using this Customer Service Metrics Dashboard With Average First Response Time Background PDF. This layout presents information on Average, Abandon Rate, Contact Resolution. It is also available for immediate download and adjustment. So, changes can be made in the color, design, graphics or any other component to create a unique layout.
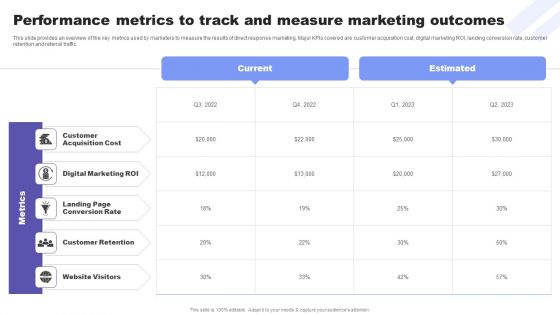
Direct Response Marketing Guide Ultimate Success Performance Metrics To Track And Measure Portrait PDF
This slide provides an overview of the key metrics used by marketers to measure the results of direct response marketing. Major KPIs covered are customer acquisition cost, digital marketing ROI, landing conversion rate, customer retention and referral traffic. Boost your pitch with our creative Direct Response Marketing Guide Ultimate Success Performance Metrics To Track And Measure Portrait PDF. Deliver an awe-inspiring pitch that will mesmerize everyone. Using these presentation templates you will surely catch everyones attention. You can browse the ppts collection on our website. We have researchers who are experts at creating the right content for the templates. So you do not have to invest time in any additional work. Just grab the template now and use them.

Project Metrics Dashboard With Commitments Mockup PDF
This slide focuses on the project management dashboard which includes the actual income, status, duration progress, project health with work schedule and budget, expenses, commitments, current status such as order, revised, billed, etc. Showcasing this set of slides titled Project Metrics Dashboard With Commitments Mockup PDF. The topics addressed in these templates are Expenses, Budget, Average. All the content presented in this PPT design is completely editable. Download it and make adjustments in color, background, font etc. as per your unique business setting.

Campaign Metrics With Traffic Report Information PDF
This template covers about traffic generated with daily number of sessions by user. This further includes behavioral response through analyzing page views. Pitch your topic with ease and precision using this Campaign Metrics With Traffic Report Information PDF. This layout presents information on Origins, Behaviour, Bounce Rate. It is also available for immediate download and adjustment. So, changes can be made in the color, design, graphics or any other component to create a unique layout.

Key Web Software Performance Metrics Background PDF
Persuade your audience using this Key Web Software Performance Metrics Background PDF. This PPT design covers Seven stages, thus making it a great tool to use. It also caters to a variety of topics including User Satisfaction, Peak Response Time, Time To Interactive. Download this PPT design now to present a convincing pitch that not only emphasizes the topic but also showcases your presentation skills.
Business Analytics Application Employee Engagement Key Performance Metrics Icons PDF
This slide represents key metrics dashboard to analyze the engagement of employees in the organization. It includes details related to KPIs such as engagement score, response rate, net promoter score etc. Formulating a presentation can take up a lot of effort and time, so the content and message should always be the primary focus. The visuals of the PowerPoint can enhance the presenters message, so our Business Analytics Application Employee Engagement Key Performance Metrics Icons PDF was created to help save time. Instead of worrying about the design, the presenter can concentrate on the message while our designers work on creating the ideal templates for whatever situation is needed. Slidegeeks has experts for everything from amazing designs to valuable content, we have put everything into Business Analytics Application Employee Engagement Key Performance Metrics Icons PDF.
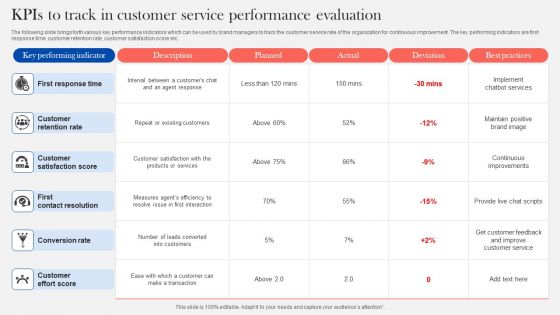
Kpis To Track In Customer Service Performance Evaluation Diagrams PDF
The following slide brings forth various key performance indicators which can be used by brand managers to track the customer service rate of the organization for continuous improvement. The key performing indicators are first response time, customer retention rate, customer satisfaction score etc. Showcasing this set of slides titled Kpis To Track In Customer Service Performance Evaluation Diagrams PDF. The topics addressed in these templates are First Response Time, Customer Retention Rate, Customer Satisfaction Score. All the content presented in this PPT design is completely editable. Download it and make adjustments in color, background, font etc. as per your unique business setting.

 Home
Home