Kpi Accounting

Customer Service Kpis Metrics With Objectives Introduction PDF
The purpose of this slide is to showcase KPIs and objectives of customer service department. Customer satisfaction score, first response time, average handle time and cost per resolution are some of the key KPI mentioned in the slide. Persuade your audience using this Customer Service Kpis Metrics With Objectives Introduction PDF. This PPT design covers one stages, thus making it a great tool to use. It also caters to a variety of topics including Customer Satisfaction, Target, Average Handle. Download this PPT design now to present a convincing pitch that not only emphasizes the topic but also showcases your presentation skills.

Improving Lead Generation Addressing Performance Delivery Gap At Present Inspiration PDF
This slide provides information regarding present performance delivery by assessing it on various performance metrics such as marketing spend on B2B account management, B2B accounts closed, conversion rate and comparing these to industry benchmarks and competitors performances. This is a improving lead generation addressing performance delivery gap at present inspiration pdf template with various stages. Focus and dispense information on five stages using this creative set, that comes with editable features. It contains large content boxes to add your information on topics like performance metrics, industry benchmark, own firm. You can also showcase facts, figures, and other relevant content using this PPT layout. Grab it now.
Online Customer Interaction Dashboard For Tracking Customer Service Team Performance Infographics PDF
This slide covers the KPI dashboard for analyzing the performance of client support department. It includes metrics such as first call resolution, unresolved calls, average response rate, the best day to call, average time to solve issues, etc. Deliver and pitch your topic in the best possible manner with this Online Customer Interaction Dashboard For Tracking Customer Service Team Performance Infographics PDF. Use them to share invaluable insights on Response Time, Issue Solving, Call Resolution and impress your audience. This template can be altered and modified as per your expectations. So, grab it now.
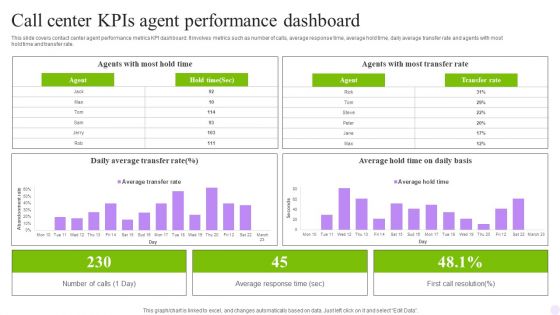
Call Center Kpis Agent Performance Dashboard Clipart PDF
This slide covers contact center agent performance metrics KPI dashboard. It involves metrics such as number of calls, average response time, average hold time, daily average transfer rate and agents with most hold time and transfer rate. Showcasing this set of slides titled Call Center Kpis Agent Performance Dashboard Clipart PDF. The topics addressed in these templates are Transfer Rate, Call Center, Hold Time. All the content presented in this PPT design is completely editable. Download it and make adjustments in color, background, font etc. as per your unique business setting.
Dashboard For Tracking Customer Service Team Performance Clipart PDF
This slide covers the KPI dashboard for analyzing the performance of client support department. It includes metrics such as first call resolution, unresolved calls, average response rate, the best day to call, average time to solve issues, etc. Deliver an awe inspiring pitch with this creative Dashboard For Tracking Customer Service Team Performance Clipart PDF bundle. Topics like Dashboard For Tracking Customer, Service Team Performance can be discussed with this completely editable template. It is available for immediate download depending on the needs and requirements of the user.
Consumer Journey Mapping Techniques Dashboard For Tracking Customer Service Team Performance Summary PDF
This slide covers the KPI dashboard for analyzing the performance of client support department. It includes metrics such as first call resolution, unresolved calls, average response rate, the best day to call, average time to solve issues, etc. Pitch your topic with ease and precision using this Consumer Journey Mapping Techniques Dashboard For Tracking Customer Service Team Performance Summary PDF. This layout presents information on Dashboard For Tracking Customer, Service Team Performance. It is also available for immediate download and adjustment. So, changes can be made in the color, design, graphics or any other component to create a unique layout.
Dashboard For Tracking Customer Service Team Performance Information PDF
This slide covers the KPI dashboard for analyzing the performance of client support department. It includes metrics such as first call resolution, unresolved calls, average response rate, the best day to call, average time to solve issues, etc. Deliver an awe inspiring pitch with this creative Dashboard For Tracking Customer Service Team Performance Information PDF bundle. Topics like Dashboard For Tracking Customer, Service Team Performance can be discussed with this completely editable template. It is available for immediate download depending on the needs and requirements of the user.
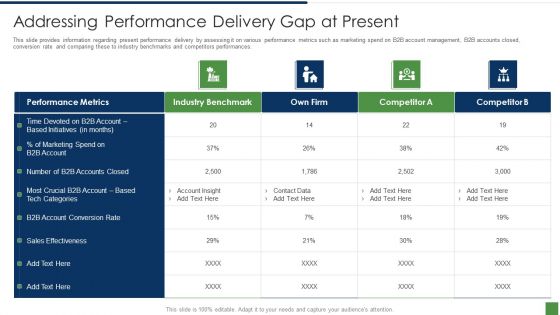
B2B Lead Generation Plan Addressing Performance Delivery Gap At Present Mockup PDF
This slide provides information regarding present performance delivery by assessing it on various performance metrics such as marketing spend on B2B account management, B2B accounts closed, conversion rate and comparing these to industry benchmarks and competitors performances. Deliver an awe inspiring pitch with this creative b2b lead generation plan addressing performance delivery gap at present mockup pdf bundle. Topics like addressing performance delivery gap at present can be discussed with this completely editable template. It is available for immediate download depending on the needs and requirements of the user.

Supplier Association Management Techniques Supplier Relationship Management Roles Slides PDF
This slide covers SRM element people skills covering employees roles an responsibilities such as maintaining strategy, implement project, manage contract, operate solutions ect. This is a supplier association management techniques supplier performance management kpi dashboards guidelines pdf template with various stages. Focus and dispense information on six stages using this creative set, that comes with editable features. It contains large content boxes to add your information on topics like reduction in costs, increased efficiency, increase in profitability. You can also showcase facts, figures, and other relevant content using this PPT layout. Grab it now.
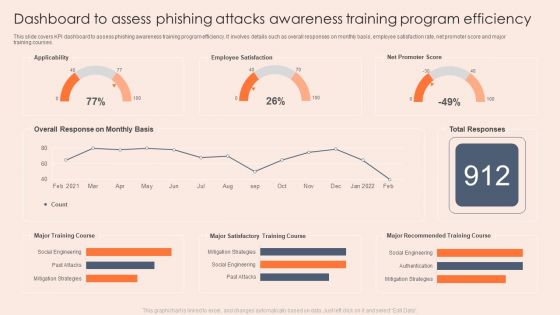
Dashboard To Assess Phishing Attacks Awareness Training Program Efficiency Professional PDF
This slide covers KPI dashboard to assess phishing awareness training program efficiency. It involves details such as overall responses on monthly basis, employee satisfaction rate, net promoter score and major training courses. Showcasing this set of slides titled Dashboard To Assess Phishing Attacks Awareness Training Program Efficiency Professional PDF. The topics addressed in these templates are Applicability, Employee Satisfaction, Mitigation Strategies. All the content presented in this PPT design is completely editable. Download it and make adjustments in color, background, font etc. as per your unique business setting.

Dashboard To Assess IT Security Awareness Training Program Efficiency Brochure PDF
This slide covers KPI dashboard to assess training program efficiency. It involves details such as overall responses on monthly basis, employee satisfaction rate, net promoter score and major training courses. Pitch your topic with ease and precision using this Dashboard To Assess IT Security Awareness Training Program Efficiency Brochure PDF. This layout presents information on Major Training Course, Major Satisfactory, Training Course. It is also available for immediate download and adjustment. So, changes can be made in the color, design, graphics or any other component to create a unique layout.
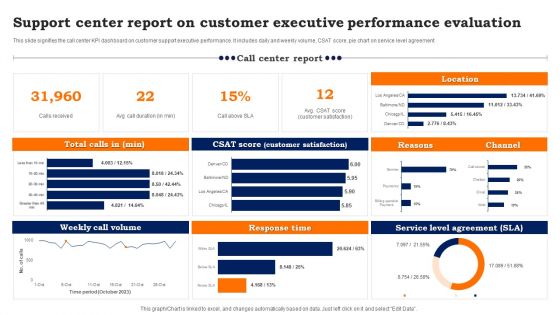
Support Center Report On Customer Executive Performance Evaluation Background PDF
This slide signifies the call center KPI dashboard on customer support executive performance. It includes daily and weekly volume, CSAT score, pie chart on service level agreement. Pitch your topic with ease and precision using this Support Center Report On Customer Executive Performance Evaluation Background PDF. This layout presents information on Weekly Call Volume, Response Time, Service Level Agreement. It is also available for immediate download and adjustment. So, changes can be made in the color, design, graphics or any other component to create a unique layout.
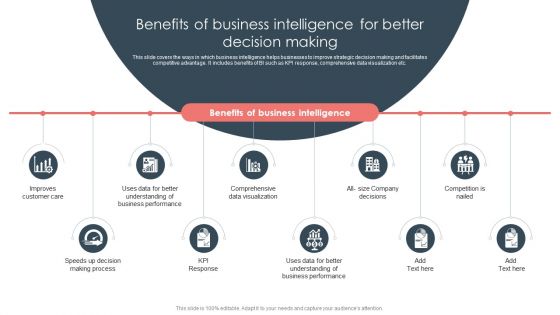
Overview Of BI For Enhanced Decision Making Benefits Of Business Intelligence For Better Decision Making Graphics PDF
This slide covers the ways in which business intelligence helps businesses to improve strategic decision making and facilitates competitive advantage. It includes benefits of BI such as KPI response, comprehensive data visualization etc. Find a pre designed and impeccable Overview Of BI For Enhanced Decision Making Benefits Of Business Intelligence For Better Decision Making Graphics PDF. The templates can ace your presentation without additional effort. You can download these easy to edit presentation templates to make your presentation stand out from others. So, what are you waiting for Download the template from Slidegeeks today and give a unique touch to your presentation.

Call Center Kpis Dashboard For Chat Management Graphics PDF
This slide covers contact center KPI dashboard for chat management. It involves details such as chats over time by site, location and language, total number of chats, average response time by employees. Showcasing this set of slides titled Call Center Kpis Dashboard For Chat Management Graphics PDF. The topics addressed in these templates are Management, Employees, Chats. All the content presented in this PPT design is completely editable. Download it and make adjustments in color, background, font etc. as per your unique business setting.
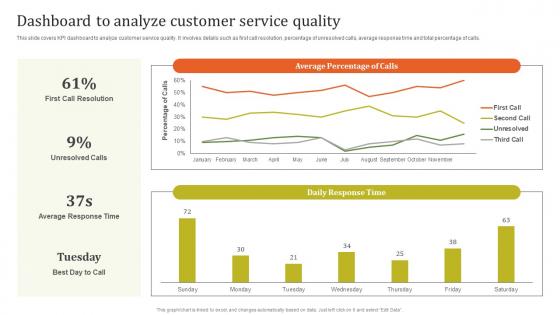
Dashboard To Analyze Customer Executing Effective Quality Enhancement Mockup Pdf
This slide covers KPI dashboard to analyze customer service quality. It involves details such as first call resolution, percentage of unresolved calls, average response time and total percentage of calls. From laying roadmaps to briefing everything in detail, our templates are perfect for you. You can set the stage with your presentation slides. All you have to do is download these easy to edit and customizable templates. Dashboard To Analyze Customer Executing Effective Quality Enhancement Mockup Pdf will help you deliver an outstanding performance that everyone would remember and praise you for. Do download this presentation today.

Evaluating Social Media Results Introduction To Niche Marketing Audience Segmentation Microsoft Pdf
The following slide represents KPI dashboard to evaluate social media results of micromarketing to anticipate campaign responses. It includes elements such as social events, facebook shares, twitter retweets, interactions etc. Make sure to capture your audiences attention in your business displays with our gratis customizable Evaluating Social Media Results Introduction To Niche Marketing Audience Segmentation Microsoft Pdf. These are great for business strategies, office conferences, capital raising or task suggestions. If you desire to acquire more customers for your tech business and ensure they stay satisfied, create your own sales presentation with these plain slides.
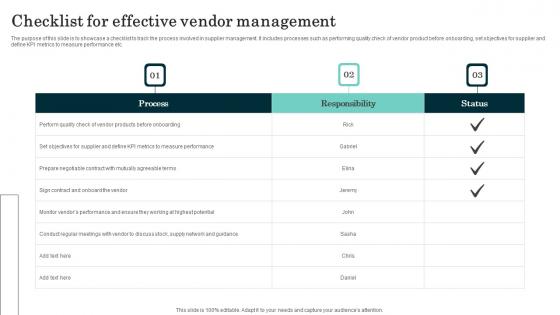
Checklist For Effective Vendor Management Sample Pdf
The purpose of this slide is to showcase a checklist to track the process involved in supplier management. It includes processes such as performing quality check of vendor product before onboarding, set objectives for supplier and define KPI metrics to measure performance etc. Pitch your topic with ease and precision using this Checklist For Effective Vendor Management Sample Pdf. This layout presents information on Process, Responsibility, Status. It is also available for immediate download and adjustment. So, changes can be made in the color, design, graphics or any other component to create a unique layout.
Tracking Working Of Employees In Software Companies Summary Pdf
Following slide shows tracking employees hours worked in software companies which assist in to check productivity of employee on daily basis. It includes various KPI such as email received, actual response , average working hours, etc. Pitch your topic with ease and precision using this Tracking Working Of Employees In Software Companies Summary Pdf This layout presents information on Tracking Traffic, Tracking Working, Software Companies It is also available for immediate download and adjustment. So, changes can be made in the color, design, graphics or any other component to create a unique layout.
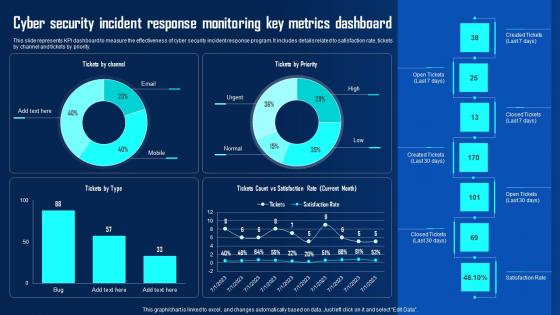
Cyber Security Incident Response Monitoring Key Ppt Powerpoint Presentation File Example File Pdf
This slide represents KPI dashboard to measure the effectiveness of cyber security incident response program. It includes details related to satisfaction rate, tickets by channel and tickets by priority. Formulating a presentation can take up a lot of effort and time, so the content and message should always be the primary focus. The visuals of the PowerPoint can enhance the presenters message, so our Cyber Security Incident Response Monitoring Key Ppt Powerpoint Presentation File Example File Pdf was created to help save time. Instead of worrying about the design, the presenter can concentrate on the message while our designers work on creating the ideal templates for whatever situation is needed. Slidegeeks has experts for everything from amazing designs to valuable content, we have put everything into Cyber Security Incident Response Monitoring Key Ppt Powerpoint Presentation File Example File Pdf
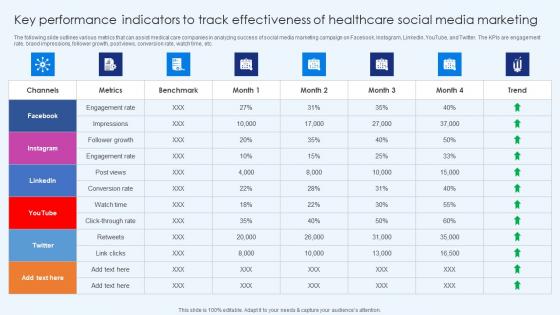
Key Performance Indicators To Tracks Effectiveness Healthcare Promotion Diagrams Pdf
The following slide outlines various metrics that can assist medical care companies in analyzing success of social media marketing campaign on Facebook, Instagram, LinkedIn, YouTube, and Twitter. The KPIs are engagement rate, brand impressions, follower growth, post views, conversion rate, watch time, etc. Slidegeeks has constructed Key Performance Indicators To Tracks Effectiveness Healthcare Promotion Diagrams Pdf after conducting extensive research and examination. These presentation templates are constantly being generated and modified based on user preferences and critiques from editors. Here, you will find the most attractive templates for a range of purposes while taking into account ratings and remarks from users regarding the content. This is an excellent jumping-off point to explore our content and will give new users an insight into our top-notch PowerPoint Templates.

Customer Service Metrics Dashboard With Average Response Time Formats PDF
This slide showcases KPI dashboard for customer service that can help to evaluate the performance of call center agents and identify issues arising from different channels. Its key components are number of issues in last 1 day, average time to closes, first call resolution, daily average response time, average time to close by channel and top performing call agents. Pitch your topic with ease and precision using this Customer Service Metrics Dashboard With Average Response Time Formats PDF. This layout presents information on Customer Service, Metrics Dashboard, Average Response Time. It is also available for immediate download and adjustment. So, changes can be made in the color, design, graphics or any other component to create a unique layout.

Operational Innovation In Banking Weak Banking Operational Performance Quarterly Clipart PDF
This slide highlights the current state of banking operations and services which includes key performance indicator of one branch which includes new account opened, total account closed, teller transactions, loan disbursal and credit cards issued. Are you searching for a Operational Innovation In Banking Weak Banking Operational Performance Quarterly Clipart PDF that is uncluttered, straightforward, and original Its easy to edit, and you can change the colors to suit your personal or business branding. For a presentation that expresses how much effort youve put in, this template is ideal With all of its features, including tables, diagrams, statistics, and lists, its perfect for a business plan presentation. Make your ideas more appealing with these professional slides. Download Operational Innovation In Banking Weak Banking Operational Performance Quarterly Clipart PDF from Slidegeeks today.

Safety Breach Response Playbook Real Time Incident Management Dashboard Formats PDF
Following slide illustrate KPI dashboard that can be used by organizations to track real time incident data. KPIs covered are number of tickets, average resolution time per customer, incidents registered per month. Find highly impressive Safety Breach Response Playbook Real Time Incident Management Dashboard Formats PDF on Slidegeeks to deliver a meaningful presentation. You can save an ample amount of time using these presentation templates. No need to worry to prepare everything from scratch because Slidegeeks experts have already done a huge research and work for you. You need to download Safety Breach Response Playbook Real Time Incident Management Dashboard Formats PDF for your upcoming presentation. All the presentation templates are 100 percent editable and you can change the color and personalize the content accordingly. Download now.
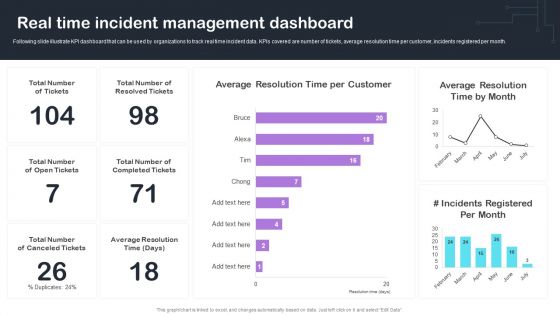
Cyber Risks And Incident Response Playbook Real Time Incident Management Dashboard Guidelines PDF
Following slide illustrate KPI dashboard that can be used by organizations to track real time incident data. KPIs covered are number of tickets, average resolution time per customer, incidents registered per month. This Cyber Risks And Incident Response Playbook Real Time Incident Management Dashboard Guidelines PDF from Slidegeeks makes it easy to present information on your topic with precision. It provides customization options, so you can make changes to the colors, design, graphics, or any other component to create a unique layout. It is also available for immediate download, so you can begin using it right away. Slidegeeks has done good research to ensure that you have everything you need to make your presentation stand out. Make a name out there for a brilliant performance.
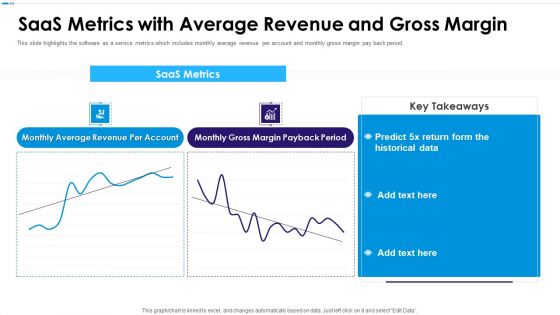
Canvas Capital Raising Elevator Pitch Deck Saas Metrics With Average Revenue And Gross Margin Demonstration PDF
This slide highlights the software as a service metrics which includes monthly average revenue per account and monthly gross margin pay back period.Deliver and pitch your topic in the best possible manner with this Canvas Capital Raising Elevator Pitch Deck Saas Metrics With Average Revenue And Gross Margin Demonstration PDF Use them to share invaluable insights on Average Revenue, Gross Margin, Key Takeaways and impress your audience. This template can be altered and modified as per your expectations. So, grab it now.

Improving Digital Banking Operations And Services Framework Weak Banking Operational Background PDF
This slide highlights the current state of banking operations and services which includes key performance indicator of one branch which includes new account opened, total account closed, teller transactions, loan disbursal and credit cards issued. Welcome to our selection of the Improving Digital Banking Operations And Services Framework Weak Banking Operational Background PDF. These are designed to help you showcase your creativity and bring your sphere to life. Planning and Innovation are essential for any business that is just starting out. This collection contains the designs that you need for your everyday presentations. All of our PowerPoints are 100 percent editable, so you can customize them to suit your needs. This multi purpose template can be used in various situations. Grab these presentation templates today.
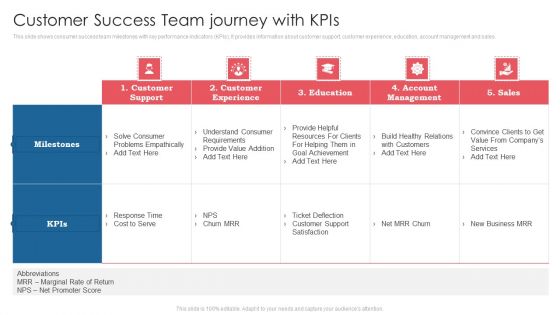
Customer Success Team Journey With Kpis Ppt Slides Inspiration PDF
This slide shows consumer success team milestones with key performance indicators KPIs. It provides information about customer support, customer experience, education, account management and sales. Pitch your topic with ease and precision using this Customer Success Team Journey With Kpis Ppt Slides Inspiration PDF. This layout presents information on Customer Support, Customer Experience, Education. It is also available for immediate download and adjustment. So, changes can be made in the color, design, graphics or any other component to create a unique layout.

Market Evaluation Of IT Industry Financial Dashboard To Track Organization Expenses Clipart PDF
The following slide showcases KPI dashboard which can be used by finance managers to evaluate financial health of company. Revenue, expenses, net profit, bills receivable, bills payable, quick ratio, current ratio are some of the major metrics which are outlined in the slide. Do you have an important presentation coming up Are you looking for something that will make your presentation stand out from the rest Look no further than Market Evaluation Of IT Industry Financial Dashboard To Track Organization Expenses Clipart PDF. With our professional designs, you can trust that your presentation will pop and make delivering it a smooth process. And with Slidegeeks, you can trust that your presentation will be unique and memorable. So why wait Grab Market Evaluation Of IT Industry Financial Dashboard To Track Organization Expenses Clipart PDF today and make your presentation stand out from the rest.
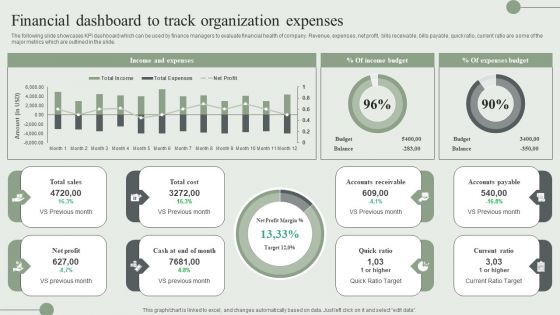
Financial Dashboard To Track Organization Expenses Ppt PowerPoint Presentation File Ideas PDF
The following slide showcases KPI dashboard which can be used by finance managers to evaluate financial health of company. Revenue, expenses, net profit, bills receivable, bills payable, quick ratio, current ratio are some of the major metrics which are outlined in the slide. Boost your pitch with our creative Financial Dashboard To Track Organization Expenses Ppt PowerPoint Presentation File Ideas PDF. Deliver an awe-inspiring pitch that will mesmerize everyone. Using these presentation templates you will surely catch everyones attention. You can browse the ppts collection on our website. We have researchers who are experts at creating the right content for the templates. So you do not have to invest time in any additional work. Just grab the template now and use them.
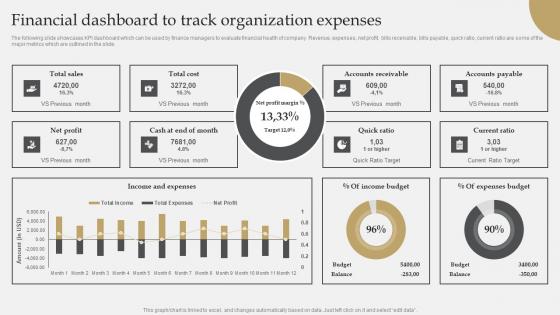
IT Industry Market Research Financial Dashboard To Track Organization Expenses Introduction Pdf
The following slide showcases KPI dashboard which can be used by finance managers to evaluate financial health of company. Revenue, expenses, net profit, bills receivable, bills payable, quick ratio, current ratio are some of the major metrics which are outlined in the slide. Present like a pro with IT Industry Market Research Financial Dashboard To Track Organization Expenses Introduction Pdf Create beautiful presentations together with your team, using our easy-to-use presentation slides. Share your ideas in real-time and make changes on the fly by downloading our templates. So whether you are in the office, on the go, or in a remote location, you can stay in sync with your team and present your ideas with confidence. With Slidegeeks presentation got a whole lot easier. Grab these presentations today.
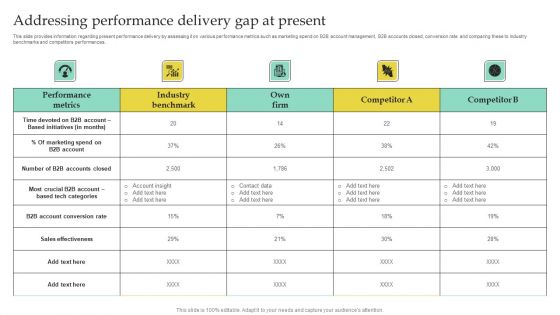
Addressing Performance Delivery Gap At Present Themes PDF
This slide provides information regarding present performance delivery by assessing it on various performance metrics such as marketing spend on B2B account management, B2B accounts closed, conversion rate and comparing these to industry benchmarks and competitors performances. Are you in need of a template that can accommodate all of your creative concepts This one is crafted professionally and can be altered to fit any style. Use it with Google Slides or PowerPoint. Include striking photographs, symbols, depictions, and other visuals. Fill, move around, or remove text boxes as desired. Test out color palettes and font mixtures. Edit and save your work, or work with colleagues. Download Addressing Performance Delivery Gap At Present Themes PDF and observe how to make your presentation outstanding. Give an impeccable presentation to your group and make your presentation unforgettable.
Dashboard For Tracking Customer Service Team Performance Consumer Contact Point Guide Diagrams PDF
This slide covers the KPI dashboard for analyzing the performance of client support department. It includes metrics such as first call resolution, unresolved calls, average response rate, the best day to call, average time to solve issues, etc. The Dashboard For Tracking Customer Service Team Performance Consumer Contact Point Guide Diagrams PDF is a compilation of the most recent design trends as a series of slides. It is suitable for any subject or industry presentation, containing attractive visuals and photo spots for businesses to clearly express their messages. This template contains a variety of slides for the user to input data, such as structures to contrast two elements, bullet points, and slides for written information. Slidegeeks is prepared to create an impression.
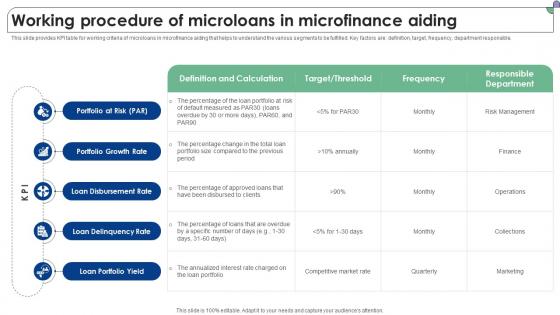
Working Procedure Of Microloans In Microfinance Aiding Complete Guide To Microfinance Fin SS V
This slide provides KPI table for working criteria of microloans in microfinance aiding that helps to understand the various segments to be fulfilled. Key factors are definition, target, frequency, department responsible. This Working Procedure Of Microloans In Microfinance Aiding Complete Guide To Microfinance Fin SS V is perfect for any presentation, be it in front of clients or colleagues. It is a versatile and stylish solution for organizing your meetings. The Working Procedure Of Microloans In Microfinance Aiding Complete Guide To Microfinance Fin SS V features a modern design for your presentation meetings. The adjustable and customizable slides provide unlimited possibilities for acing up your presentation. Slidegeeks has done all the homework before launching the product for you. So, do not wait, grab the presentation templates today

Playbook To Formulate Efficient Web Performance Measurement Metrics Diagrams PDF
Mentioned slide shows the major key performance indicators used by organizations to measure their website performance. Metrics covered are related to organic traffic, inbound leads, bounce rate. Slidegeeks has constructed Playbook To Formulate Efficient Web Performance Measurement Metrics Diagrams PDF after conducting extensive research and examination. These presentation templates are constantly being generated and modified based on user preferences and critiques from editors. Here, you will find the most attractive templates for a range of purposes while taking into account ratings and remarks from users regarding the content. This is an excellent jumping-off point to explore our content and will give new users an insight into our top-notch PowerPoint Templates.

Key Metrics To Measure Success Innovative Business Promotion Ideas Pictures Pdf
The following slide showcases key performance indicators KPIs through which marketers can evaluate the effectiveness of marketing tactics. The KPIs covered in the slide are website traffic, brand impressions, annual contract value, new leads in pipeline, gross profit, net profit, market share, attrition rate, and monthly active users. Slidegeeks has constructed Key Metrics To Measure Success Innovative Business Promotion Ideas Pictures Pdf after conducting extensive research and examination. These presentation templates are constantly being generated and modified based on user preferences and critiques from editors. Here, you will find the most attractive templates for a range of purposes while taking into account ratings and remarks from users regarding the content. This is an excellent jumping off point to explore our content and will give new users an insight into our top notch PowerPoint Templates.
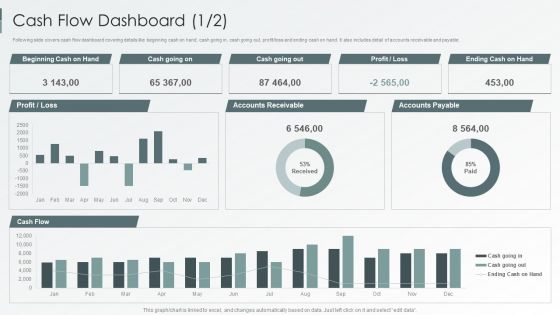
Enterprise Sustainability Performance Metrics Cash Flow Dashboard Inspiration PDF
Following slide covers cash flow dashboard covering details like beginning cash on hand, cash going in, cash going out, profit loss and ending cash on hand. It also includes detail of accounts receivable and payable.Deliver an awe inspiring pitch with this creative Enterprise Sustainability Performance Metrics Cash Flow Dashboard Inspiration PDF bundle. Topics like Accounts Receivable, Accounts Payable, Profit Loss can be discussed with this completely editable template. It is available for immediate download depending on the needs and requirements of the user.
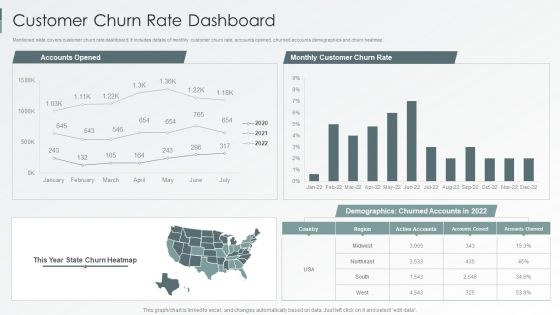
Enterprise Sustainability Performance Metrics Customer Churn Rate Dashboard Summary PDF
Mentioned slide covers customer churn rate dashboard. It includes details of monthly customer churn rate, accounts opened, churned accounts demographics and churn heatmap.Deliver an awe inspiring pitch with this creative Enterprise Sustainability Performance Metrics Customer Churn Rate Dashboard Summary PDF bundle. Topics like Accounts Opened, Demographics Churned, Monthly Customer can be discussed with this completely editable template. It is available for immediate download depending on the needs and requirements of the user.

Metrics To Measure Business Performance Customer Churn Rate Dashboard Background PDF
Mentioned slide covers customer churn rate dashboard. It includes details of monthly customer churn rate, accounts opened, churned accounts demographics and churn heatmap. Deliver an awe inspiring pitch with this creative Metrics To Measure Business Performance Customer Churn Rate Dashboard Background PDF bundle. Topics likeCustomer Churn Rate, Churn Heatmap, Churned Accounts can be discussed with this completely editable template. It is available for immediate download depending on the needs and requirements of the user.

Types And Metrics Of Performance Metrics Ppt PowerPoint Presentation File Infographics PDF
Slidegeeks has constructed Types And Metrics Of Performance Metrics Ppt PowerPoint Presentation File Infographics PDF after conducting extensive research and examination. These presentation templates are constantly being generated and modified based on user preferences and critiques from editors. Here, you will find the most attractive templates for a range of purposes while taking into account ratings and remarks from users regarding the content. This is an excellent jumping off point to explore our content and will give new users an insight into our top notch PowerPoint Templates.

Balance Sheet Metrics With Equity And Debt Ratio Ppt PowerPoint Presentation Infographics Background Image PDF
Presenting this set of slides with name balance sheet metrics with equity and debt ratio ppt powerpoint presentation infographics background image pdf. The topics discussed in these slides are total accounts receivable, total accounts payable, equity ratio, debt equity, current ratio, profit and loss summary, total accounts receivable and payable aging. This is a completely editable PowerPoint presentation and is available for immediate download. Download now and impress your audience.

Marketing Campaign Performance Measurement Dashboard Download PDF
This slide represents the dashboard showing the performance of search engine marketing campaign run by an organization. It includes key performance indicators such as account activity, campaigns by targeting, landing page speed, keyword relevancy, budget spendings etc. Showcasing this set of slides titled Marketing Campaign Performance Measurement Dashboard Download PDF. The topics addressed in these templates are Keyword Relevancy, Campaigns By Targeting, Budget. All the content presented in this PPT design is completely editable. Download it and make adjustments in color, background, font etc. as per your unique business setting.

Project Metrics Dashboard With Due Tasks Microsoft PDF
This slide shows the project management dashboard which includes hours taken by client, account manager, service, actual working hours, description of services such as web programming, search engine optimization, graphic designing, etc. Pitch your topic with ease and precision using this Project Metrics Dashboard With Due Tasks Microsoft PDF. This layout presents information on Service, Optimization, Graphic Design. It is also available for immediate download and adjustment. So, changes can be made in the color, design, graphics or any other component to create a unique layout.
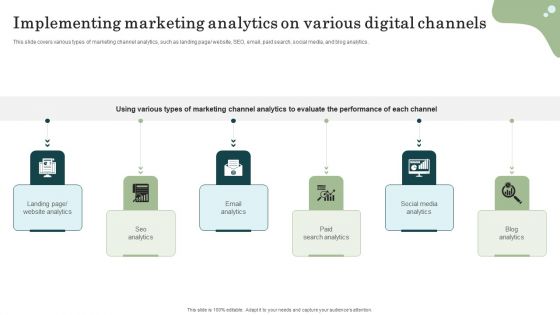
Marketing Success Metrics Implementing Marketing Analytics On Various Infographics PDF
This slide covers various types of marketing channel analytics, such as landing page or website, SEO, email, paid search, social media, and blog analytics. Slidegeeks has constructed Marketing Success Metrics Implementing Marketing Analytics On Various Infographics PDF after conducting extensive research and examination. These presentation templates are constantly being generated and modified based on user preferences and critiques from editors. Here, you will find the most attractive templates for a range of purposes while taking into account ratings and remarks from users regarding the content. This is an excellent jumping-off point to explore our content and will give new users an insight into our top-notch PowerPoint Templates.

Periodic Revenue Model Key Metrices For Forecasting In Recurring Revenue Model Portrait PDF
The purpose of the following slide is to display various metrices that can be used to forecast the performance of recurring revenue model. These metrices can be Annual recurring revenue, Customer churn rate, customer lifetime value, account expansion and contraction. Find a pre designed and impeccable Periodic Revenue Model Key Metrices For Forecasting In Recurring Revenue Model Portrait PDF. The templates can ace your presentation without additional effort. You can download these easy to edit presentation templates to make your presentation stand out from others. So, what are you waiting for Download the template from Slidegeeks today and give a unique touch to your presentation.
Cash Flow Metrics To Determine Firm Financial Health Ppt Icon PDF
This slide showcases KPIs that provides information on the potential and financial health of company. The KPIs covered are working capital, liquidity ratio, operating cashflow, days payable outstanding and account receivable turnover. Showcasing this set of slides titled Cash Flow Metrics To Determine Firm Financial Health Ppt Icon PDF. The topics addressed in these templates are Working Capital, Liquidity Ratio, Operating Cashflow. All the content presented in this PPT design is completely editable. Download it and make adjustments in color, background, font etc. as per your unique business setting.
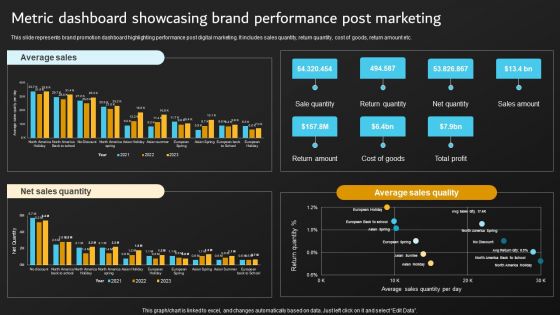
Implementation Of Digital Marketing Metric Dashboard Showcasing Brand Performance Diagrams PDF
This slide represents brand promotion dashboard highlighting performance post digital marketing. It includes sales quantity, return quantity, cost of goods, return amount etc. Slidegeeks has constructed Implementation Of Digital Marketing Metric Dashboard Showcasing Brand Performance Diagrams PDF after conducting extensive research and examination. These presentation templates are constantly being generated and modified based on user preferences and critiques from editors. Here, you will find the most attractive templates for a range of purposes while taking into account ratings and remarks from users regarding the content. This is an excellent jumping-off point to explore our content and will give new users an insight into our top-notch PowerPoint Templates.
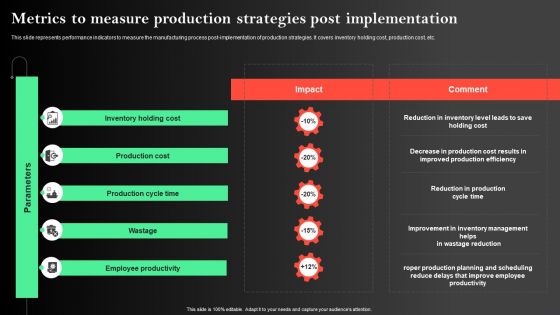
Manufacturing Operations Management Process Metrics To Measure Production Strategies Portrait PDF

Key Performance Metrics For Effective Sales Department Management To Enhance Performance Introduction PDF
This slide represents the key metrics for sales managers to easily measure the progress towards the achievement of sales objectives and targets. It includes KPIs related to outbound and inbound sales, account executives and customer success.Presenting Key Performance Metrics For Effective Sales Department Management To Enhance Performance Introduction PDF to dispense important information. This template comprises four stages. It also presents valuable insights into the topics including Consumer Happiness, Customer Lifetime, Outbound Sales. This is a completely customizable PowerPoint theme that can be put to use immediately. So, download it and address the topic impactfully.
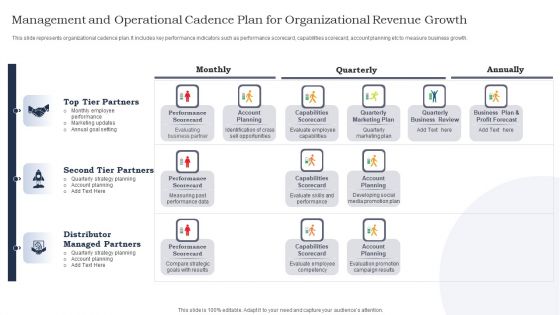
Management And Operational Cadence Plan For Organizational Revenue Growth Ppt Portfolio Example PDF
This slide represents organizational cadence plan. It includes key performance indicators such as performance scorecard, capabilities scorecard, account planning etc to measure business growth. Showcasing this set of slides titled Management And Operational Cadence Plan For Organizational Revenue Growth Ppt Portfolio Example PDF. The topics addressed in these templates are Top Tier Partners, Second Tier Partners, Distributor Managed Partners. All the content presented in this PPT design is completely editable. Download it and make adjustments in color, background, font etc. as per your unique business setting.
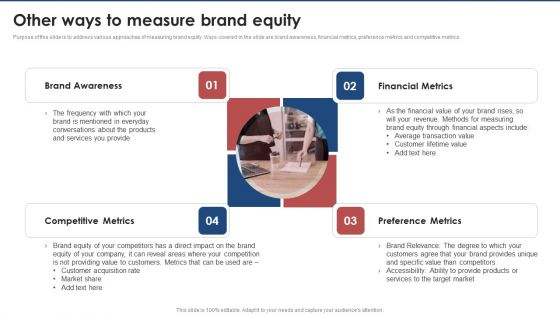
Other Ways To Measure Brand Equity Brand Value Estimation Guide Rules PDF
Purpose of this slide is to address various approaches of measuring brand equity. Ways covered in the slide are brand awareness, financial metrics, preference metrics and competitive metrics.Slidegeeks has constructed Other Ways To Measure Brand Equity Brand Value Estimation Guide Rules PDF after conducting extensive research and examination. These presentation templates are constantly being generated and modified based on user preferences and critiques from editors. Here, you will find the most attractive templates for a range of purposes while taking into account ratings and remarks from users regarding the content. This is an excellent jumping-off point to explore our content and will give new users an insight into our top-notch PowerPoint Templates.

Competitive Assessment Of Social Tactical Plan To Enhance Social Media Hiring Process Formats PDF
This slide represents competitive assessment of social recruitment metrics which includes cost per hire, engagement, quality and time to hire, sourcing channel efficiency and candidate experience.Slidegeeks has constructed Competitive Assessment Of Social Tactical Plan To Enhance Social Media Hiring Process Formats PDF after conducting extensive research and examination. These presentation templates are constantly being generated and modified based on user preferences and critiques from editors. Here, you will find the most attractive templates for a range of purposes while taking into account ratings and remarks from users regarding the content. This is an excellent jumping-off point to explore our content and will give new users an insight into our top-notch PowerPoint Templates.
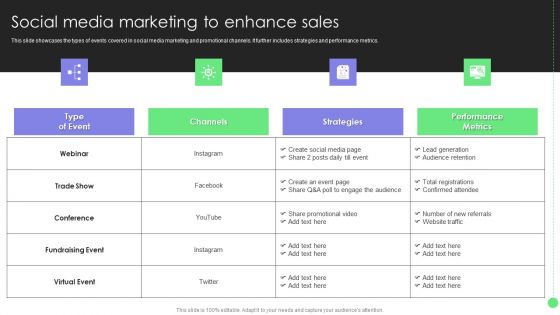
Comprehensive Guide For Launch Social Media Marketing To Enhance Sales Guidelines PDF
This slide showcases the types of events covered in social media marketing and promotional channels. It further includes strategies and performance metrics. Slidegeeks has constructed Comprehensive Guide For Launch Social Media Marketing To Enhance Sales Guidelines PDF after conducting extensive research and examination. These presentation templates are constantly being generated and modified based on user preferences and critiques from editors. Here, you will find the most attractive templates for a range of purposes while taking into account ratings and remarks from users regarding the content. This is an excellent jumping-off point to explore our content and will give new users an insight into our top-notch PowerPoint Templates.

Strategic Ecommerce Plan For B2B Enterprises B2b Sales Performance Tracking Dashboard Demonstration PDF
This slide represents metric dashboard to track sales performance on e-commerce website. It cover performance indicators such as sales breakdown, order breakdown, recurring sales etc. Slidegeeks has constructed Strategic Ecommerce Plan For B2B Enterprises B2b Sales Performance Tracking Dashboard Demonstration PDF after conducting extensive research and examination. These presentation templates are constantly being generated and modified based on user preferences and critiques from editors. Here, you will find the most attractive templates for a range of purposes while taking into account ratings and remarks from users regarding the content. This is an excellent jumping-off point to explore our content and will give new users an insight into our top-notch PowerPoint Templates.

Workforce Instruction Playbook Ensuring Effective Communication Training Among Sales Team Slides PDF
This slide provides information regarding effective communication among sales management team through weekly updates, monthly and quarterly review meetings. Presenting Workforce Instruction Playbook Ensuring Effective Communication Training Among Sales Team Slides PDF to provide visual cues and insights. Share and navigate important information on one stages that need your due attention. This template can be used to pitch topics like Team, Business Metrics, Account Strategy. In addtion, this PPT design contains high resolution images, graphics, etc, that are easily editable and available for immediate download.

Vendor Management Audit Supplier Audit Team Selection Matrix
Mentioned slide outlines various metrics that can be used by businesses for the selection of the audit team. It includes KPIs such as audit experience, knowledge, technical expertise, communication skills, etc, Slidegeeks has constructed Vendor Management Audit Supplier Audit Team Selection Matrix after conducting extensive research and examination. These presentation templates are constantly being generated and modified based on user preferences and critiques from editors. Here, you will find the most attractive templates for a range of purposes while taking into account ratings and remarks from users regarding the content. This is an excellent jumping-off point to explore our content and will give new users an insight into our top-notch PowerPoint Templates.

Risk Mitigation Strategy Analysis Metrics For Improving IT Security Ppt PowerPoint Presentation Gallery Gridlines PDF
Showcasing this set of slides titled risk mitigation strategy analysis metrics for improving it security ppt powerpoint presentation gallery gridlines pdf. The topics addressed in these templates are inactive user accounts, accounts without passwords, permissions. All the content presented in this PPT design is completely editable. Download it and make adjustments in color, background, font etc. as per your unique business setting.
Annual Financial Performance Administration Dashboard With Key Metrics Ppt PowerPoint Presentation Icon Visual Aids PDF
Showcasing this set of slides titled Annual Financial Performance Administration Dashboard With Key Metrics Ppt PowerPoint Presentation Icon Visual Aids PDF. The topics addressed in these templates are Accounts Receivable, Accounts Payable, Planned Profit Margin. All the content presented in this PPT design is completely editable. Download it and make adjustments in color, background, font etc. as per your unique business setting.
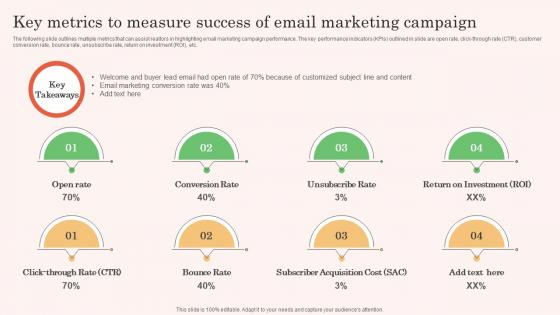
Key Metrics To Measure Success Of Email Real Estate Property Marketing Demonstration Pdf
The following slide outlines multiple metrics that can assist realtors in highlighting email marketing campaign performance. The key performance indicators KPIs outlined in slide are open rate, click-through rate CTR, customer conversion rate, bounce rate, unsubscribe rate, return on investment ROI, etc. Slidegeeks has constructed Key Metrics To Measure Success Of Email Real Estate Property Marketing Demonstration Pdf after conducting extensive research and examination. These presentation templates are constantly being generated and modified based on user preferences and critiques from editors. Here, you will find the most attractive templates for a range of purposes while taking into account ratings and remarks from users regarding the content. This is an excellent jumping-off point to explore our content and will give new users an insight into our top-notch PowerPoint Templates.

Key Metrics To Measure Success Of Email Marketing Campaign Out Of The Box Real Topics Pdf
The following slide outlines multiple metrics that can assist realtors in highlighting email marketing campaign performance. The key performance indicators KPIs outlined in slide are open rate, click-through rate CTR, customer conversion rate, bounce rate, unsubscribe rate, return on investment ROI, etc. Slidegeeks has constructed Key Metrics To Measure Success Of Email Marketing Campaign Out Of The Box Real Topics Pdf after conducting extensive research and examination. These presentation templates are constantly being generated and modified based on user preferences and critiques from editors. Here, you will find the most attractive templates for a range of purposes while taking into account ratings and remarks from users regarding the content. This is an excellent jumping-off point to explore our content and will give new users an insight into our top-notch PowerPoint Templates.

Metrics To Measure Business Performance Cash Flow Dashboard Rules PDF
Following slide covers cash flow dashboard covering details like beginning cash on hand, cash going in, cash going out, profit or loss and ending cash on hand. It also includes detail of accounts receivable and payable. Deliver an awe inspiring pitch with this creative Metrics To Measure Business Performance Cash Flow Dashboard Rules PDF bundle. Topics like Beginning Cash Hand, Cash Going Out, Accounts Payable, Accounts Receivable can be discussed with this completely editable template. It is available for immediate download depending on the needs and requirements of the user.

 Home
Home