Key Performance Indicators
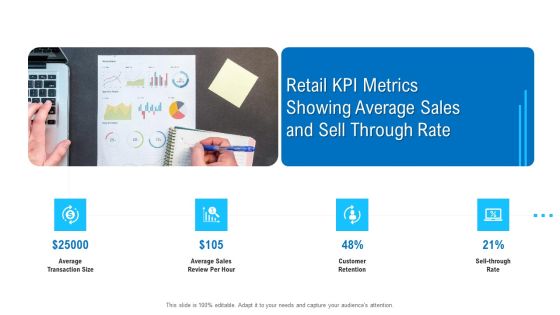
Merchandising Industry Analysis Retail KPI Metrics Showing Average Sales And Sell Through Rate Clipart PDF
Presenting merchandising industry analysis retail kpi metrics showing average sales and sell through rate clipart pdf to provide visual cues and insights. Share and navigate important information on four stages that need your due attention. This template can be used to pitch topics like average transaction size, average sales review per hour, customer retention. In addtion, this PPT design contains high resolution images, graphics, etc, that are easily editable and available for immediate download.
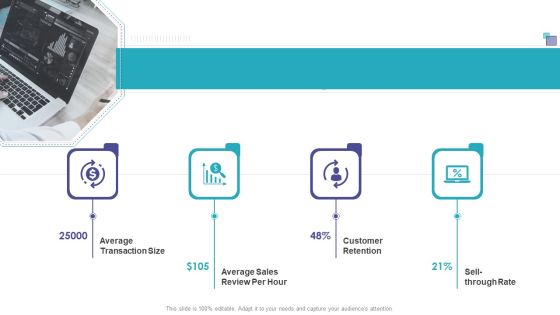
Retail KPI Metrics Showing Average Sales And Sell Through Rate Ppt Model Files PDF
This is a retail KPI metrics showing average sales and sell through rate ppt model files pdf. template with various stages. Focus and dispense information on four stages using this creative set, that comes with editable features. It contains large content boxes to add your information on topics like average transaction size, average sales review per hour, customer retention. You can also showcase facts, figures, and other relevant content using this PPT layout. Grab it now.

Retail KPI Metrics Showing Average Sales And Sell Through Rate Ppt Portfolio Skills PDF
This is a retail kpi metrics showing average sales and sell through rate ppt portfolio skills pdf. template with various stages. Focus and dispense information on four stages using this creative set, that comes with editable features. It contains large content boxes to add your information on topics like average transaction size, average sales review per hour. You can also showcase facts, figures, and other relevant content using this PPT layout. Grab it now.

Healthcare Management Healthcare Management KPI Metrics Showing Incidents Length Of Stay Ppt Outline Slide Portrait PDF
This is a healthcare management healthcare management kpi metrics showing incidents length of stay ppt outline slide portrait pdf template with various stages. Focus and dispense information on four stages using this creative set, that comes with editable features. It contains large content boxes to add your information on topics like incidents, average waiting time, avg length of stay, overall patient satisfaction. You can also showcase facts, figures, and other relevant content using this PPT layout. Grab it now.
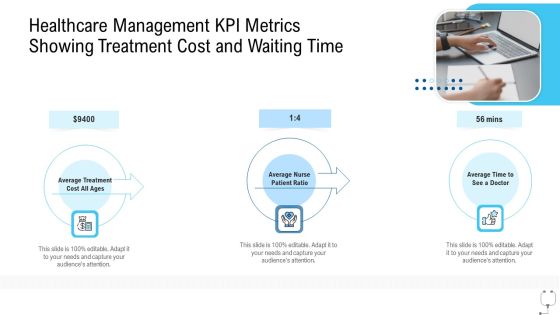
Healthcare Management Healthcare Management KPI Metrics Showing Treatment Cost And Waiting Time Ppt Infographics Example PDF
Presenting healthcare management healthcare management kpi metrics showing treatment cost and waiting time ppt infographics example pdf to provide visual cues and insights. Share and navigate important information on three stages that need your due attention. This template can be used to pitch topics like average treatment cost all ages, average nurse patient ratio, average time to see a doctor. In addtion, this PPT design contains high resolution images, graphics, etc, that are easily editable and available for immediate download.

Hospital Administration Healthcare Management KPI Metrics Showing Incidents Length Of Stay Ppt File Introduction PDF
This is a hospital administration healthcare management kpi metrics showing incidents length of stay ppt file introduction pdf template with various stages. Focus and dispense information on four stages using this creative set, that comes with editable features. It contains large content boxes to add your information on topics like incidents, average waiting time, avg length of stay, overall patient satisfaction. You can also showcase facts, figures, and other relevant content using this PPT layout. Grab it now.
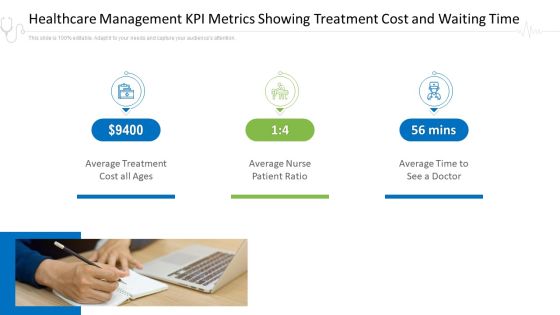
Hospital Administration Healthcare Management KPI Metrics Showing Treatment Cost And Waiting Time Ppt Layouts Example PDF
Presenting hospital administration healthcare management kpi metrics showing treatment cost and waiting time ppt layouts example pdf to provide visual cues and insights. Share and navigate important information on three stages that need your due attention. This template can be used to pitch topics like average treatment cost all ages, average nurse patient ratio, average time to see a doctor. In addtion, this PPT design contains high resolution images, graphics, etc, that are easily editable and available for immediate download.

Financial Functional Assessment Infrastructure KPI Metrics Showing Cost Saving Professional PDF
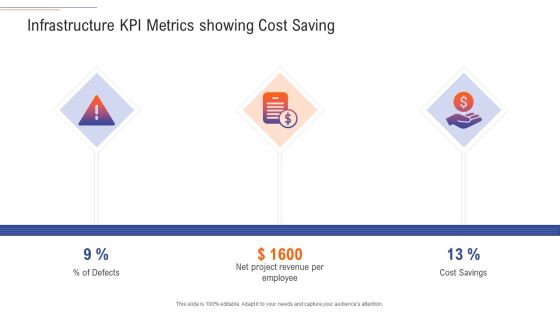
This is a financial functional assessment infrastructure kpi metrics showing cost saving professional pdf template with various stages. Focus and dispense information on three stages using this creative set, that comes with editable features. It contains large content boxes to add your information on topics like cost savings, net project revenue, defects. You can also showcase facts, figures, and other relevant content using this PPT layout. Grab it now.

Infrastructure Building Administration Infrastructure KPI Metrics Showing Cost Saving Demonstration PDF
This is a infrastructure building administration infrastructure kpi metrics showing cost saving demonstration pdf template with various stages. Focus and dispense information on three stages using this creative set, that comes with editable features. It contains large content boxes to add your information on topics like project revenue per employee, savings, cost defects. You can also showcase facts, figures, and other relevant content using this PPT layout. Grab it now.

Construction Management Services Infrastructure KPI Metrics Showing Cost Saving Elements PDF
This is a construction management services infrastructure kpi metrics showing cost saving elements pdf template with various stages. Focus and dispense information on three stages using this creative set, that comes with editable features. It contains large content boxes to add your information on topics like defects, project revenue, cost savings. You can also showcase facts, figures, and other relevant content using this PPT layout. Grab it now.

Infrastructure Designing And Administration Infrastructure KPI Metrics Showing Cost Saving Download PDF
This is a infrastructure designing and administration infrastructure kpi metrics showing cost saving download pdf template with various stages. Focus and dispense information on three stages using this creative set, that comes with editable features. It contains large content boxes to add your information on topics like percent of defects, net project revenue per employee, cost savings. You can also showcase facts, figures, and other relevant content using this PPT layout. Grab it now.
Support Services Management Infrastructure KPI Metrics Showing Cost Saving Diagrams PDF
This is a support services management infrastructure kpi metrics showing cost saving diagrams pdf template with various stages. Focus and dispense information on three stages using this creative set, that comes with editable features. It contains large content boxes to add your information on topics like percent of defects, net project revenue per employee, cost savings. You can also showcase facts, figures, and other relevant content using this PPT layout. Grab it now.

Pharmaceutical Management Healthcare Management KPI Metrics Showing Incidents Length Of Stay Ppt Gallery Example PDF
This is a pharmaceutical management healthcare management kpi metrics showing incidents length of stay ppt gallery example pdf template with various stages. Focus and dispense information on four stages using this creative set, that comes with editable features. It contains large content boxes to add your information on topics like incidents, average waiting time, avg length of stay, overall patient satisfaction. You can also showcase facts, figures, and other relevant content using this PPT layout. Grab it now.

Pharmaceutical Management Healthcare Management KPI Metrics Showing Treatment Cost And Waiting Time Ppt Ideas Format PDF
Presenting pharmaceutical management healthcare management kpi metrics showing treatment cost and waiting time ppt ideas format pdf to provide visual cues and insights. Share and navigate important information on three stages that need your due attention. This template can be used to pitch topics like average treatment cost all ages, average nurse patient ratio, average time to see a doctor. In addtion, this PPT design contains high resolution images, graphics, etc, that are easily editable and available for immediate download.
Marketing Outlining Segmentation Initiatives Kpi Dashboard To Monitor Sales Opportunities Information PDF
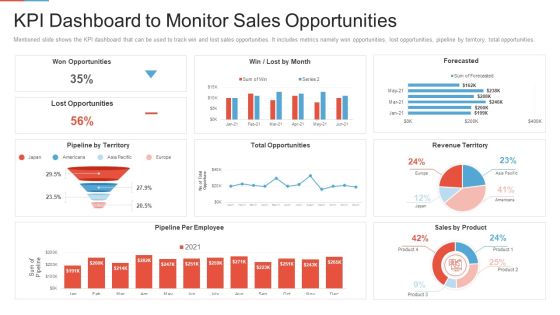
Mentioned slide shows the KPI dashboard that can be used to track win and lost sales opportunities. It includes metrics namely won opportunities, lost opportunities, pipeline by territory, total opportunities. Deliver an awe inspiring pitch with this creative marketing outlining segmentation initiatives kpi dashboard to monitor sales opportunities information pdf bundle. Topics like opportunities, pipeline by territory, revenue territory, sales by product, pipeline per employee can be discussed with this completely editable template. It is available for immediate download depending on the needs and requirements of the user.

Investment Project KPI Dashboard With Labor Hour And Cost Analysis Portrait PDF
This slide displays KPI dashboard for project health analysis. It also include metrics such as total projects, cost, progress, status, projects by highest actual hours, highest actual labour cost, highest actual non-labour cost, etc. Pitch your topic with ease and precision using this Investment Project KPI Dashboard With Labor Hour And Cost Analysis Portrait PDF. This layout presents information on Project Health, Project Progress, Project Status. It is also available for immediate download and adjustment. So, changes can be made in the color, design, graphics or any other component to create a unique layout.
Optimizing Marketing Analytics To Enhance Organizational Growth KPI Dashboard For Tracking Paid Ad Campaign Template PDF
This slide covers the KPI dashboard for analyzing SEO metrics such as authority score, organic traffic, organic keywords, paid keywords, ref. Domains, site audit, link-building tool, organic traffic, on-page SEO checker, backlink audit, etc. There are so many reasons you need a Optimizing Marketing Analytics To Enhance Organizational Growth KPI Dashboard For Tracking Paid Ad Campaign Template PDF. The first reason is you can not spend time making everything from scratch, Thus, Slidegeeks has made presentation templates for you too. You can easily download these templates from our website easily.

Online PR Techniques To Boost Brands Online Visibility KPI Dashboard To Track PR Marketing Summary PDF
This slide shows dashboard which can be used by organizations to measure the results of public relation strategy. It includes metrics such as media coverage rate, social media engagement rate, share of voice and brand mentions. Make sure to capture your audiences attention in your business displays with our gratis customizable Online PR Techniques To Boost Brands Online Visibility KPI Dashboard To Track PR Marketing Summary PDF. These are great for business strategies, office conferences, capital raising or task suggestions. If you desire to acquire more customers for your tech business and ensure they stay satisfied, create your own sales presentation with these plain slides.
Devops Tools And Configuration IT Kpi Dashboard For Monitoring Software Development Slides PDF
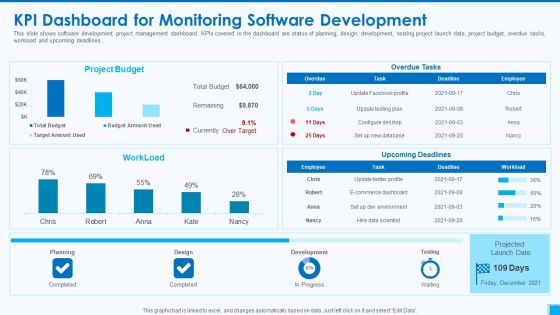
This slide shows software development project management dashboard. KPIs covered in the dashboard are status of planning, design, development, testing project launch date, project budget, overdue tasks, workload and upcoming deadlines. Deliver and pitch your topic in the best possible manner with this devops tools and configuration it kpi dashboard for monitoring software development slides pdf. Use them to share invaluable insights on project budget, planning, design, development and impress your audience. This template can be altered and modified as per your expectations. So, grab it now.
Metrics And Objectives To Measure Social Media Marketing Strategy Structure PDF
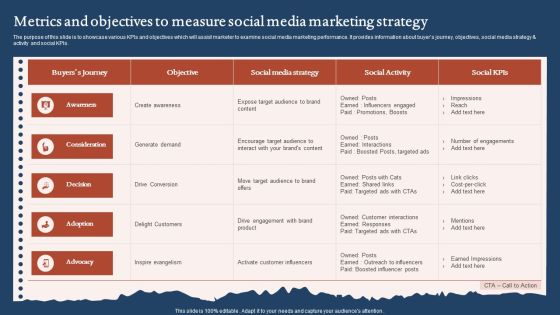
The purpose of this slide is to showcase various KPIs and objectives which will assist marketer to examine social media marketing performance. It provides information about buyers journey, objectives, social media strategy and activity and social KPIs. Pitch your topic with ease and precision using this Metrics And Objectives To Measure Social Media Marketing Strategy Structure PDF. This layout presents information on Awareness, Consideration, Advocacy. It is also available for immediate download and adjustment. So, changes can be made in the color, design, graphics or any other component to create a unique layout.

AI And ML Driving Monetary Value For Organization Customer Service Management Kpi Dashboard Formats PDF
Following slide illustrates customer service dashboard. It includes KPIs such as request answered, customer satisfaction, average time to solve an issue, costs per support and customer retention. Deliver and pitch your topic in the best possible manner with this ai and ml driving monetary value for organization customer service management kpi dashboard formats pdf. Use them to share invaluable insights on customer retention, cost per support, customer satisfaction, cost to revenue and impress your audience. This template can be altered and modified as per your expectations. So, grab it now.

Marketers Guide To Data Analysis Optimization Social Media Analytics KPI Dashboard Clipart PDF
This slide covers a dashboard for tracking social media KPIs such as face engagements, total likes, followers, audience growth, YouTube subscribers, views, Instagram reach and , likes, LinkedIn impressions, etc. Find a pre designed and impeccable Marketers Guide To Data Analysis Optimization Social Media Analytics KPI Dashboard Clipart PDF. The templates can ace your presentation without additional effort. You can download these easy to edit presentation templates to make your presentation stand out from others. So, what are you waiting for Download the template from Slidegeeks today and give a unique touch to your presentation.

Corporate Human Resource Audit Dashboard Introduction PDF
This slide illustrates HR statistics of a company. it includes department-wise strength, total salary, bonus, overtime, average performance, sick days etc. Showcasing this set of slides titled Corporate Human Resource Audit Dashboard Introduction PDF. The topics addressed in these templates are Human Resources, Department, Strength. All the content presented in this PPT design is completely editable. Download it and make adjustments in color, background, font etc. as per your unique business setting.

KPI To Measure Advertisement Plan For Catering Business Clipart PDF
This template shows the various KPIs to evaluate catering companies. The purpose of this slide to compare the benchmark target with actually achieved target. It includes KPIs such as event counts, sales, labor cost, cost per click, etc. Pitch your topic with ease and precision using this KPI To Measure Advertisement Plan For Catering Business Clipart PDF. This layout presents information on Objective, Benchmark, Actual . It is also available for immediate download and adjustment. So, changes can be made in the color, design, graphics or any other component to create a unique layout.

Cyber Risks And Incident Response Playbook KPI Dashboard To Track Department Wise Security Incidents Mockup PDF
Mentioned slide portrays KPI dashboard that can be used to monitor department wise security incidents. KPIs covered are new cases, total cases, resolved and pending cases. Presenting this PowerPoint presentation, titled Cyber Risks And Incident Response Playbook KPI Dashboard To Track Department Wise Security Incidents Mockup PDF, with topics curated by our researchers after extensive research. This editable presentation is available for immediate download and provides attractive features when used. Download now and captivate your audience. Presenting this Cyber Risks And Incident Response Playbook KPI Dashboard To Track Department Wise Security Incidents Mockup PDF. Our researchers have carefully researched and created these slides with all aspects taken into consideration. This is a completely customizable Cyber Risks And Incident Response Playbook KPI Dashboard To Track Department Wise Security Incidents Mockup PDF that is available for immediate downloading. Download now and make an impact on your audience. Highlight the attractive features available with our PPTs.

Strategies For Dynamic Supply Chain Agility Supply Chain Kpi Dashboard For Effective Financial Analysis Demonstration PDF
Mentioned slide illustrates KPI dashboard that can be used by managers to assess financial health of supply chain business. KPIs covered are supply chain costs versus sales, cash to order cycle, warehouse operating cost distribution etc. The Strategies For Dynamic Supply Chain Agility Supply Chain Kpi Dashboard For Effective Financial Analysis Demonstration PDF is a compilation of the most recent design trends as a series of slides. It is suitable for any subject or industry presentation, containing attractive visuals and photo spots for businesses to clearly express their messages. This template contains a variety of slides for the user to input data, such as structures to contrast two elements, bullet points, and slides for written information. Slidegeeks is prepared to create an impression.

Product Cost Management PCM Cost Management KPI Metrics Showing Return On Investment Ppt Visual Aids Inspiration PDF
This is a product cost management pcm cost management kpi metrics showing return on investment ppt visual aids inspiration pdf template with various stages. Focus and dispense information on four stages using this creative set, that comes with editable features. It contains large content boxes to add your information on topics like performed, cost, investment, variance, return. You can also showcase facts, figures, and other relevant content using this PPT layout. Grab it now.
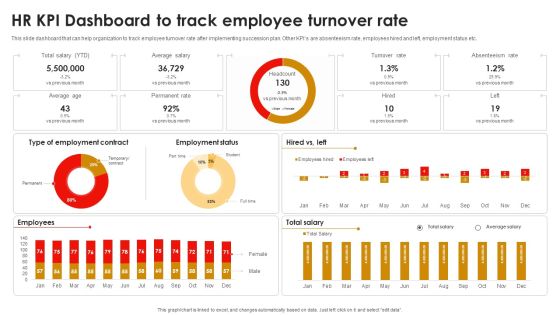
Strategic Talent Development HR KPI Dashboard To Track Employee Turnover Rate Summary PDF
This slide dashboard that can help organization to track employee turnover rate after implementing succession plan. Other KPIs are absenteeism rate, employees hired and left, employment status etc. This modern and well-arranged Strategic Talent Development HR KPI Dashboard To Track Employee Turnover Rate Summary PDF provides lots of creative possibilities. It is very simple to customize and edit with the Powerpoint Software. Just drag and drop your pictures into the shapes. All facets of this template can be edited with Powerpoint, no extra software is necessary. Add your own material, put your images in the places assigned for them, adjust the colors, and then you can show your slides to the world, with an animated slide included.

Implementing Management System To Enhance Ecommerce Processes Customer Checkout Behavior KPI Dashboard Clipart PDF
This slide represents the dashboard to help management in analyzing the point at which customers leave the checkout process. It includes details related to KPIs such as shipping drop-off, payment drop-off etc. This modern and well arranged Implementing Management System To Enhance Ecommerce Processes Customer Checkout Behavior KPI Dashboard Clipart PDF provides lots of creative possibilities. It is very simple to customize and edit with the Powerpoint Software. Just drag and drop your pictures into the shapes. All facets of this template can be edited with Powerpoint no extra software is necessary. Add your own material, put your images in the places assigned for them, adjust the colors, and then you can show your slides to the world, with an animated slide included.
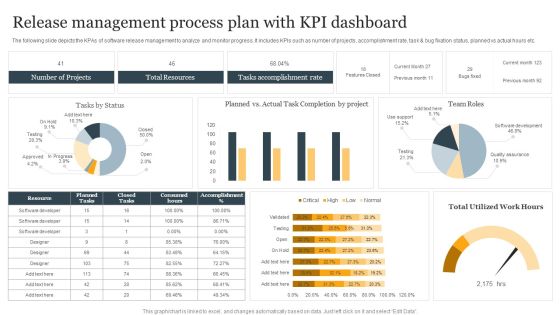
Release Management Process Plan With KPI Dashboard Ppt Infographic Template Structure PDF
The following slide depicts the KPAs of software release management to analyze and monitor progress. It includes KPIs such as number of projects, accomplishment rate, task and bug fixation status, planned vs actual hours etc. Showcasing this set of slides titled Release Management Process Plan With KPI Dashboard Ppt Infographic Template Structure PDF. The topics addressed in these templates are Number Of Projects, Total Resources, Tasks Accomplishment Rate. All the content presented in this PPT design is completely editable. Download it and make adjustments in color, background, font etc. as per your unique business setting.

Adjusting Financial Strategies And Planning KPI Dashboard To Analyze Financial Improvements Inspiration PDF
This slide showcases the KPIs that would help our business organization to evaluate improvements with the new financial strategy implementation. It includes total income, total expenses, accounts receivable, etc. The best PPT templates are a great way to save time, energy, and resources. Slidegeeks have 100 percent editable powerpoint slides making them incredibly versatile. With these quality presentation templates, you can create a captivating and memorable presentation by combining visually appealing slides and effectively communicating your message. Download Adjusting Financial Strategies And Planning KPI Dashboard To Analyze Financial Improvements Inspiration PDF from Slidegeeks and deliver a wonderful presentation.

Kpi Dashboard Highlighting Results Of Human Resource Training Administration Background PDF
Mentioned slide outlines a dashboard through which the organization can track and evaluate the results of Human Resource Training Administration. It provides information about metrics such as training budget, total cost, cost per participant, total hours of training, etc. Showcasing this set of slides titled Kpi Dashboard Highlighting Results Of Human Resource Training Administration Background PDF. The topics addressed in these templates are Actual Cost Vs, Training Budget, Approved Training Budget, Online Training. All the content presented in this PPT design is completely editable. Download it and make adjustments in color, background, font etc. as per your unique business setting.

Business Metrics Dashboard Slide Powerpoint Templates
This is a business metrics dashboard slide powerpoint templates. This is a five stage process. The stages in this process are cash flow, turnover, productivity, customer satisfaction, net income.

Business Analysis Data Charts And Reports Ppt Powerpoint Presentation Ideas Portrait
This is a business analysis data charts and reports ppt powerpoint presentation ideas portrait. This is a three stage process. The stages in this process are business metrics, business kpi, business dashboard.

Calculator With Business Reports For Operational Efficiency Ppt Powerpoint Presentation Ideas Infographic Template
This is a calculator with business reports for operational efficiency ppt powerpoint presentation ideas infographic template. This is a four stage process. The stages in this process are business metrics, business kpi, business dashboard.

Computer Screen With Business Data Charts Ppt Powerpoint Presentation Show Vector
This is a computer screen with business data charts ppt powerpoint presentation show vector. This is a four stage process. The stages in this process are business metrics, business kpi, business dashboard.

Essentials Of Statistics For Business And Economics Ppt Powerpoint Presentation Pictures Styles
This is a essentials of statistics for business and economics ppt powerpoint presentation pictures styles. This is a three stage process. The stages in this process are business metrics, business kpi, business dashboard.

KPI Dashboard To Track Process Products Sold By Insurance Topics PDF
This slide shows dashboard which can be used to compare insurance sales of current and previous year. It includes metrics such as monthly policy status, quarterly premium revenue, overall policy status, etc. Pitch your topic with ease and precision using this KPI Dashboard To Track Process Products Sold By Insurance Topics PDF. This layout presents information on Overall Policy Status, Quarterly Premium Revenue, Monthly Policy Status. It is also available for immediate download and adjustment. So, changes can be made in the color, design, graphics or any other component to create a unique layout.

Kpi Dashboard To Track Applicant Selection Process Ppt PowerPoint Presentation File Graphics Template PDF
This slide shows dashboard which can be used to monitor the progress of recruitment process. It includes metrics such as applications received, shortlisted applicant, selected candidates, etc. Pitch your topic with ease and precision using this Kpi Dashboard To Track Applicant Selection Process Ppt PowerPoint Presentation File Graphics Template PDF. This layout presents information on Applications Received, Shortlisted Candidates, Selected Candidates. It is also available for immediate download and adjustment. So, changes can be made in the color, design, graphics or any other component to create a unique layout.

Measuring Ab Testing Solution With Saas Company KPI Dashboard Guidelines PDF
The purpose of this slide is to showcase SaaS metrics dashboard which can assist the corporations to make changes in product to improve user experience. It covers information about weighted satisfaction score, positive satisfaction rating, etc. Pitch your topic with ease and precision using this Measuring Ab Testing Solution With Saas Company KPI Dashboard Guidelines PDF. This layout presents information on Lifetime Value Customer, Positive Satisfaction Rating, Save Widget, Weighted Satisfaction Score. It is also available for immediate download and adjustment. So, changes can be made in the color, design, graphics or any other component to create a unique layout.
Providing Efficient Client Services Kpi Dashboard For Tracking Customer Retention Diagrams PDF
This slide covers the dashboard for analyzing customer loyalty with metrics such as NPS, loyal customer rate, premium users, CLV, customer churn, revenue churn, net retention, MRR growth, etc. Take your projects to the next level with our ultimate collection of Providing Efficient Client Services Kpi Dashboard For Tracking Customer Retention Diagrams PDF. Slidegeeks has designed a range of layouts that are perfect for representing task or activity duration, keeping track of all your deadlines at a glance. Tailor these designs to your exact needs and give them a truly corporate look with your own brand colors they will make your projects stand out from the rest.
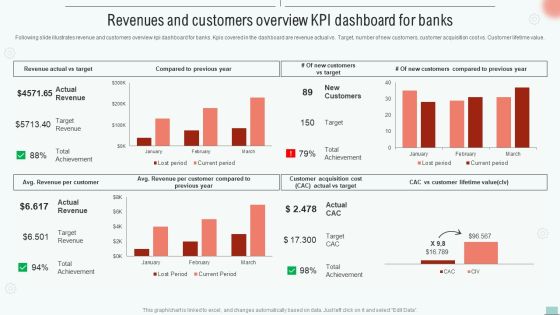
Implementing BPM Tool To Enhance Operational Efficiency Revenues And Customers Overview Kpi Dashboard Rules PDF
Following slide illustrates revenue and customers overview kpi dashboard for banks. Kpis covered in the dashboard are revenue actual vs. Target, number of new customers, customer acquisition cost vs. Customer lifetime value.This Implementing BPM Tool To Enhance Operational Efficiency Revenues And Customers Overview Kpi Dashboard Rules PDF is perfect for any presentation, be it in front of clients or colleagues. It is a versatile and stylish solution for organizing your meetings. The Implementing BPM Tool To Enhance Operational Efficiency Revenues And Customers Overview Kpi Dashboard Rules PDF features a modern design for your presentation meetings. The adjustable and customizable slides provide unlimited possibilities for acing up your presentation. Slidegeeks has done all the homework before launching the product for you. So, do not wait, grab the presentation templates today.

KPI Dashboard To Analyze Results Of Paid Social Media Advertising Rules PDF
This slide covers a comprehensive dashboard that can be used to examine the success rate of the paid social media plan. The metrics mentioned in the dashboard are impressions, cost, clicks, cost per click, conversions, cost per conversion, etc. Presenting this PowerPoint presentation, titled KPI Dashboard To Analyze Results Of Paid Social Media Advertising Rules PDF, with topics curated by our researchers after extensive research. This editable presentation is available for immediate download and provides attractive features when used. Download now and captivate your audience. Presenting this KPI Dashboard To Analyze Results Of Paid Social Media Advertising Rules PDF. Our researchers have carefully researched and created these slides with all aspects taken into consideration. This is a completely customizable KPI Dashboard To Analyze Results Of Paid Social Media Advertising Rules PDF that is available for immediate downloading. Download now and make an impact on your audience. Highlight the attractive features available with our PPTs.

Meter Gauge Icon For Energy Consumption Statistics Diagrams PDF
Presenting Meter Gauge Icon For Energy Consumption Statistics Diagrams PDF to dispense important information. This template comprises three stages. It also presents valuable insights into the topics including Meter Gauge, Icon For Energy, Consumption Statistics. This is a completely customizable PowerPoint theme that can be put to use immediately. So, download it and address the topic impactfully.

Kpi Dashboard To Track Department Wise Improving Cybersecurity With Incident Guidelines PDF
Mentioned slide portrays KPI dashboard that can be used to monitor department wise security incidents. KPIs covered are new cases, total cases, resolved and pending cases.This Kpi Dashboard To Track Department Wise Improving Cybersecurity With Incident Guidelines PDF is perfect for any presentation, be it in front of clients or colleagues. It is a versatile and stylish solution for organizing your meetings. The Kpi Dashboard To Track Department Wise Improving Cybersecurity With Incident Guidelines PDF features a modern design for your presentation meetings. The adjustable and customizable slides provide unlimited possibilities for acing up your presentation. Slidegeeks has done all the homework before launching the product for you. So, do not wait, grab the presentation templates today

Steps To Effectively Conduct Market Research KPI Dashboard To Analyze Customer Satisfaction Introduction PDF
The following slide outlines a comprehensive visual representation of customer satisfaction CSAT that can assist companies to measure how happy are customers wit the brand. The KPIs covered are net promoter score NPS, customer effort score CES, product quality, pricing, etc. Presenting this PowerPoint presentation, titled Steps To Effectively Conduct Market Research KPI Dashboard To Analyze Customer Satisfaction Introduction PDF, with topics curated by our researchers after extensive research. This editable presentation is available for immediate download and provides attractive features when used. Download now and captivate your audience. Presenting this Steps To Effectively Conduct Market Research KPI Dashboard To Analyze Customer Satisfaction Introduction PDF. Our researchers have carefully researched and created these slides with all aspects taken into consideration. This is a completely customizable Steps To Effectively Conduct Market Research KPI Dashboard To Analyze Customer Satisfaction Introduction PDF that is available for immediate downloading. Download now and make an impact on your audience. Highlight the attractive features available with our PPTs.

Comprehensive Guide To Enhance Kpi Dashboard To Monitor Sales Opportunities Information PDF
Mentioned slide shows the KPI dashboard that can be used to track win and lost sales opportunities. It includes metrics namely won opportunities, lost opportunities, pipeline by territory, total opportunities. Are you searching for a Comprehensive Guide To Enhance Kpi Dashboard To Monitor Sales Opportunities Information PDF that is uncluttered, straightforward, and original Its easy to edit, and you can change the colors to suit your personal or business branding. For a presentation that expresses how much effort youve put in, this template is ideal With all of its features, including tables, diagrams, statistics, and lists, its perfect for a business plan presentation. Make your ideas more appealing with these professional slides. Download Comprehensive Guide To Enhance Kpi Dashboard To Monitor Sales Opportunities Information PDF from Slidegeeks today.
Marketers Guide To Data Analysis Optimization KPI Dashboard For Tracking Email Marketing Campaign Infographics PDF
This slide covers the dashboard for analyzing email marketing metrics such as overall open rate, click-through rate, click-to-open ratio, unsubscribe rate, hard bounce rate, soft rate, monthly open rate, total monthly subscribers, etc. Presenting this PowerPoint presentation, titled Marketers Guide To Data Analysis Optimization KPI Dashboard For Tracking Email Marketing Campaign Infographics PDF, with topics curated by our researchers after extensive research. This editable presentation is available for immediate download and provides attractive features when used. Download now and captivate your audience. Presenting this Marketers Guide To Data Analysis Optimization KPI Dashboard For Tracking Email Marketing Campaign Infographics PDF. Our researchers have carefully researched and created these slides with all aspects taken into consideration. This is a completely customizable Marketers Guide To Data Analysis Optimization KPI Dashboard For Tracking Email Marketing Campaign Infographics PDF that is available for immediate downloading. Download now and make an impact on your audience. Highlight the attractive features available with our PPTs.

KPI Dashboard To Track Risk Events Ppt Layouts Format Ideas PDF
This slide displays KPI dashboard that can be used by a firm to track multiple risk events. Metrics covered in the dashboard are residual risks by period and risk category by total risk rating. Crafting an eye-catching presentation has never been more straightforward. Let your presentation shine with this tasteful yet straightforward KPI Dashboard To Track Risk Events Ppt Layouts Format Ideas PDF template. It offers a minimalistic and classy look that is great for making a statement. The colors have been employed intelligently to add a bit of playfulness while still remaining professional. Construct the ideal KPI Dashboard To Track Risk Events Ppt Layouts Format Ideas PDF that effortlessly grabs the attention of your audience Begin now and be certain to wow your customers

Work Order Management Metric Dashboard Organization Physical Assets Template PDF
This slide represents KPI dashboard for work tracking and management. It covers metrics such as project health, time status, tasks, cost, progress and workload. Boost your pitch with our creative Work Order Management Metric Dashboard Organization Physical Assets Template PDF. Deliver an awe-inspiring pitch that will mesmerize everyone. Using these presentation templates you will surely catch everyones attention. You can browse the ppts collection on our website. We have researchers who are experts at creating the right content for the templates. So you do not have to invest time in any additional work. Just grab the template now and use them.

Kpi Dashboard To Monitor Sales Opportunities Strategic Promotion Plan To Improve Product Diagrams PDF
Mentioned slide shows the KPI dashboard that can be used to track win and lost sales opportunities. It includes metrics namely won opportunities, lost opportunities, pipeline by territory, total opportunities.Explore a selection of the finest Kpi Dashboard To Monitor Sales Opportunities Strategic Promotion Plan To Improve Product Diagrams PDF here. With a plethora of professionally designed and pre-made slide templates, you can quickly and easily find the right one for your upcoming presentation. You can use our Kpi Dashboard To Monitor Sales Opportunities Strategic Promotion Plan To Improve Product Diagrams PDF to effectively convey your message to a wider audience. Slidegeeks has done a lot of research before preparing these presentation templates. The content can be personalized and the slides are highly editable. Grab templates today from Slidegeeks.
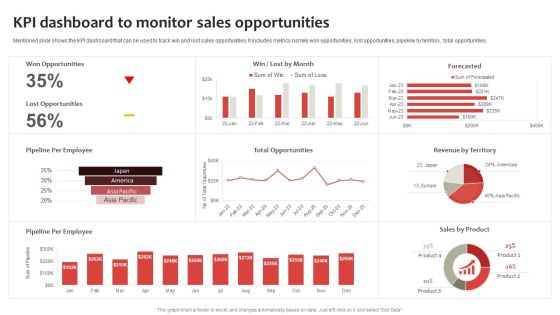
Strategic Plan To Establish And Promote Brand Awareness Kpi Dashboard To Monitor Sales Opportunities Background PDF
Mentioned slide shows the KPI dashboard that can be used to track win and lost sales opportunities. It includes metrics namely won opportunities, lost opportunities, pipeline by territory, total opportunities. Get a simple yet stunning designed Strategic Plan To Establish And Promote Brand Awareness Kpi Dashboard To Monitor Sales Opportunities Background PDF. It is the best one to establish the tone in your meetings. It is an excellent way to make your presentations highly effective. So, download this PPT today from Slidegeeks and see the positive impacts. Our easy to edit Strategic Plan To Establish And Promote Brand Awareness Kpi Dashboard To Monitor Sales Opportunities Background PDF can be your go to option for all upcoming conferences and meetings. So, what are you waiting for Grab this template today.

Project Kpis Dashboards Project Budget Man Hours And Issues Ppt PowerPoint Presentation Professional Design Inspiration
This is a project kpis dashboards project budget man hours and issues ppt powerpoint presentation professional design inspiration. This is a four stage process. The stages in this process are project dashboard, project kpis, project metrics.

Dashboard With Business Icons Powerpoint Slides
This PowerPoint template graphics of meter chart with business icons. Download this PPT chart to simplify business data analysis. This PowerPoint slide is of great help in the business sector to make realistic presentations and provides effective way of presenting your newer thoughts.
Kpi Dashboard For Tracking Monthly Personal Finances Ppt Outline Graphics Example PDF
This slide shows dashboard which can be used by individuals to track monthly expenses in order to get better understanding of his or her finances. It includes metrics such as users spending, savings, debt, etc. Welcome to our selection of the Kpi Dashboard For Tracking Monthly Personal Finances Ppt Outline Graphics Example PDF. These are designed to help you showcase your creativity and bring your sphere to life. Planning and Innovation are essential for any business that is just starting out. This collection contains the designs that you need for your everyday presentations. All of our PowerPoints are 100 percent editable, so you can customize them to suit your needs. This multi purpose template can be used in various situations. Grab these presentation templates today.

BPM Tools Application To Increase Revenues And Customers Overview KPI Dashboard For Banks Clipart PDF
Following slide illustrates revenue and customers overview kip dashboard for banks. KPIs covered in the dashboard are revenue actual vs. target, number of new customers, customer acquisition cost vs. customer lifetime value. Get a simple yet stunning designed BPM Tools Application To Increase Revenues And Customers Overview KPI Dashboard For Banks Clipart PDF. It is the best one to establish the tone in your meetings. It is an excellent way to make your presentations highly effective. So, download this PPT today from Slidegeeks and see the positive impacts. Our easy-to-edit BPM Tools Application To Increase Revenues And Customers Overview KPI Dashboard For Banks Clipart PDF can be your go-to option for all upcoming conferences and meetings. So, what are you waiting for Grab this template today.

Dashboard Related To Logistic Company Date Introduction PDF
This slide shows the dashboard related to the ABC logistic company which includes order status, global financial performance, volume, inventory details, etc. Deliver and pitch your topic in the best possible manner with this dashboard related to logistic company date introduction pdf. Use them to share invaluable insights on dashboard related to logistic company and impress your audience. This template can be altered and modified as per your expectations. So, grab it now.
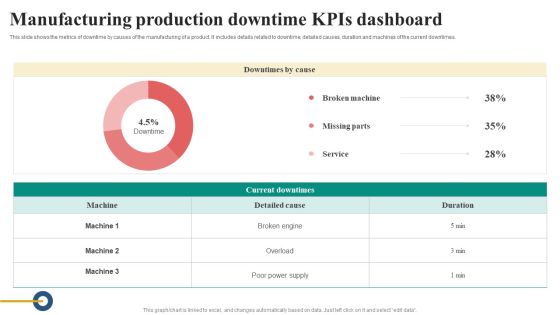
Manufacturing Production Downtime Kpis Dashboard Diagrams PDF
This slide shows the metrics of downtime by causes of the manufacturing of a product. It includes details related to downtime, detailed causes, duration and machines of the current downtimes. Pitch your topic with ease and precision using this Manufacturing Production Downtime Kpis Dashboard Diagrams PDF. This layout presents information on Details Related To Downtime, Detailed Causes, Duration And Machines, Current Downtimes. It is also available for immediate download and adjustment. So, changes can be made in the color, design, graphics or any other component to create a unique layout.

KPI Dashboards Per Industry Digital Social Media Engagement Dashboard Ppt PowerPoint Presentation Slides Format Ideas PDF
Deliver an awe-inspiring pitch with this creative kpi dashboards per industry digital social media engagement dashboard ppt powerpoint presentation slides format ideas pdf bundle. Topics like new followers vs lost followers, 2020, 2021 can be discussed with this completely editable template. It is available for immediate download depending on the needs and requirements of the user.
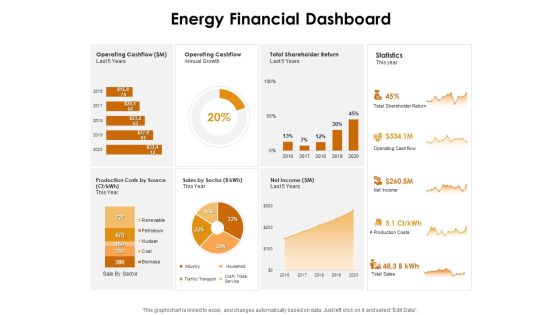
KPI Dashboards Per Industry Energy Financial Dashboard Ppt PowerPoint Presentation Professional Example File PDF
Deliver and pitch your topic in the best possible manner with this kpi dashboards per industry energy financial dashboard ppt powerpoint presentation professional example file pdf. Use them to share invaluable insights on operating cashflow, total shareholder return, production costs source, sales sector, net income and impress your audience. This template can be altered and modified as per your expectations. So, grab it now.
 Home
Home