It Project Discovery Phase
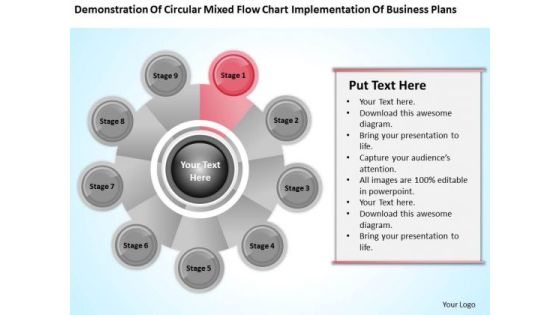
Business Analysis Diagrams Flow Chart Implementation Plans PowerPoint Templates
We present our business analysis diagrams flow chart implementation plans PowerPoint templates.Present our Business PowerPoint Templates because It will get your audience in sync. Download our Circle Charts PowerPoint Templates because Your ideas provide food for thought. Our PowerPoint Templates and Slides will help you create a dish to tickle the most discerning palate. Present our Shapes PowerPoint Templates because our PowerPoint Templates and Slides will give your ideas the shape. Download our Process and Flows PowerPoint Templates because Our PowerPoint Templates and Slides has conjured up a web of all you need with the help of our great team. Use them to string together your glistening ideas. Present our Leadership PowerPoint Templates because Watching this your Audience will Grab their eyeballs, they wont even blink.Use these PowerPoint slides for presentations relating to project, flow, process, business, system, success, chart, work, innovation, implementation, plan, concept, evaluation, presentation, symbol, internet, diagram, analysis, flowchart, analyzing, technology, idea, development, management, steps, strategy, addie, design, outcome, assessment, structure. The prominent colors used in the PowerPoint template are Red, Gray, White.

People Process And Technology Assessment For Successful Change Introduction PDF
The following slide depicts the assessment of people, processes and technology to facilitate change management. It mainly includes activities such as managing complex projects, upskilling employees, determining issues and root cause, conducting system health check etc. Presenting People Process And Technology Assessment For Successful Change Introduction PDF to dispense important information. This template comprises three stages. It also presents valuable insights into the topics including People, Process, Technology. This is a completely customizable PowerPoint theme that can be put to use immediately. So, download it and address the topic impactfully.
Three Months Data Analysis Procedure Roadmap Icons
We present our three months data analysis procedure roadmap icons. This PowerPoint layout is easy to edit so you can change the font size, font type, color, and shape conveniently. In addition to this, the PowerPoint layout is Google Slides compatible, so you can share it with your audience and give them access to edit it. Therefore, download and save this well researched three months data analysis procedure roadmap icons in different formats like PDF, PNG, and JPG to smoothly execute your business plan.

Business Diagram Human Mind Diagram With Pie Graph For Representation PowerPoint Slide
This diagram displays human face graphic divided into sections. This section can be used for data display. Use this diagram to build professional presentations for your viewers.
Statistical Analysis Icon With Pie Chart Ppt PowerPoint Presentation Diagram Templates PDF
Persuade your audience using this statistical analysis icon with pie chart ppt powerpoint presentation diagram templates pdf. This PPT design covers three stages, thus making it a great tool to use. It also caters to a variety of topics including statistical analysis icon with pie chart. Download this PPT design now to present a convincing pitch that not only emphasizes the topic but also showcases your presentation skills.

Agile Application Development Survey Of Issues Faced By IT Employees Infographics PDF
This slide covers a graph that depicts the problems what IT employees are facing in organisation while choosing software development methods by conducting a survey also showing key takeaways for the same. Deliver and pitch your topic in the best possible manner with this agile application development survey of issues faced by it employees infographics pdf. Use them to share invaluable insights on required, method, process, project, organization and impress your audience. This template can be altered and modified as per your expectations. So, grab it now.
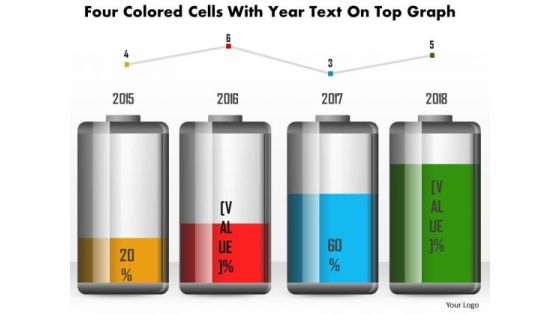
Business Diagram Four Colored Cells With Year Text On Top Graph PowerPoint Slide
This business diagram has been designed with battery cell graphic for business timeline. This slide can be used for business planning and management. Use this diagram for your business and success milestones related presentations.

Agile Model Survey Of Issues Faced By IT Employees Ppt Icon Layout PDF
This slide covers a graph that depicts the problems what IT employees are facing in organisation while choosing software development methods by conducting a survey also showing key takeaways for the same. Deliver an awe inspiring pitch with this creative agile model survey of issues faced by it employees ppt icon layout pdf bundle. Topics like resource, demand, environmental, project, goals can be discussed with this completely editable template. It is available for immediate download depending on the needs and requirements of the user.

Data Analysis Workflow Chart Powerpoint Slides
This is a data analysis workflow chart powerpoint slides. This is a three stage process. The stages in this process are connect, visualize, share.
KPI Dashboard For Tracking Marcom Mix Strategy Progress Ideas PDF
Following slide showcases marketing mix progress monitoring dashboard to determine business performance. It includes elements such as clicks, impressions, click through rate, conversion rate, cost per click and monthly overview to Google ads. Showcasing this set of slides titled KPI Dashboard For Tracking Marcom Mix Strategy Progress Ideas PDF. The topics addressed in these templates are Kpi Dashboard, Tracking Marcom, Mix Strategy Progress. All the content presented in this PPT design is completely editable. Download it and make adjustments in color, background, font etc. as per your unique business setting.

Business Diagram Three Staged Pencil Diagram For Graph Formation PowerPoint Slide
This business diagram displays set of pencils. This Power Point template has been designed to compare and present business data. Download this diagram to represent stages of business growth.

Successful Onboarding Strategy For Business Growth Download PDF
The following slide showcases example of business growth by using multiple onboarding strategies. It showcases strategies such as boot camp, cross functional projects, mentorship, feedback and performance management and culture and values. If you are looking for a format to display your unique thoughts, then the professionally designed Successful Onboarding Strategy For Business Growth Download PDF is the one for you. You can use it as a Google Slides template or a PowerPoint template. Incorporate impressive visuals, symbols, images, and other charts. Modify or reorganize the text boxes as you desire. Experiment with shade schemes and font pairings. Alter, share or cooperate with other people on your work. Download Successful Onboarding Strategy For Business Growth Download PDF and find out how to give a successful presentation. Present a perfect display to your team and make your presentation unforgettable.

Personal Job Assignment Management Dashboard With Progress Background PDF
The following slide highlights the employee workload management dashboard with progress illustrating key headings which includes monthly task status, time, progress, task, employee work status and workload. Showcasing this set of slides titled Personal Job Assignment Management Dashboard With Progress Background PDF. The topics addressed in these templates are Monthly Task Status, Time, Progress, Employee Work Status. All the content presented in this PPT design is completely editable. Download it and make adjustments in color, background, font etc. as per your unique business setting.
KPI Dashboard For Tracking Corporate Objectives Progress Template PDF
Following slide demonstrates progress tracking dashboard to determine objectives achieved by business. It includes elements such as objectives achieved, unachieved objectives, objectives achievement in progress and all objectives status. Showcasing this set of slides titled KPI Dashboard For Tracking Corporate Objectives Progress Template PDF. The topics addressed in these templates are Objectives Achieved, Unachieved Objectives, Objectives Progress . All the content presented in this PPT design is completely editable. Download it and make adjustments in color, background, font etc. as per your unique business setting.

Comparative Cost Analysis Of Workforce Capacity Building Tools Professional PDF
The following slide highlights the comparative assessment of workforce capacity developing tools to select the best alternatives. It includes elements such as cost, features visualizing logged hours, prioritizing multiple projects, monitoring time off and vacation etc. Presenting Comparative Cost Analysis Of Workforce Capacity Building Tools Professional PDF to dispense important information. This template comprises three stages. It also presents valuable insights into the topics including Team Work, Cost, Required. This is a completely customizable PowerPoint theme that can be put to use immediately. So, download it and address the topic impactfully.

Outliers Model For Predictive Analytics Forward Looking Analysis IT Mockup PDF
This slide talks about the outliers model used for predictive analytics, including its use cases, impact and algorithm used in it, such as the generalized linear model for two values. This model helps banking, finance, and cyber security organizations to detect fraud and cyber crimes.Whether you have daily or monthly meetings, a brilliant presentation is necessary. Outliers Model For Predictive Analytics Forward Looking Analysis IT Mockup PDF can be your best option for delivering a presentation. Represent everything in detail using Outliers Model For Predictive Analytics Forward Looking Analysis IT Mockup PDF and make yourself stand out in meetings. The template is versatile and follows a structure that will cater to your requirements. All the templates prepared by Slidegeeks are easy to download and edit. Our research experts have taken care of the corporate themes as well. So, give it a try and see the results.

Strategic HRM Dashboard To Monitor Progress Designs PDF
Showcasing this set of slides titled trategic HRM Dashboard To Monitor Progress Designs PDF The topics addressed in these templates are Employees Turnover, Recruitment Progress, Working Format All the content presented in this PPT design is completely editable. Download it and make adjustments in color, background, font etc. as per your unique business setting.

Essential Tools For Interior Design Process And Development Procedure Topics PDF
The slide showcases some essential tool and techniques to aid interior designers in executing the designing process effectively and deliver optimized projects. It includes tool belt, management software, application and design software. Presenting Essential Tools For Interior Design Process And Development Procedure Topics PDF to dispense important information. This template comprises five stages. It also presents valuable insights into the topics including Management Software, Applications, Design Software. This is a completely customizable PowerPoint theme that can be put to use immediately. So, download it and address the topic impactfully.
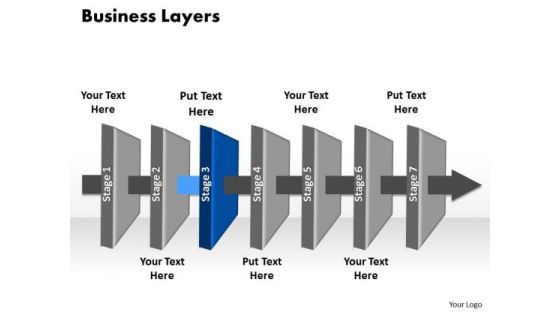
Ppt Layer 3 Marketing Linear Communication Process PowerPoint Presentation Templates
PPT layer 3 marketing linear communication process PowerPoint presentation Templates-This PowerPoint Diagram shows you the 3d Horizontal Illustration to explain Communication linearly. It consists of seven Layers explaining third here. It imitates advertise, barter, display, exchange, merchandise, offer for sale, retail, vend, wholesale etc.-PPT layer 3 marketing linear communication process PowerPoint presentation Templates-abstract, achievement, adding, analyzing, arrow, art, background, blank, blue, business, chart, color, colorful, cycle, data, design, diagram, element, flow, graph, graphic, gray, green, icon, linear, management, market, numbers, percent, process, project, round, stock, success, up, value
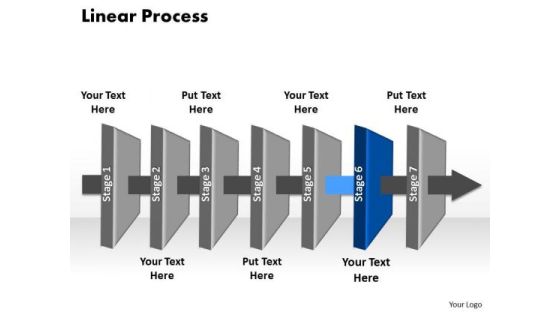
Ppt Ozone Layer PowerPoint Presentation 6 Social Linear Process Templates
PPT ozone layer PowerPoint presentation 6 social linear process Templates-Use this 3D PowerPoint Diagram to represent the Seven stages of Sequential Process. It portrays beeline, continuous, even, horizontal, in bee line, in straight line, linear , nonstop, not crooked, point-blank, right, shortest, straight, straightaway, though, true, unbroken etc.-PPT ozone layer PowerPoint presentation 6 social linear process Templates-abstract, achievement, adding, analyzing, arrow, art, background, blank, blue, business, chart, color, colorful, cycle, data, design, diagram, element, flow, graph, graphic, gray, green, icon, linear, management, market, numbers, percent, process, project, round, stock, success, up, value

Associated Data IT Importance To Publish 5 Stars Linked Data Template PDF
This slide describes the importance of publishing five stars linked data, where five stars mean your data is linked with other available information throughout the internet, four stars mean detection of each object and making content easily discoverable, and so on. Deliver an awe inspiring pitch with this creative Associated Data IT Importance To Publish 5 Stars Linked Data Template PDF bundle. Topics like Uniform Resource, Internet, Material can be discussed with this completely editable template. It is available for immediate download depending on the needs and requirements of the user.
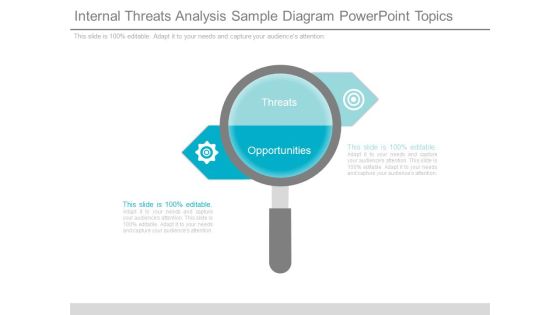
Internal Threats Analysis Sample Diagram Powerpoint Topics
This is a Internal Threats Analysis Sample Diagram Powerpoint Topics. This is a two stage process. The stages in this process are threats, opportunities.
Tracking Goals Dashboard With Progress Report Rules PDF
This slide showcases the progress report which helps to determine gaps in the objective achievement process and take corrective actions. It also includes objective details such as contributor, due date, and progress percentage. Showcasing this set of slides titled Tracking Goals Dashboard With Progress Report Rules PDF. The topics addressed in these templates are Immediate Action Required, Progress Update Required, Concise Goal Outcome Required. All the content presented in this PPT design is completely editable. Download it and make adjustments in color, background, font etc. as per your unique business setting.
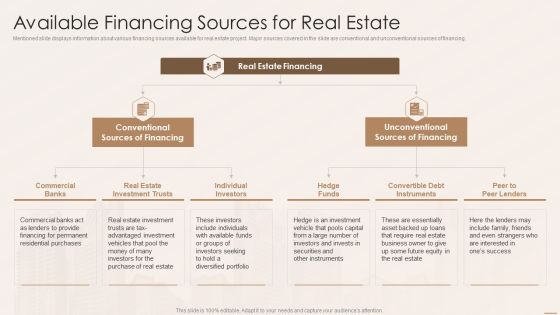
Real Estate Developers Funding Alternatives Available Financing Sources For Real Estate Formats PDF
Mentioned slide displays information about various financing sources available for real estate project. Major sources covered in the slide are conventional and unconventional sources of financing. This is a Real Estate Developers Funding Alternatives Available Financing Sources For Real Estate Formats PDF template with various stages. Focus and dispense information on two stages using this creative set, that comes with editable features. It contains large content boxes to add your information on topics like Individual Investors, Convertible Debt Instruments, Commercial Banks. You can also showcase facts, figures, and other relevant content using this PPT layout. Grab it now.

Statistical Data Analysis Chart Of Collected Data Formats PDF
Presenting statistical data analysis chart of collected data formats pdf to dispense important information. This template comprises four stages. It also presents valuable insights into the topics including statistical data analysis chart of collected data. This is a completely customizable PowerPoint theme that can be put to use immediately. So, download it and address the topic impactfully.
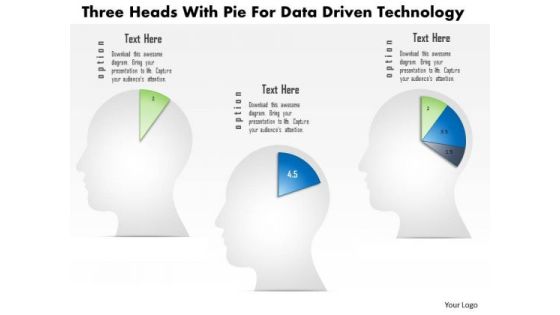
Business Diagram Three Heads With Pie For Data Driven Technology PowerPoint Slide
This business diagram displays three human faces with pie charts. This Power Point template has been designed to compare and present business data. You may use this diagram to impart professional appearance to your presentations.

Business Diagram Two Tablets With Growth Bar Graph Data Driven PowerPoint Slide
This business diagram has been designed with comparative charts on tablets. This slide suitable for data representation. You can also use this slide to present business reports and information. Use this diagram to present your views in a wonderful manner.
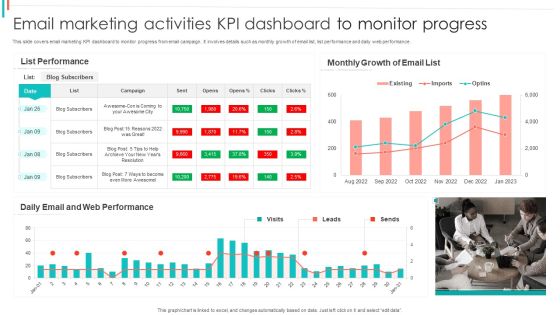
Email Marketing Activities KPI Dashboard To Monitor Progress Pictures PDF
This slide covers email marketing KPI dashboard to monitor progress from email campaign. It involves details such as monthly growth of email list, list performance and daily web performance.Showcasing this set of slides titled Email Marketing Activities KPI Dashboard To Monitor Progress Pictures PDF. The topics addressed in these templates are List Performance, Monthly Growth, Web Performance. All the content presented in this PPT design is completely editable. Download it and make adjustments in color, background, font etc. as per your unique business setting.

Marketing Dashboard To Track Marketing Progress Ppt Tips PDF
This slide represents dashboard to track marketing campaign progress. It includes advertisement costs , total clicks, click-through rate, conversion rate, cost per thousand impression etc. Pitch your topic with ease and precision using this Marketing Dashboard To Track Marketing Progress Ppt Tips PDF. This layout presents information on Total Clicks, Total Impression, Total Conversion Rate, Cost Per Click. It is also available for immediate download and adjustment. So, changes can be made in the color, design, graphics or any other component to create a unique layout.
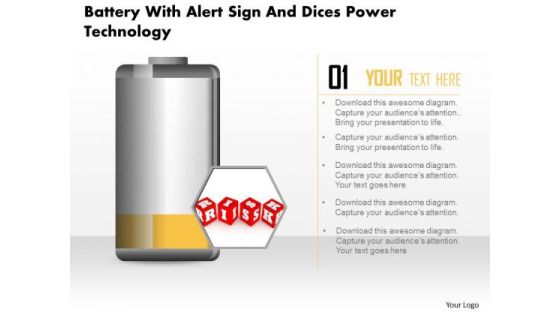
Business Diagram Battery With Alert Sign And Dices Power Technology PowerPoint Slide
This business diagram displays risk alert on battery icon. Use this diagram, in your presentations to display energy saving, battery and technology. Create professional presentations using this diagram slide.
Business Diagram Battery With Empty Sign For Power Generation PowerPoint Slide
This business diagram displays empty sign alert on battery icon. Use this diagram, in your presentations to display energy saving, battery and technology. Create professional presentations using this diagram slide.

Future Predictions For Upcoming Advanced Technologies Across IT Diagrams PDF
This slide provides information regarding the future prediction of the latest technologies across IT sector. Major trends include hyper-automation, edge computing, extended reality, datafication, etc. Want to ace your presentation in front of a live audience Our Future Predictions For Upcoming Advanced Technologies Across IT Diagrams PDF can help you do that by engaging all the users towards you. Slidegeeks experts have put their efforts and expertise into creating these impeccable powerpoint presentations so that you can communicate your ideas clearly. Moreover, all the templates are customizable, and easy to edit and downloadable. Use these for both personal and commercial use.
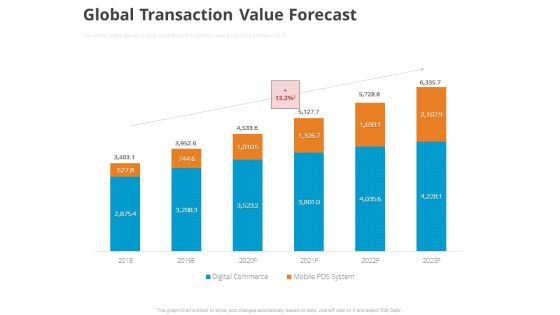
Online Settlement Revolution Global Transaction Value Forecast Sample PDF
The markets largest segment is digital commerce with a transition value of US 2,875.5 billion in 2018. Deliver an awe inspiring pitch with this creative online settlement revolution global transaction value forecast sample pdf bundle. Topics like global transaction value forecast can be discussed with this completely editable template. It is available for immediate download depending on the needs and requirements of the user.

Importance To Publish 5 Stars Linked Data Integrating Linked Data To Enhance Operational Effectiveness Summary PDF
This slide describes the importance of publishing five stars-linked data, where five stars mean your data is linked with other available information throughout the internet, four stars mean detection of each object and making content easily discoverable, and so on.Boost your pitch with our creative Importance To Publish 5 Stars Linked Data Integrating Linked Data To Enhance Operational Effectiveness Summary PDF. Deliver an awe-inspiring pitch that will mesmerize everyone. Using these presentation templates you will surely catch everyones attention. You can browse the ppts collection on our website. We have researchers who are experts at creating the right content for the templates. So you do not have to invest time in any additional work. Just grab the template now and use them.

Business Diagram 3d Colorful Pie Graph With Magnifier Data Search PowerPoint Slide
This business slide displays 3d colorful pie graph with magnifier. This diagram is a data visualization tool that gives you a simple way to present statistical information. This slide helps your audience examine and interpret the data you present.
Developing Organization Partner Strategy 6 Measure Partner Performance Ppt PowerPoint Presentation Icon Format Ideas PDF
Presenting this set of slides with name developing organization partner strategy 6 measure partner performance ppt powerpoint presentation icon format ideas pdf. This is a three three stage process. The stages in this process are partner performance scorecard, pipeline deals, making progress, business. This is a completely editable PowerPoint presentation and is available for immediate download. Download now and impress your audience.
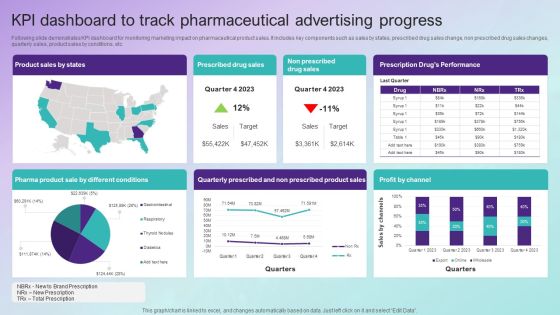
KPI Dashboard To Track Pharmaceutical Advertising Progress Topics PDF
Following slide demonstrates KPI dashboard for monitoring marketing impact on pharmaceutical product sales. It includes key components such as sales by states, prescribed drug sales change, non prescribed drug sales changes, quarterly sales, product sales by conditions, etc. Showcasing this set of slides titled KPI Dashboard To Track Pharmaceutical Advertising Progress Topics PDF. The topics addressed in these templates are Product Sales By States, Prescribed Drug Sales, Non Prescribed Drug Sales, Profit By Channel. All the content presented in this PPT design is completely editable. Download it and make adjustments in color, background, font etc. as per your unique business setting.
Dashboard To Track Automated Manufacturing Workflow Progress Professional PDF
Following slide demonstrates KPI dashboard for monitoring automated manufacturing processes performance which can be used by businesses to increase organization efficiency. It includes key components such as total business revenue, Number of customers, total units produced, production rate, monthly production by manufacturing lines, etc. Showcasing this set of slides titled Dashboard To Track Automated Manufacturing Workflow Progress Professional PDF. The topics addressed in these templates are Machine Utilization, Product Delivery, Defective Units Produced. All the content presented in this PPT design is completely editable. Download it and make adjustments in color, background, font etc. as per your unique business setting.
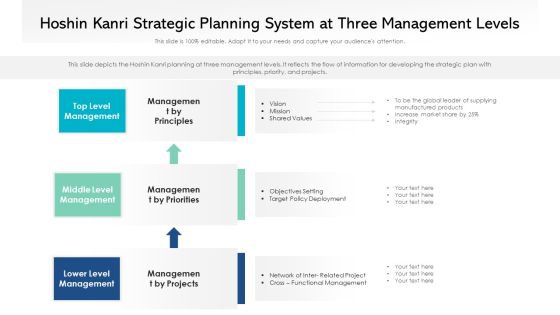
Hoshin Kanri Strategic Planning System At Three Management Levels Ppt PowerPoint Presentation Gallery Show PDF
This slide depicts the Hoshin Kanri planning at three management levels. It reflects the flow of information for developing the strategic plan with principles, priority, and projects. Presenting hoshin kanri strategic planning system at three management levels ppt powerpoint presentation gallery show pdf to dispense important information. This template comprises three stages. It also presents valuable insights into the topics including top level management, middle level management, lower level management. This is a completely customizable PowerPoint theme that can be put to use immediately. So, download it and address the topic impactfully.

5 Ways To Apply Agile To Customer Relationships Diagrams PDF
This slide provides the glimpse about the five ways which must be applied to the customer relationships such as vision, deep understanding, prioritization of use cases. This is a 5 ways to apply agile to customer relationships diagrams pdf template with various stages. Focus and dispense information on five stages using this creative set, that comes with editable features. It contains large content boxes to add your information on topics like technical, requirements, project, performance, team. You can also showcase facts, figures, and other relevant content using this PPT layout. Grab it now.
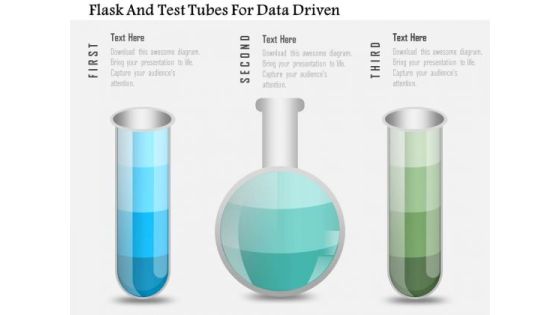
Business Diagram Flask And Test Tubes For Data Driven PowerPoint Slide
This data driven diagram has been designed with flask and test tubes. Download this diagram to give your presentations more effective look. It helps in clearly conveying your message to clients and audience.

Business Diagram Three Trucks For Data Representation For Business PowerPoint Slide
This business diagram displays three trucks graphic. This diagram contains trucks for percentage value growth. Use this diagram to display business growth over a period of time.
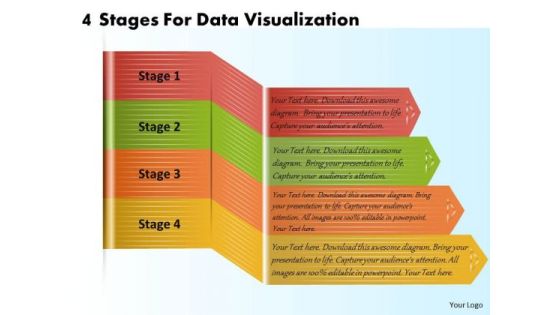
Business Plan And Strategy 4 Stages For Data Visualization Strategic Planning Template Ppt Slide
Your Listeners Will Never Doodle. Our business plan and strategy 4 stages for data visualization strategic planning template ppt slide Powerpoint Templates Will Hold Their Concentration. Do The One Thing With Your Thoughts. Uphold Custom With Our Process and Flows Powerpoint Templates.
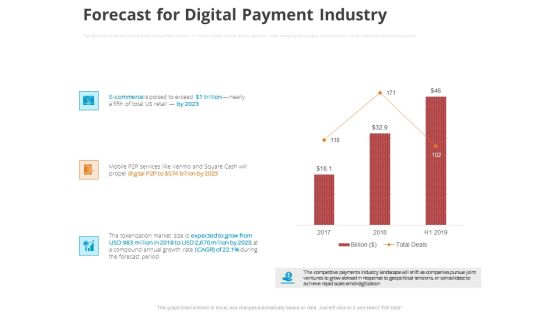
Online Settlement Revolution Forecast For Digital Payment Industry Pictures PDF
Highlights five trends that should shape the payments industry in the year ahead, looking at how regulatory shifts, emerging technologies, and competition could impact the payments ecosystem. Deliver and pitch your topic in the best possible manner with this online settlement revolution forecast for digital payment industry pictures pdf. Use them to share invaluable insights on forecast for digital payment industry and impress your audience. This template can be altered and modified as per your expectations. So, grab it now.

Predictive Data Model Uses Of Predictive Analytics Credit Information PDF
This slide describes the usage of predictive analytics in banking and other financial institutions for credit purposes. It is used to calculate the credit score of a person or organization and to ensure that borrower doesnot fail to return the loan. If you are looking for a format to display your unique thoughts, then the professionally designed Predictive Data Model Uses Of Predictive Analytics Credit Information PDF is the one for you. You can use it as a Google Slides template or a PowerPoint template. Incorporate impressive visuals, symbols, images, and other charts. Modify or reorganize the text boxes as you desire. Experiment with shade schemes and font pairings. Alter, share or cooperate with other people on your work. Download Predictive Data Model Uses Of Predictive Analytics Credit Information PDF and find out how to give a successful presentation. Present a perfect display to your team and make your presentation unforgettable.
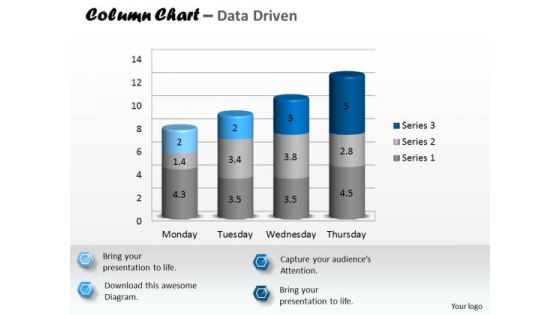
Data Analysis In Excel 3d Column Chart To Represent Information PowerPoint Templates
Rake In The Dough With

Multivariate Data Analysis Driven Line Chart For Market Survey PowerPoint Slides Templates
Rake In The Dough With

7 Stages Analysis And Implementation Process Business Plan PowerPoint Templates
We present our 7 stages analysis and implementation process business plan PowerPoint templates.Download and present our Business PowerPoint Templates because Our PowerPoint Templates and Slides will let you Leave a lasting impression to your audiences. They possess an inherent longstanding recall factor. Download our Gear Wheels PowerPoint Templates because You have the co-ordinates for your destination of success. Let our PowerPoint Templates and Slides map out your journey. Use our Process and Flows PowerPoint Templates because Our PowerPoint Templates and Slides come in all colours, shades and hues. They help highlight every nuance of your views. Download our Circle Charts PowerPoint Templates because Our PowerPoint Templates and Slides come in all colours, shades and hues. They help highlight every nuance of your views. Present our Leadership PowerPoint Templates because It can Conjure up grand ideas with our magical PowerPoint Templates and Slides. Leave everyone awestruck by the end of your presentation.Use these PowerPoint slides for presentations relating to project, development, system, task, 3d, plan, data, process, design, leadership, isolated, requirement, collaboration, corporate, business, tag, concept, render, teamwork, graphic, schedule, goal, word, shape, gear, abstract, team, mind, management, creative, illustration, stage, connection, strategy, metaphor, company, organization, information, background, work, manager, structure. The prominent colors used in the PowerPoint template are Green, Gray, White.

Desired Key Objectives Of Existing Staff Evaluation Ppt PowerPoint Presentation Layouts Format PDF
Persuade your audience using this desired key objectives of existing staff evaluation ppt powerpoint presentation layouts format pdf. This PPT design covers eight stages, thus making it a great tool to use. It also caters to a variety of topics including customer flexibility and scalability, top talent approach and access, overall cost reduction, resource optimization methods, deadline achievement through structured goas setting, complete control on project, no time zone barrier, skill gap analysis. Download this PPT design now to present a convincing pitch that not only emphasizes the topic but also showcases your presentation skills.
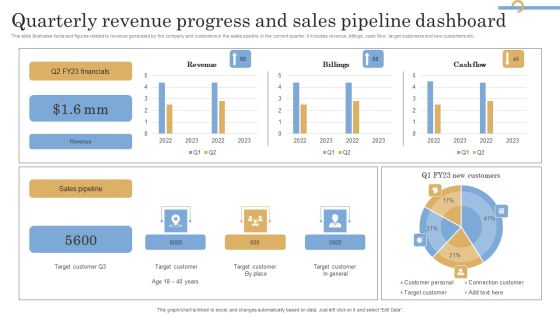
Quarterly Revenue Progress And Sales Pipeline Dashboard Information PDF
This slide illustrates facts and figures related to revenue generated by the company and customers in the sales pipeline in the current quarter. It includes revenue, billings, cash flow, target customers and new customers etc. Showcasing this set of slides titled Quarterly Revenue Progress And Sales Pipeline Dashboard Information PDF. The topics addressed in these templates are Financials, Revenue, Sales Pipeline. All the content presented in this PPT design is completely editable. Download it and make adjustments in color, background, font etc. as per your unique business setting.
Risk Analysis Vector Icon Ppt Powerpoint Presentation Infographics File Formats
This is a risk analysis vector icon ppt powerpoint presentation infographics file formats. This is a four stage process. The stages in this process are feedback loop icon, evaluation icon, assessment icon.
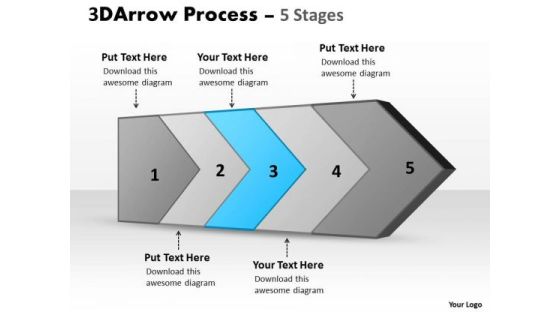
Ppt Theme Five Stages Of Successful Concept Design PowerPoint Template Download Plan 4
We present our PPT Theme five stages of successful concept design power point template download plan 4.Use our Arrows PowerPoint Templates because, the basic stages are in place, and you need to build upon them with our PowerPoint templates. Use our Business PowerPoint Templates because, your quicksilver ideas are the arrows in your quiver. Use our Shapes PowerPoint Templates because; now funnel your marketing strategies down the cone, stage by stage, refining as you go along. Use our Finance PowerPoint Templates because, Gears Interconnected:- The Gear Train is a basic element of living and daily business. Use our Process and Flows PowerPoint Templates because; Break it all down to Key Result Areas. Use these PowerPoint slides for presentations relating to 3d, arrow, background, bullet, business, chart, checkmark, chevron, diagram, drop, eps10, financial, five, glass, graphic, gray, icon, illustration, management, point, process, project, reflection, set, shadow, stage, text, transparency, vector, white. The prominent colors used in the PowerPoint template are Blue, Gray, and Black
Target Market Assessment Analysis Icon Mockup PDF
Persuade your audience using this Target Market Assessment Analysis Icon Mockup PDF. This PPT design covers four stages, thus making it a great tool to use. It also caters to a variety of topics including Target Market Assessment, Analysis Icon. Download this PPT design now to present a convincing pitch that not only emphasizes the topic but also showcases your presentation skills.

Business Process Impact Analysis Icon Demonstration PDF
Persuade your audience using this Business Process Impact Analysis Icon Demonstration PDF. This PPT design covers three stages, thus making it a great tool to use. It also caters to a variety of topics including Business Process, Impact Analysis Icon. Download this PPT design now to present a convincing pitch that not only emphasizes the topic but also showcases your presentation skills.

Data Collection Preparation And Preprocessing Through Machine Learning Icons PDF
Once the insights are identified, data collection sources are selected for further predictive modeling. After that, dataset is prepared with a set of attributes representing behavior patterns related to customer engagement level for specific product or service. Presenting this PowerPoint presentation, titled Data Collection Preparation And Preprocessing Through Machine Learning Icons PDF, with topics curated by our researchers after extensive research. This editable presentation is available for immediate download and provides attractive features when used. Download now and captivate your audience. Presenting this Data Collection Preparation And Preprocessing Through Machine Learning Icons PDF. Our researchers have carefully researched and created these slides with all aspects taken into consideration. This is a completely customizable Data Collection Preparation And Preprocessing Through Machine Learning Icons PDF that is available for immediate downloading. Download now and make an impact on your audience. Highlight the attractive features available with our PPTs.

Business Diagram 3d Lock With Pie Graph For Result Representation PowerPoint Slide
This Power Point diagram has been crafted with pie chart in shape of lock. It contains diagram of lock pie chart to compare and present data in an effective manner. Use this diagram to build professional presentations for your viewers.
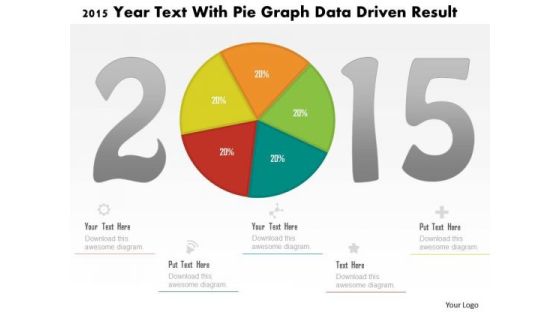
Business Diagram 2015 Year Text With Pie Graph Data Driven Result PowerPoint Slide
This business diagram displays 2015 year numbers with pie chart. This diagram is suitable to display business strategy for year 2015. Download this professional slide to present information in an attractive manner

Information Technology Certifications Advantages Facts And Figures About Rise Slides PDF
This template covers facts and figures about rise in IT certification demand for certified scrum developer CSD certification certified scrummaster CSM etc. Presenting Information Technology Certifications Advantages Facts And Figures About Rise Slides PDF to provide visual cues and insights. Share and navigate important information on four stages that need your due attention. This template can be used to pitch topics like new project, management jobs, Scrum Maste. In addtion, this PPT design contains high resolution images, graphics, etc, that are easily editable and available for immediate download.

Estimated Global Motor Vehicle Production By Type Global Automotive Manufacturing Market Analysis Information PDF
This slide covers a graphical representation of worldwide automobile manufacturing forecasts. It also includes key insights about as passenger cars, Chinese motorists, etc. The Estimated Global Motor Vehicle Production By Type Global Automotive Manufacturing Market Analysis Information PDF is a compilation of the most recent design trends as a series of slides. It is suitable for any subject or industry presentation, containing attractive visuals and photo spots for businesses to clearly express their messages. This template contains a variety of slides for the user to input data, such as structures to contrast two elements, bullet points, and slides for written information. Slidegeeks is prepared to create an impression.
 Home
Home