It Project Discovery Phase

Predictive Analytics Vs Machine Learning Forward Looking Analysis IT Rules PDF
This slide represents the comparison between predictive analytics and machine learning based on technology used and built on, the functionality of the model, and requirements for the development of the models.Retrieve professionally designed Predictive Analytics Vs Machine Learning Forward Looking Analysis IT Rules PDF to effectively convey your message and captivate your listeners. Save time by selecting pre-made slideshows that are appropriate for various topics, from business to educational purposes. These themes come in many different styles, from creative to corporate, and all of them are easily adjustable and can be edited quickly. Access them as PowerPoint templates or as Google Slides themes. You do not have to go on a hunt for the perfect presentation because Slidegeeks got you covered from everywhere.

Business Research And Analytics Vector Icon Ppt PowerPoint Presentation Professional Show
Presenting this set of slides with name business research and analytics vector icon ppt powerpoint presentation professional show. This is a three stage process. The stages in this process are data visualization icon, research analysis, business focus. This is a completely editable PowerPoint presentation and is available for immediate download. Download now and impress your audience.
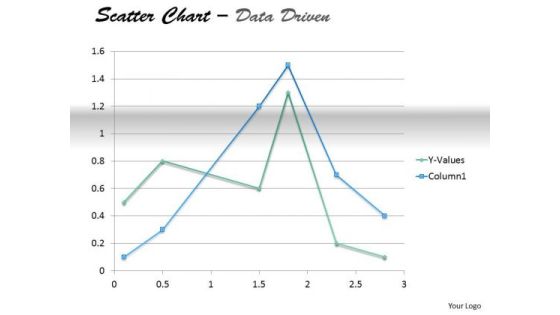
Examples Of Data Analysis Market Driven Present In Scatter Chart PowerPoint Slides Templates
Your Thoughts Will Take To Our examples of data analysis market driven present in scatter chart powerpoint slides Templates Like A Duck To Water. They Develop A Binding Affinity.
Business Diagram Human Icons With Bubbles And Different Icons Inside PowerPoint Slide
This diagram displays graph with percentage value growth. This business slide is suitable to present and compare business data. Use this diagram to build professional presentations for your viewers.
Business Diagram 3d Capsule With Multiple Icons For Business Data Flow PowerPoint Slide
This diagram has been designed with 3d graphic of capsule with multiple icons. This data driven PowerPoint slide can be used to give your presentations more effective look. It helps in clearly conveying your message to clients and audience.

Facebook Strategies Dashboard To Track Progress Structure PDF
This slides showcases dashboard to monitor the progress of Facebook page. It includes elements such as total likes, followers, likes by country, by age , engagement types and Facebook videos views. Pitch your topic with ease and precision using this Facebook Strategies Dashboard To Track Progress Structure PDF. This layout presents information on Followers, Engagement Type, Shares. It is also available for immediate download and adjustment. So, changes can be made in the color, design, graphics or any other component to create a unique layout.
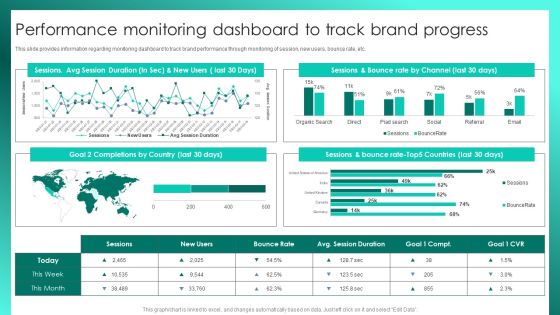
Successful Brand Management Performance Monitoring Dashboard To Track Brand Progress Themes PDF
This slide provides information regarding monitoring dashboard to track brand performance through monitoring of session, new users, bounce rate, etc. Create an editable Successful Brand Management Performance Monitoring Dashboard To Track Brand Progress Themes PDF that communicates your idea and engages your audience. Whether youre presenting a business or an educational presentation, pre-designed presentation templates help save time. Successful Brand Management Performance Monitoring Dashboard To Track Brand Progress Themes PDF is highly customizable and very easy to edit, covering many different styles from creative to business presentations. Slidegeeks has creative team members who have crafted amazing templates. So, go and get them without any delay.

Application Of AI For Database Access Governance Summary PDF
This slide represents the applications of artificial intelligence systems for data access governance. The purpose of this slide is to demonstrate the AI application in secure data access. The use cases include threat detection and prediction, system configuration, adaptability, data interpretation, and predictive forecasting. Presenting Application Of AI For Database Access Governance Summary PDF to dispense important information. This template comprises five stages. It also presents valuable insights into the topics including Prediction, System Configuration, Adaptability. This is a completely customizable PowerPoint theme that can be put to use immediately. So, download it and address the topic impactfully.
Business Diagram Battery Icon With Power Icons Energy Technology PowerPoint Slide
This business diagram displays battery icon with power charging. Use this diagram, in your presentations to display energy saving, battery and technology. Create professional presentations using this diagram slide.

Timeboxing Practice Of Dynamic System Development Method Ppt Pictures Graphics Design PDF
This slide depicts timeboxing as a practice of DSDM which includes a strict set of deadlines as a result lowest important tasks are discarded. This is a Timeboxing Practice Of Dynamic System Development Method Ppt Pictures Graphics Design PDF template with various stages. Focus and dispense information on four stages using this creative set, that comes with editable features. It contains large content boxes to add your information on topics like Project, Increment, Timebox. You can also showcase facts, figures, and other relevant content using this PPT layout. Grab it now.
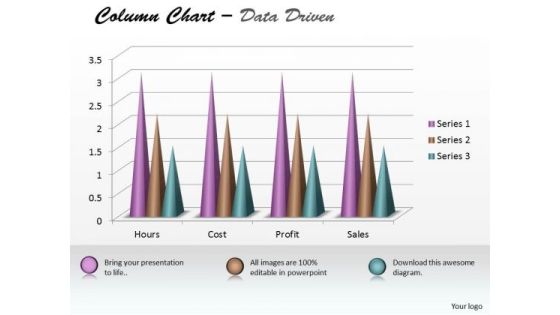
Excel Data Analysis Data Tools Data Methods Statistical Tool Survey Chart PowerPoint Templates
Analyze Ailments On Our excel data analysis data tools data methods statistical tool survey chart Powerpoint Templates . Bring Out The Thinking Doctor In You. Dock Your Thoughts With Our Excel Data Analysis . They Will Launch Them Into Orbit.
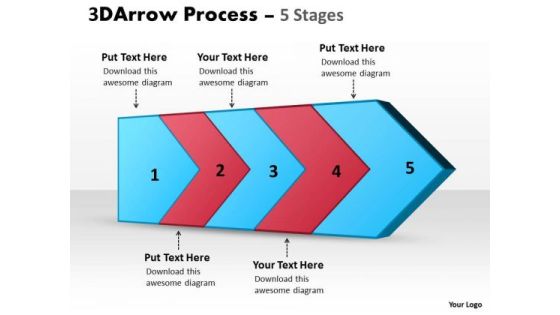
Ppt Theme Five State Diagram Of Successful Trade PowerPoint Plan 1 Graphic
We present our PPT Theme five state diagram of successful trade power point plan 1 Graphic. Use our Arrows PowerPoint Templates because, your ideas are fundamentally stable with a broad base of workable possibilities. Use our Business PowerPoint Templates because, are the stepping stones of our journey till date. Use our Shapes PowerPoint Templates because, Display your ideas and highlight their ability to accelerate the growth of your company and you. Use our Finance PowerPoint Templates because; illustrate how each element flows seamlessly onto the next stage. Use our Process and Flows PowerPoint Templates because; educate your listeners on the means to keep it ticking over. Use these PowerPoint slides for presentations relating to 3d, arrow, background, bullet, business, chart, checkmark, chevron, diagram, drop, eps10, financial, five, glass, graphic, gray, icon, illustration, management, point, process, project, reflection, set, shadow, stage, text, transparency, vector, white. The prominent colors used in the PowerPoint template are Red, Blue, and Black
Ppt Theme Five State Diagram Of Successful Trade PowerPoint Plan 2 Graphic
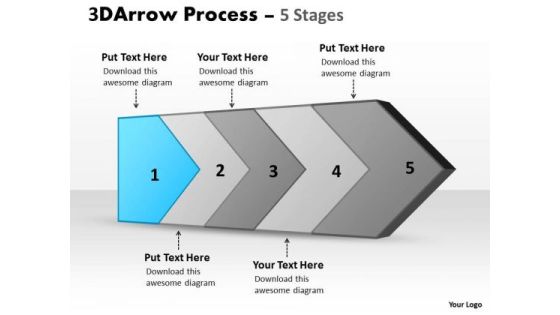
We present our PPT Theme five state diagram of successful trade power point plan 2 Graphic. Use our Arrows PowerPoint Templates because; Impress upon the audience how your strategy will carry all to the top of the corporate heap. Use our Business PowerPoint Templates because, the basic stages are in place, you need to build upon them with our PowerPoint templates. Use our Shapes PowerPoint Templates because; heighten the anticipation of your audience with this slide listing. Use our Finance PowerPoint Templates because; unravel the desired and essential elements of your overall strategy. Use our Process and Flows PowerPoint Templates because, and watch them strengthen your companys sinews. Use these PowerPoint slides for presentations relating to 3d, arrow, background, bullet, business, chart, checkmark, chevron, diagram, drop, eps10, financial, five, glass, graphic, gray, icon, illustration, management, point, process, project, reflection, set, shadow, stage, text, transparency, vector, white. The prominent colors used in the PowerPoint template are Blue, Gray, and Black

Business Diagram Data Driven Pie Chart Inside The Magnifier PowerPoint Slide
This business slide displays 3d colorful pie graph with magnifier. This diagram is a data visualization tool that gives you a simple way to present statistical information. This slide helps your audience examine and interpret the data you present.
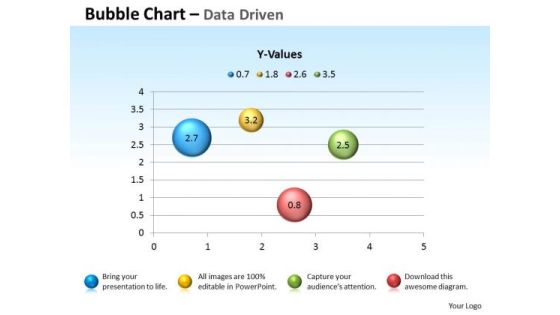
Excel Data Analysis Data Tools Data Methods Statistical Chart For Process PowerPoint Templates
Blend Your Views With Our excel data analysis data tools data methods statistical chart for process Powerpoint Templates . They Are Made For Each Other.
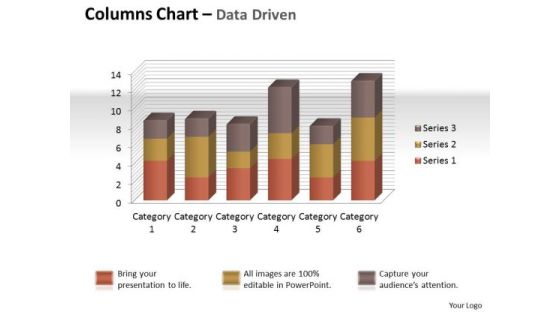
Excel Data Analysis Data Tools Data Methods Statistical Tool Chart PowerPoint Templates
Give Your Thoughts Some Durability. Coat Them With Our excel data analysis data tools data methods statistical tool chart Powerpoint Templates .
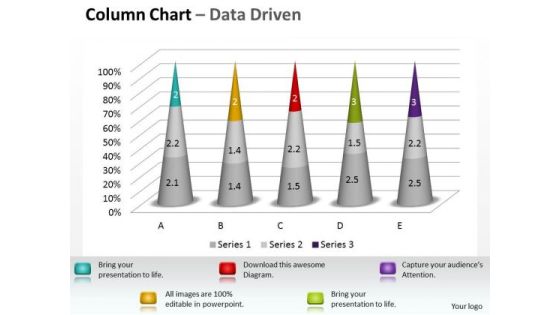
Excel Data Analysis Data Tools Data Methods Statistical Tool Survey 3d Chart PowerPoint Templates
Dumbfound Them With Our excel data analysis data tools data methods statistical tool survey 3d chart Powerpoint Templates . Your Audience Will Be Astounded With Your Ideas.

Ultimate Guide To Effective Change Management Process Four Stages Of Team Development Themes PDF
This slide illustrates the framework for successful team formation for the change management project. The key steps involved are forming, storming, norming, and performing. This is a ultimate guide to effective change management process four stages of team development themes pdf template with various stages. Focus and dispense information on four stages using this creative set, that comes with editable features. It contains large content boxes to add your information on topics like forming, performing, norming, storming. You can also showcase facts, figures, and other relevant content using this PPT layout. Grab it now.

Seven Petals Illustrating Advantages Of Hr Management Ppt PowerPoint Presentation Model Clipart Images PDF
Presenting seven petals illustrating advantages of hr management ppt powerpoint presentation model clipart images pdf to dispense important information. This template comprises seven stages. It also presents valuable insights into the topics including recruitment and training employees, increase employee motivation, conflict management, manage payroll, supervise projects, build organization culture. This is a completely customizable PowerPoint theme that can be put to use immediately. So, download it and address the topic impactfully.
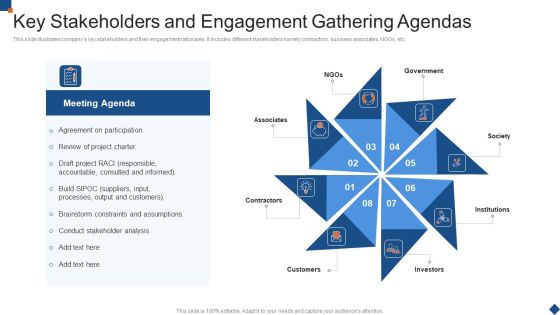
Key Stakeholders And Engagement Gathering Agendas Introduction PDF
This slide illustrates companys key stakeholders and their engagement rationales. It includes different stakeholders namely contractors, business associates, NGOs, etc.Presenting Key Stakeholders And Engagement Gathering Agendas Introduction PDF to dispense important information. This template comprises eight stages. It also presents valuable insights into the topics including Agreement On Participation, Review Of Project, Brainstorm Constraints This is a completely customizable PowerPoint theme that can be put to use immediately. So, download it and address the topic impactfully.

Big Data Technology For Real Estate Management Elements PDF
The slide showcases the key areas, big data technology in property management is used to drive Proptech disruption and efficiency of running a business. It covers better analytics, precise property evaluations, improved home prospecting and marketing, data-driven property development and digitalization of back-office processes. Presenting Big Data Technology For Real Estate Management Elements PDF to dispense important information. This template comprises five stages. It also presents valuable insights into the topics including Precise Property Evaluation, Performs Predictive Analysis, Development Opportunities. This is a completely customizable PowerPoint theme that can be put to use immediately. So, download it and address the topic impactfully.

Information Technology Operations Administration With ML Predictive Analysis Process Structure PDF
Are you searching for a Information Technology Operations Administration With ML Predictive Analysis Process Structure PDF that is uncluttered, straightforward, and original Its easy to edit, and you can change the colors to suit your personal or business branding. For a presentation that expresses how much effort you have put in, this template is ideal With all of its features, including tables, diagrams, statistics, and lists, its perfect for a business plan presentation. Make your ideas more appealing with these professional slides. Download Information Technology Operations Administration With ML Predictive Analysis Process Structure PDF from Slidegeeks today.

Annual Result Analysis Powerpoint Slide Themes
This is a annual result analysis powerpoint slide themes. This is a five stage process. The stages in this process are business, process, presentation, strategy, analysis.
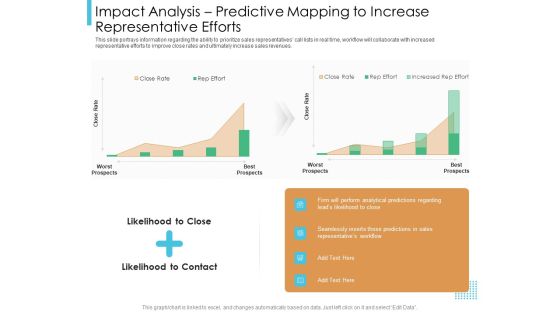
Lead Scoring Model Impact Analysis Predictive Mapping To Increase Representative Efforts Ppt Model Display PDF
Deliver and pitch your topic in the best possible manner with this lead scoring model impact analysis predictive mapping to increase representative efforts ppt model display pdf. Use them to share invaluable insights on workflow, sales, perform, analytical and impress your audience. This template can be altered and modified as per your expectations. So, grab it now.

Ppt Red Quadrant On Circular Free Pie PowerPoint Template Chart Ks2 Templates
PPT red quadrant on circular free pie powerpoint template chart ks2 Templates-Use this layout to define the outcome and the multiple possibilities in a way that is used in calculation of probabilities, genetics and strategic reasoning. This chart visualize the of process steps, reoccurrences and components or of your company structure or product features.-PPT red quadrant on circular free pie powerpoint template chart ks2 Templates-3 arrow, art, background, business, chart, circle, clip, colorful, design, diagram, flow, fourth, graph, graphic, half, icon, illustration, management, point, process, progress, project, round, segment, set, slide, stage, successful business, third, transparent
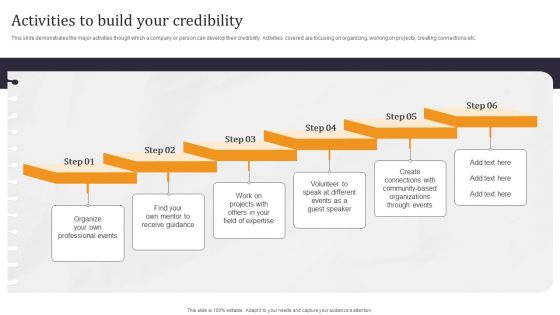
Developing Appealing Persona Activities To Build Your Credibility Diagrams PDF
This slide demonstrates the major activities though which a company or person can develop their credibility. Activities covered are focusing on organizing, working on projects, creating connections etc. Create an editable Developing Appealing Persona Activities To Build Your Credibility Diagrams PDF that communicates your idea and engages your audience. Whether youre presenting a business or an educational presentation, pre-designed presentation templates help save time. Developing Appealing Persona Activities To Build Your Credibility Diagrams PDF is highly customizable and very easy to edit, covering many different styles from creative to business presentations. Slidegeeks has creative team members who have crafted amazing templates. So, go and get them without any delay.
Rating Competitors On Key Success Factors Ppt PowerPoint Presentation Icon
This is a rating competitors on key success factors ppt powerpoint presentation icon. This is a five stage process. The stages in this process are extensive distribution, customer focus, economies of scale, product innovation.

Industry Analysis And Forecasts For Salon Industry Ppt PowerPoint Presentation Complete Deck With Slides
With well-researched insights and carefully-constructed design, this Industry Analysis And Forecasts For Salon Industry Ppt PowerPoint Presentation Complete Deck With Slides is all that you need for your next business meeting with clients and win them over. Add your data to graphs, charts, and tables that are already ready to display it with stunning visuals and help your audience recall your work. With this PPT Complete Deck, you will be able to display your knowledge of the subject as well as your skills as a communicator. Share your ideas and make an impact on the audience with this PowerPoint Layout and ensure that you are known as a presentation professional. Download this PPT Template Bundle to create the most interesting presentation anyone has ever seen.
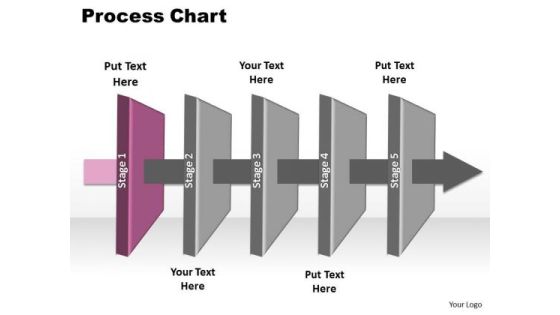
Ppt 5 Layers International Marketing PowerPoint Slides Process Chart 1 Templates
PPT 5 layers international marketing powerpoint slides process chart 1 Templates-This PowerPoint Diagram shows you the 3d Horizontal Illustration to explain Communication linearly. It consists of Five Layers explaining first here. It imitates advertise, barter, display, exchange, merchandise, offer for sale, retail, vend, wholesale etc.-PPT 5 layers international marketing powerpoint slides process chart 1 Templates-3d, analyze, arrow, assess, background, bullet, business, chart, checkmark, chevron, diagram, drop, eps10, financial, glass, graphic, gray, icon, illustration, improvement, management, point, process, project, reflection, set, shadow, silver, stage, text, transparency, vector

KPI Dashboard Showcasing Product Management Progress Status Themes PDF
Presenting KPI Dashboard Showcasing Product Management Progress Status Themes PDF to dispense important information. This template comprises three stages. It also presents valuable insights into the topics including Product Management, KPI Dashboard Showcasing. This is a completely customizable PowerPoint theme that can be put to use immediately. So, download it and address the topic impactfully.
Matrix Reporting Line For Multinational Management Icons PDF
This slide showcases matrix reporting line that can help in promoting open communication in organization and improve collaboration in projects. It can also help business in faster decision making Presenting matrix reporting line for multinational management icons pdf to dispense important information. This template comprises three stages. It also presents valuable insights into the topics including quality manager, contract managers, plant department, procurement manager. This is a completely customizable PowerPoint theme that can be put to use immediately. So, download it and address the topic impactfully.

Agile Kanban Methodology Chart With Stories Ppt Model Show PDF
This slide explains Kanban Methodology through a chart that shows User Story Details, Tasks to be done, Tasks in progress Product Development, Software Quality Check, Testing to be done Automation Processes, Cycle Time Analysis and the activities that are ready to be deployed. Deliver an awe inspiring pitch with this creative agile kanban methodology chart with stories ppt model show pdf bundle. Topics like product development, process enhancements to timely deliver the project, agile kanban methodology chart with stories can be discussed with this completely editable template. It is available for immediate download depending on the needs and requirements of the user.

Agenda For Advanced Service Data Analysis Introduction PDF
This is a agenda for advanced service data analysis introduction pdf template with various stages. Focus and dispense information on five stages using this creative set, that comes with editable features. It contains large content boxes to add your information on topics like agenda for advanced service data analysis. You can also showcase facts, figures, and other relevant content using this PPT layout. Grab it now.

Lead Scoring AI Model Impact Analysis Predictive Mapping To Increase Representative Efforts Ppt Slides Objects PDF
This slide provides information regarding the dashboard that depicts lead ranking information with leads qualification rating, leads interest level, etc. Deliver and pitch your topic in the best possible manner with this lead scoring ai model impact analysis predictive mapping to increase representative efforts ppt slides objects pdf. Use them to share invaluable insights on workflow, sales, perform, analytical and impress your audience. This template can be altered and modified as per your expectations. So, grab it now.
Executing Advance Data Analytics At Workspace Impact Analysis Of Successful Icons PDF
This slide depicts the impact of successful implementation of infrastructure intelligence in terms improved incident management and customer satisfaction and also depicts that how much the focus area has been improved from the previous state. This is a executing advance data analytics at workspace impact analysis of successful icons pdf template with various stages. Focus and dispense information on four stages using this creative set, that comes with editable features. It contains large content boxes to add your information on topics like impact analysis of successful infrastructure intelligence implementation. You can also showcase facts, figures, and other relevant content using this PPT layout. Grab it now.

Employee Career Progression Chart With Timeline Inspiration PDF
The slide showcases a career progress map for employee which helps to outline the progress achieved by the employees over the years and track functionality and skill levels. It covers employee progress journey through different levels intern to partner level. Persuade your audience using this Employee Career Progression Chart With Timeline Inspiration PDF. This PPT design covers one stages, thus making it a great tool to use. It also caters to a variety of topics including Management, Product Responsibility, Various Project. Download this PPT design now to present a convincing pitch that not only emphasizes the topic but also showcases your presentation skills.
Strategic Plan Roadmap To Develop Effective Cyber Security Strategy Icons PDF
This slide signifies the strategic plan timeline to create effective cyber security project. It covers information about steps like identify, analyse, evaluate, prioritise, treat and monitor Persuade your audience using this Strategic Plan Roadmap To Develop Effective Cyber Security Strategy Icons PDF. This PPT design covers six stages, thus making it a great tool to use. It also caters to a variety of topics including Evaluate, Identify, Analyse. Download this PPT design now to present a convincing pitch that not only emphasizes the topic but also showcases your presentation skills.

Ppt 7 Power Point Stage Social Backgrounds Linear Process PowerPoint Templates
PPT 7 power point stage social backgrounds linear process PowerPoint Templates-Create visually stimulating Microsoft office PPT Presentations with our above Diagram. It shows seven different layers placed in horizontal manner. It shows the successive concepts used in a procedure. This diagram will fit for Business Presentations. An excellent graphic to attract the attention of your audience to improve earnings.-PPT 7 power point stage social backgrounds linear process PowerPoint Templates-achievement, adding, analyzing, arrow, art, background, blank, business, chart, colorful, cycle, data, design, diagram, element, flow, graph, graphic, gray, icon, linear, magenta, management, market, numbers, orange, percent, process, project, round, stock, success, up, value

12 Outer Nodes Wheel And Spokes Chart Diagram PowerPoint Slides
12_Outer_Nodes_Wheel_and_Spokes_Chart_Diagram_PowerPoint_Slides-These high quality powerpoint pre-designed slides and powerpoint templates have been carefully created by our professional team to help you impress your audience. All slides have been created and are 100% editable in powerpoint. Each and every property of any graphic - color, size, orientation, shading, outline etc. can be modified to help you build an effective powerpoint presentation. Any text can be entered at any point in the powerpoint template or slide. Simply DOWNLOAD, TYPE and PRESENT! These PowerPoint presentation slides can be used to represent themes relating to --Abstract, action, analysis, blank, business, chart, clipart, commerce, concept, conceptual, design, diagram, direction, flow, generic, goals, guide, guidelines, heirarchy, icon, idea, illustration, lingakes, links, manage, management, mba, model, organization, performance, plan, process, project, relationship, representation, resource, steps, strategy, success, tactics, theoretical, theory, tool, workflow-12_Outer_Nodes_Wheel_and_Spokes_Chart_Diagram_PowerPoint_Slides

Data Interpretation And Analysis Playbook Ppt PowerPoint Presentation Complete Deck With Slides
This complete deck acts as a great communication tool. It helps you in conveying your business message with personalized sets of graphics, icons etc. Comprising a set of thirty nine slides, this complete deck can help you persuade your audience. It also induces strategic thinking as it has been thoroughly researched and put together by our experts. Not only is it easily downloadable but also editable. The color, graphics, theme any component can be altered to fit your individual needs. So grab it now.

Circular Looped Process 5 Stages Ppt Business Plan Templet PowerPoint Slides
We present our circular looped process 5 stages ppt business plan templet PowerPoint Slides.Download and present our Business PowerPoint Templates because They will Put the wind in your sails. Skim smoothly over the choppy waters of the market. Download our Circle Charts PowerPoint Templates because You can Inspire your team with our PowerPoint Templates and Slides. Let the force of your ideas flow into their minds. Use our Process and Flows PowerPoint Templates because You can Create a matrix with our PowerPoint Templates and Slides. Feel the strength of your ideas click into place. Present our Stars PowerPoint Templates because Our PowerPoint Templates and Slides will weave a web of your great ideas. They are gauranteed to attract even the most critical of your colleagues. Download and present our Shapes PowerPoint Templates because Watching this your Audience will Grab their eyeballs, they wont even blink.Use these PowerPoint slides for presentations relating to 3d,seven, decoration, model, form, step, order, flow, business, plan, concept, vector, success, rotation, presentation, tasks, symbol, template, diagram, circle, brochure,scheme, element, marketing, technology, idea, development, management, graph, cycle, piece, circular, system, options, strategy, project, processes, infographic, levels, connected, part, background, structure. The prominent colors used in the PowerPoint template are Purple, Green, Red.
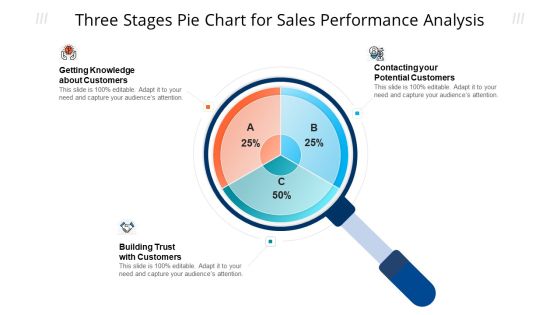
Three Stages Pie Chart For Sales Performance Analysis Ppt Model Tips PDF
Persuade your audience using this three stages pie chart for sales performance analysis ppt model tips pdf. This PPT design covers three stages, thus making it a great tool to use. It also caters to a variety of topics including potential customers, knowledge about customers, sales performance analysis. Download this PPT design now to present a convincing pitch that not only emphasizes the topic but also showcases your presentation skills.

Business Timeline For Product Quality Planning Ppt PowerPoint Presentation Infographics Slide Download PDF
Presenting business timeline for product quality planning ppt powerpoint presentation infographics slide download pdf to dispense important information. This template comprises six stages. It also presents valuable insights into the topics including establish the project, identify the customers, discover customer needs, develop the product, develop the process, develop the controls and transfer to operations, 2010 to 2035. This is a completely customizable PowerPoint theme that can be put to use immediately. So, download it and address the topic impactfully.

Departmental Goals And Progress Status Dashboard Ppt Portfolio Samples PDF
This slide illustrates statistics and graphical representation of team progress. It includes testing team, sales team, development team, members and progress status graphs etc. Pitch your topic with ease and precision using this Departmental Goals And Progress Status Dashboard Ppt Portfolio Samples PDF. This layout presents information on Testing Team, Sales Team, Development Team. It is also available for immediate download and adjustment. So, changes can be made in the color, design, graphics or any other component to create a unique layout.
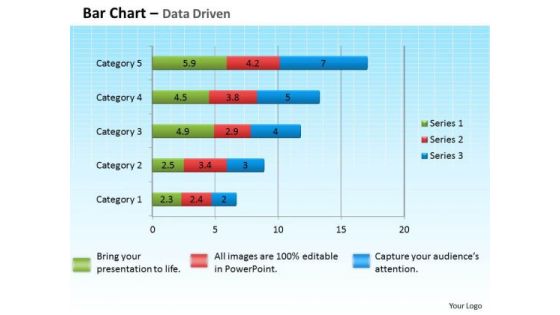
Data Analysis Excel Bar Graph To Compare PowerPoint Templates
Get The Domestics Right With Our data analysis excel bar graph to compare Powerpoint Templates. Create The Base For Thoughts To Grow.
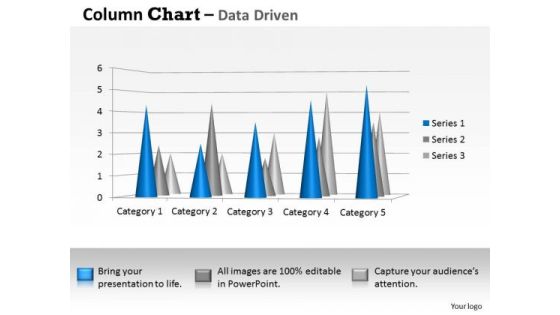
Data Analysis Techniques 3d Distribution Of In Sets PowerPoint Templates
Your Thoughts Will Be The Main Course. Provide The Dressing With Our data analysis techniques 3d distribution of in sets Powerpoint Templates .

Data Analysis Techniques 3d Graphical Presentation Of PowerPoint Templates
Our data analysis techniques 3d graphical presentation of Powerpoint Templates Will Follow The Drill. They Accomplish The Task Assigned To Them.
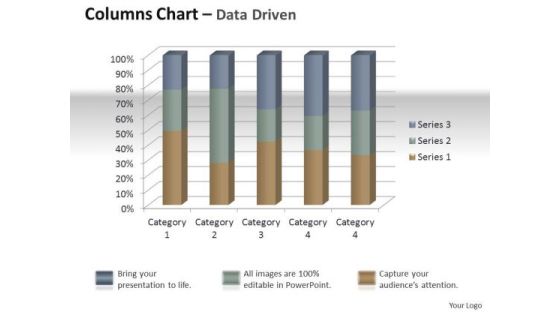
Marketing Data Analysis 3d Quality Control Of Units PowerPoint Templates
Establish Your Dominion With Our marketing data analysis 3d quality control of units Powerpoint Templates . Rule The Stage With Your Thoughts.

Microsoft Excel Data Analysis Bar Graph PowerPoint Templates
Double The Impact With Our microsoft excel data analysis bar graph Powerpoint Templates . Your Thoughts Will Have An Imposing Effect.
Swot Analysis Icon Illustration Of Predictive Analytics Promotions Ppt PowerPoint Presentation File Elements PDF
Persuade your audience using this swot analysis icon illustration of predictive analytics promotions ppt powerpoint presentation file elements pdf. This PPT design covers four stages, thus making it a great tool to use. It also caters to a variety of topics including strengths, weaknesses, opportunities. Download this PPT design now to present a convincing pitch that not only emphasizes the topic but also showcases your presentation skills.
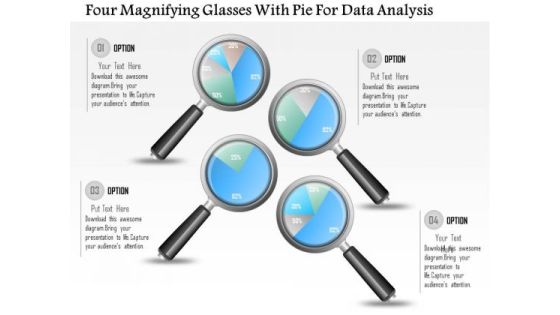
Business Diagram Four Magnifying Glasses With Pie For Data Analysis PowerPoint Slide
This business diagram displays graphic of pie charts in shape of magnifying glasses This business slide is suitable to present and compare business data. Use this diagram to build professional presentations for your viewers.

Business Diagram Six Staged Pie Charts For Text Representation PowerPoint Slide
This slide displays graphic six staged pie charts. Download this diagram to present and compare business data. Use this diagram to display business process workflows in any presentation.

Quarterly Budget For Research And Development Department Clipart PDF
The slide exhibits quarterly budget of research and development department. The purpose of the slide is to allocate financial resources for the departments ongoing projects, and related expenses ensuring effective planning. It include expenditure related to salary, equipment, labor etc. Presenting Quarterly Budget For Research And Development Department Clipart PDF to dispense important information. This template comprises one stages. It also presents valuable insights into the topics including Salaries, Equipment Supplies, Laboratory Equipment. This is a completely customizable PowerPoint theme that can be put to use immediately. So, download it and address the topic impactfully.

Company Budget Analysis Mitigation Strategies To Overcome Digital Marketing Tasks Microsoft PDF
The purpose of this slide is to highlight the multiple strategies that must be followed by the business organizations to overcome digital marketing outsourcing risks. The major solutions are preparation of high level marketing campaigns plans, sharing sensitive data through encrypted channels etc. If you are looking for a format to display your unique thoughts, then the professionally designed Company Budget Analysis Mitigation Strategies To Overcome Digital Marketing Tasks Microsoft PDF is the one for you. You can use it as a Google Slides template or a PowerPoint template. Incorporate impressive visuals, symbols, images, and other charts. Modify or reorganize the text boxes as you desire. Experiment with shade schemes and font pairings. Alter, share or cooperate with other people on your work. Download Company Budget Analysis Mitigation Strategies To Overcome Digital Marketing Tasks Microsoft PDF and find out how to give a successful presentation. Present a perfect display to your team and make your presentation unforgettable.
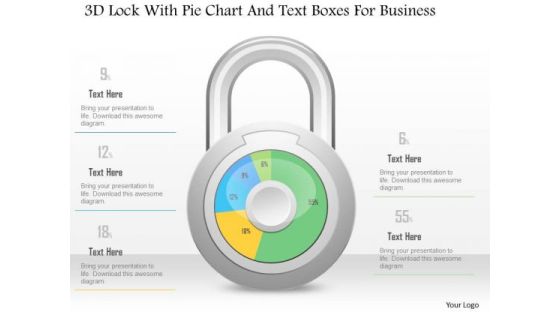
Business Diagram 3d Lock With Pie Chart And Text Boxes For Business PowerPoint Slide
This Power Point diagram has been crafted with pie chart in shape of lock. It contains diagram of lock pie chart to compare and present data in an effective manner. Use this diagram to build professional presentations for your viewers.

Predictive Analytics Classification Model Introduction Forward Looking Analysis IT Icons PDF
This slide describes the overview of the classification model used in predictive analytics, including the questions it answers. It also contains algorithms used in this model, such as random forest, gradient boosted model, convolution neural network, bagging, and stacking.Are you in need of a template that can accommodate all of your creative concepts This one is crafted professionally and can be altered to fit any style. Use it with Google Slides or PowerPoint. Include striking photographs, symbols, depictions, and other visuals. Fill, move around, or remove text boxes as desired. Test out color palettes and font mixtures. Edit and save your work, or work with colleagues. Download Predictive Analytics Classification Model Introduction Forward Looking Analysis IT Icons PDF and observe how to make your presentation outstanding. Give an impeccable presentation to your group and make your presentation unforgettable.

Basic Elements Of Movie Production Budget Diagrams PDF
This slide showcase components to be included while formulating effective film budget for a successful movie project. It includes elements such as pre-production and wrap crew, location expenses, studio rental and editorial expenses. Persuade your audience using this Basic Elements Of Movie Production Budget Diagrams PDF. This PPT design covers Four stages, thus making it a great tool to use. It also caters to a variety of topics including Basic Elements Movie, Production Budget. Download this PPT design now to present a convincing pitch that not only emphasizes the topic but also showcases your presentation skills.
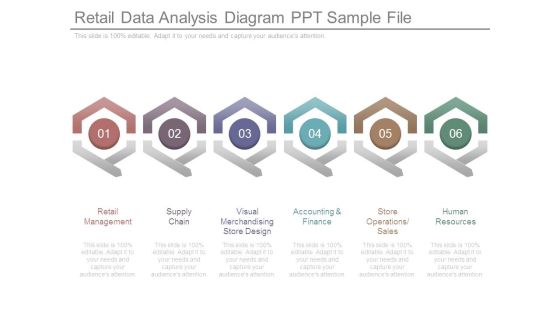
Retail Data Analysis Diagram Ppt Sample File
This is a retail data analysis diagram ppt sample file. This is a six stage process. The stages in this process are retail management, supply chain, visual merchandising store design, accounting and finance, store operations sales, human resources.
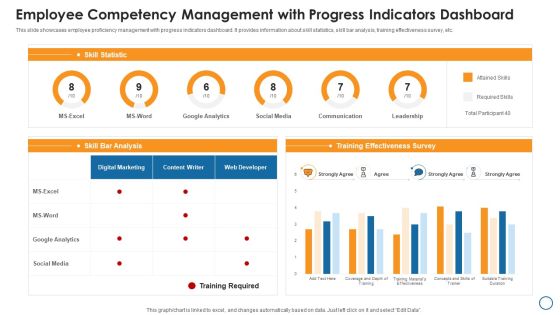
Employee Competency Management With Progress Indicators Dashboard Graphics PDF
This slide showcases employee proficiency management with progress indicators dashboard. It provides information about skill statistics, skill bar analysis, training effectiveness survey, etc. Showcasing this set of slides titled employee competency management with progress indicators dashboard graphics pdf. The topics addressed in these templates are google analytics, social media, survey. All the content presented in this PPT design is completely editable. Download it and make adjustments in color, background, font etc. as per your unique business setting.

2d Four Steps In The Process Business Development Ppt Plan Ideas PowerPoint Slides
We present our 2d four steps in the process business development ppt plan ideas PowerPoint Slides.Use our Business PowerPoint Templates because our PowerPoint Templates and Slides will give your ideas the shape. Use our Marketing PowerPoint Templates because You can Channelise the thoughts of your team with our PowerPoint Templates and Slides. Urge them to focus on the goals you have set. Present our Process and Flows PowerPoint Templates because You can Zap them with our PowerPoint Templates and Slides. See them reel under the impact. Download and present our Stars PowerPoint Templates because Our PowerPoint Templates and Slides are aesthetically designed to attract attention. We gaurantee that they will grab all the eyeballs you need. Download our Shapes PowerPoint Templates because Our PowerPoint Templates and Slides help you meet the demand of the Market. Just browse and pick the slides that appeal to your intuitive senses.Use these PowerPoint slides for presentations relating to 3d,seven, decoration, model, form, step, order, flow, business, plan, concept, vector, success, rotation, presentation, tasks, symbol, template, diagram, circle, brochure,scheme, element, marketing, technology, idea, development, management, graph, cycle, piece, circular, system, options, strategy, project, processes, infographic, levels, connected, part, background, structure. The prominent colors used in the PowerPoint template are Yellow, Red, Green.
 Home
Home