It Project Discovery Phase
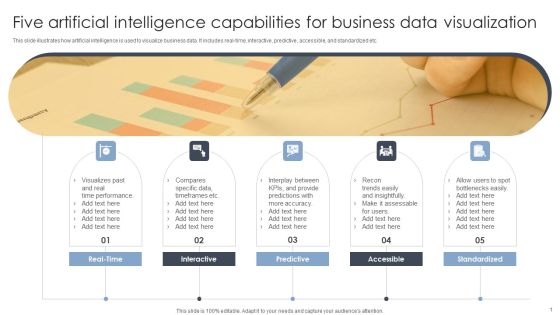
Five Artificial Intelligence Capabilities For Business Data Visualization Ideas PDF
This slide illustrates how artificial intelligence is used to visualize business data. It includes real-time, interactive, predictive, accessible, and standardized etc. Presenting Five Artificial Intelligence Capabilities For Business Data Visualization Ideas PDF to dispense important information. This template comprises Five stages. It also presents valuable insights into the topics including Interactive, Predictive, Accessible. This is a completely customizable PowerPoint theme that can be put to use immediately. So, download it and address the topic impactfully.
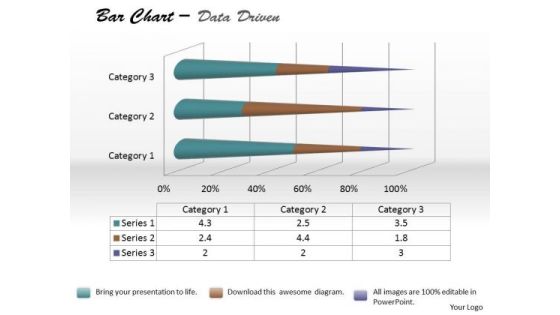
Data Analysis Bar Chart For Foreign Trade PowerPoint Templates
Be The Doer With Our data analysis bar chart for foreign trade Powerpoint Templates. Put Your Thoughts Into Practice.

Data Analysis Excel Business Tool Scatter Chart PowerPoint Templates
Dominate Proceedings With Your Ideas. Our data analysis excel business tool scatter chart Powerpoint Templates Will Empower Your Thoughts.
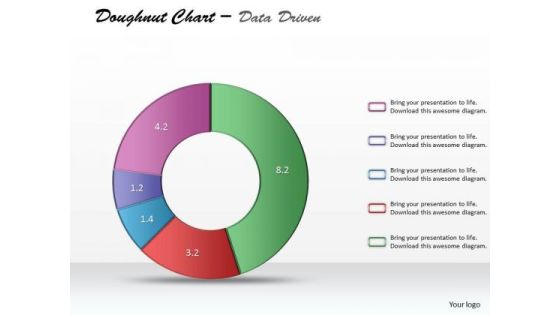
Data Analysis Excel Categorical Statistics Doughnut Chart PowerPoint Templates
Establish Your Dominion With Our data analysis excel categorical statistics doughnut chart Powerpoint Templates. Rule The Stage With Your Thoughts.

Data Analysis Techniques 3d Grouped Bar Chart PowerPoint Templates
Place The Orders With Your Thoughts. Our data analysis techniques 3d grouped bar chart Powerpoint Templates Know The Drill.
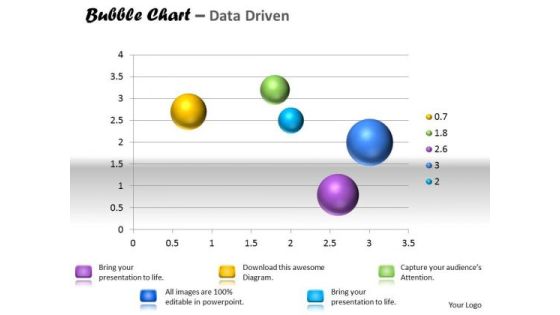
Data Analysis Template Interactive Bubble Chart PowerPoint Templates
Our data analysis template interactive bubble chart Powerpoint Templates Are A Wonder Drug. They Help Cure Almost Any Malaise.
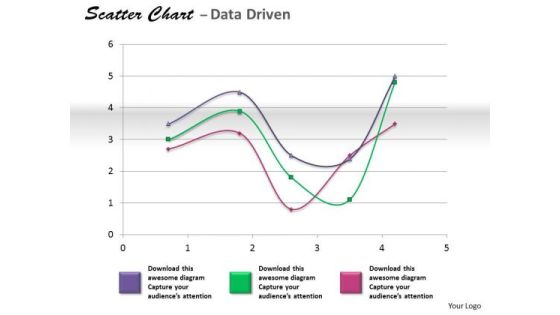
Financial Data Analysis Coordinate With Scatter Chart PowerPoint Templates
Get The Doers Into Action. Activate Them With Our financial data analysis coordinate with scatter chart Powerpoint Templates .
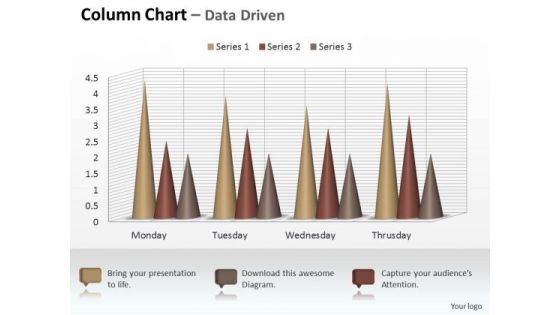
Marketing Data Analysis 3d Sets Of Column Chart PowerPoint Templates
Your Listeners Will Never Doodle. Our marketing data analysis 3d sets of column chart Powerpoint Templates Will Hold Their Concentration.
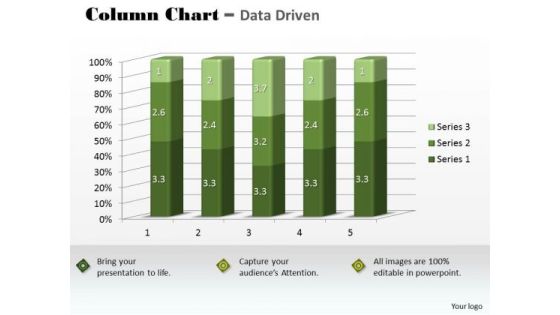
Marketing Data Analysis 3d Statistical Quality Control Chart PowerPoint Templates
Our marketing data analysis 3d statistical quality control chart Powerpoint Templates Abhor Doodling. They Never Let The Interest Flag.
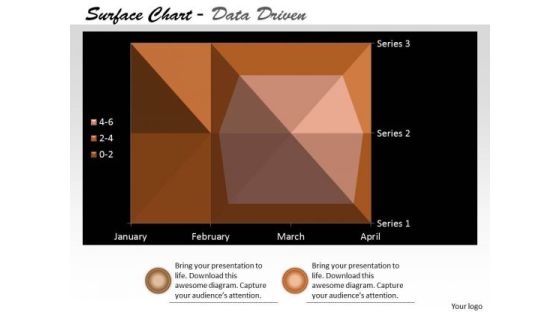
Multivariate Data Analysis Surface Chart Plots Trends PowerPoint Templates
Our multivariate data analysis surface chart plots trends Powerpoint Templates Heighten Concentration. Your Audience Will Be On The Edge.
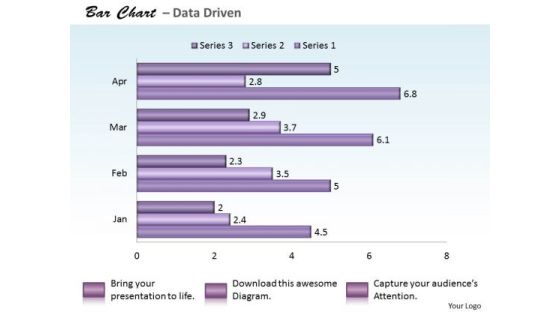
Quantitative Data Analysis Bar Chart For PowerPoint Templates
Reduce The Drag With Our quantitative data analysis bar chart for Powerpoint Templates . Give More Lift To Your Thoughts.

Data Analysis Techniques 3d Effective Display Chart PowerPoint Templates
Dribble Away With Our data analysis techniques 3d effective display chart Powerpoint Templates . Score A Goal With Your Ideas.
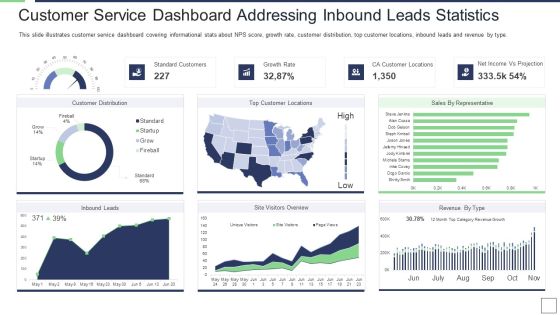
IT Service Incorporation And Administration Customer Service Dashboard Addressing Inbound Leads Statistics Clipart PDF
This slide illustrates customer service dashboard covering informational stats about NPS score, growth rate, customer distribution, top customer locations, inbound leads and revenue by type. Deliver an awe inspiring pitch with this creative it service incorporation and administration customer service dashboard addressing inbound leads statistics clipart pdf bundle. Topics like standard customers, growth rate, net income vs projection, ca customer locations can be discussed with this completely editable template. It is available for immediate download depending on the needs and requirements of the user.

Agenda For Disciplined Agile Distribution Responsibilities Ppt Icon Display PDF
This is a agenda for disciplined agile distribution responsibilities ppt icon display pdf template with various stages. Focus and dispense information on six stages using this creative set, that comes with editable features. It contains large content boxes to add your information on topics like software development, process, organization, implementation, project. You can also showcase facts, figures, and other relevant content using this PPT layout. Grab it now.

Dynamic Systems Development Approach Modelling Technique Of Dynamic System Development Guidelines PDF
This slide depicts modelling as a technique of DSDM which helps in the visualization of various elements of the project. Presenting Dynamic Systems Development Approach Modelling Technique Of Dynamic System Development Guidelines PDF to provide visual cues and insights. Share and navigate important information on four stages that need your due attention. This template can be used to pitch topics like Data Connections, Business Rules, Solution Area. In addtion, this PPT design contains high resolution images, graphics, etc, that are easily editable and available for immediate download.

Agile Software Development Dashboard With Sprint Progress Diagrams PDF
The following slide displays the dashboard for agile software development. The dashboard highlights multiple sprints of the web designing team, research and development team, customer support team etc. along with some details such as story points, sprint progress, work completed, time elapsed etc. Deliver and pitch your topic in the best possible manner with this agile software development dashboard with sprint progress diagrams pdf. Use them to share invaluable insights on customer support team, research, development team, web designing team and impress your audience. This template can be altered and modified as per your expectations. So, grab it now.
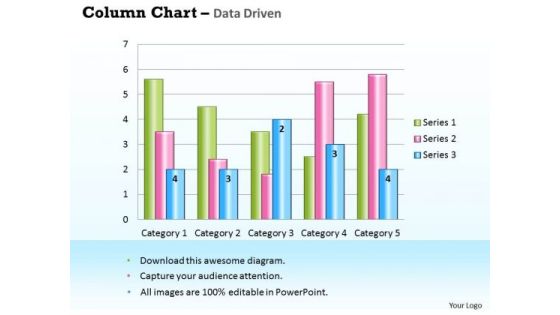
Business Data Analysis Chart For Case Studies PowerPoint Templates
Get Out Of The Dock With Our business data analysis chart for case studies Powerpoint Templates. Your Mind Will Be Set Free.
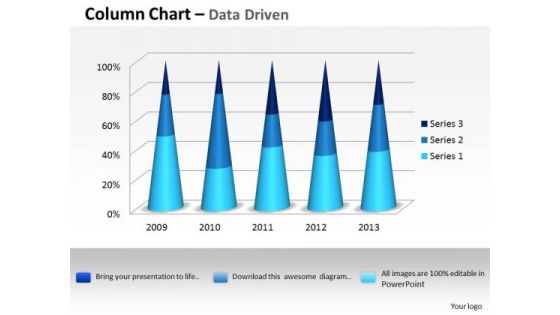
Data Analysis Excel 3d Process Variation Column Chart PowerPoint Templates
Put In A Dollop Of Our data analysis excel 3d process variation column chart Powerpoint Templates. Give Your Thoughts A Distinctive Flavor.

Data Analysis Excel Bubble Chart For Business Tasks PowerPoint Templates
Doll Up Your Thoughts With Our data analysis excel bubble chart for business tasks Powerpoint Templates. They Will Make A Pretty Picture.
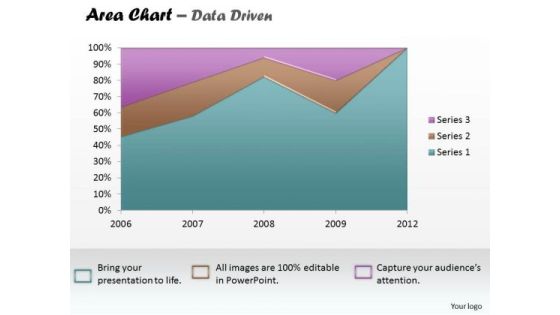
Data Analysis Excel Business Reporting Area Chart PowerPoint Templates
Establish The Dominance Of Your Ideas. Our data analysis excel business reporting area chart Powerpoint Templates Will Put Them On Top.

Data Analysis In Excel 3d Classification Of Chart PowerPoint Templates
With Our data analysis in excel 3d classification of chart Powerpoint Templates You Will Be Doubly Sure. They Possess That Stamp Of Authority.
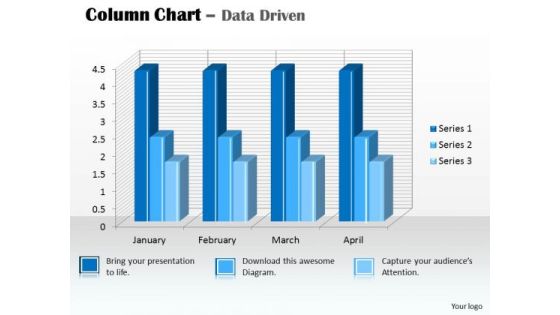
Data Analysis In Excel 3d Column Chart For PowerPoint Templates
Our data analysis in excel 3d column chart for Powerpoint Templates And Your Ideas Make A Great Doubles Pair. Play The Net With Assured Hands.

Data Analysis In Excel Of Stock Chart PowerPoint Templates
Plan Your Storyboard With Our data analysis in excel of stock chart Powerpoint Templates . Give An Outline To The Solutions You Have.

Data Analysis Programs 3d Bar Chart To Dispaly PowerPoint Templates
Lower The Drawbridge With Our data analysis programs 3d bar chart to dispaly Powerpoint Templates . Capture The Minds Of Your Audience.
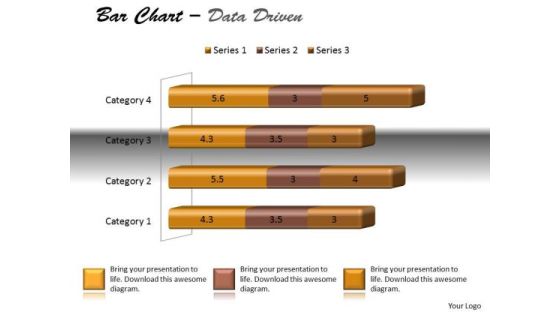
Data Analysis Techniques 3d Bar Chart For Modification PowerPoint Templates
Dreams Generate Thoughts, Thoughts Generate Ideas. Give Them Life With Our data analysis techniques 3d bar chart for modification Powerpoint Templates .

Data Analysis Template Driven Visualization Area Chart PowerPoint Slides Templates
Draw On The Energy Of Our data analysis template driven visualization area chart powerpoint slides Templates . Your Thoughts Will Perk Up.

Data Analysis Template Forex Market Bar Chart PowerPoint Templates
Attract A Crowd With Our data analysis template forex market bar chart Powerpoint Templates . They Will Drop It All And Come To Hear You.

Financial Data Analysis Area Chart For Showing Trends PowerPoint Templates
Document Your Views On Our financial data analysis area chart for showing trends Powerpoint Templates . They Will Create A Strong Impression.
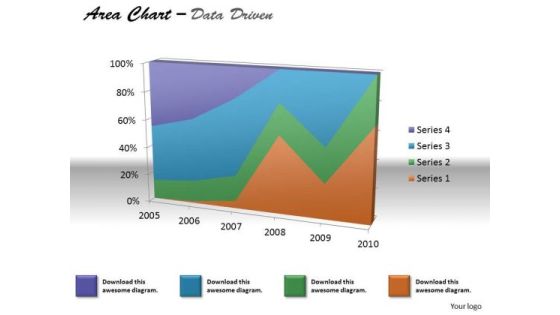
Financial Data Analysis Area Chart For Various Values PowerPoint Templates
Document The Process On Our financial data analysis area chart for various values Powerpoint Templates . Make A Record Of Every Detail.
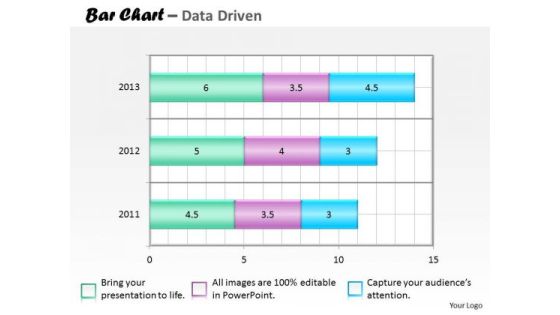
Financial Data Analysis Bar Chart For Collection Of PowerPoint Templates
Our financial data analysis bar chart for collection of Powerpoint Templates Team Are A Dogged Lot. They Keep At It Till They Get It Right.

Financial Data Analysis Currency Trading Bar Chart PowerPoint Templates
Put In A Dollop Of Our financial data analysis currency trading bar chart Powerpoint Templates . Give Your Thoughts A Distinctive Flavor.
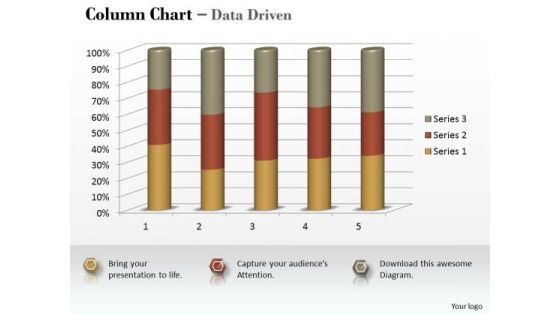
Marketing Data Analysis 3d Statistical Process Column Chart PowerPoint Templates
Be A Donor Of Great Ideas. Display Your Charity On Our marketing data analysis 3d statistical process column chart Powerpoint Templates .
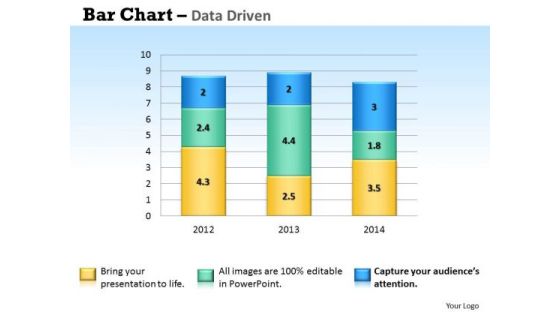
Microsoft Excel Data Analysis Bar Chart To Handle PowerPoint Templates
Our microsoft excel data analysis bar chart to handle Powerpoint Templates And Your Ideas Make A Great Doubles Pair. Play The Net With Assured Hands.

Multivariate Data Analysis Numeric Values Surface Chart PowerPoint Templates
Your Grasp Of Economics Is Well Known. Help Your Audience Comprehend Issues With Our multivariate data analysis numeric values surface chart Powerpoint Templates .
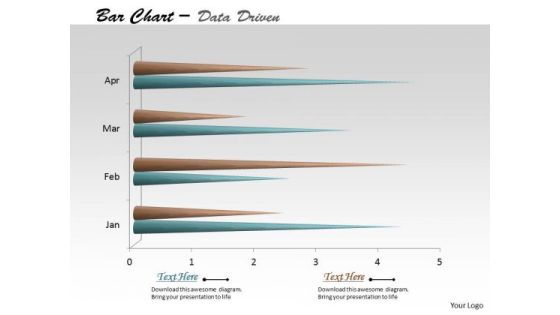
Multivariate Data Analysis Time Based Bar Chart PowerPoint Templates
Edit Your Work With Our multivariate data analysis time based bar chart Powerpoint Templates . They Will Help You Give The Final Form.
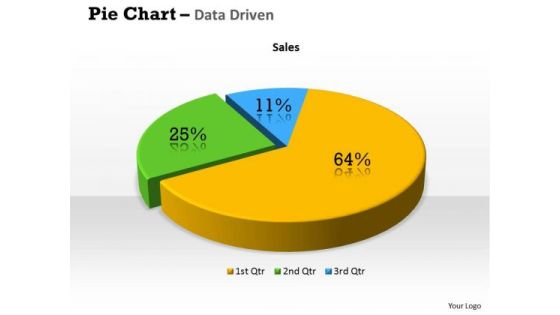
Quantitative Data Analysis 3d Percentage Ratio Pie Chart PowerPoint Templates
Plan Your Storyboard With Our quantitative data analysis 3d percentage ratio pie chart Powerpoint Templates . Give An Outline To The Solutions You Have.

Quantitative Data Analysis Bar Chart For Different Categories PowerPoint Templates
Make Some Dough With Our quantitative data analysis bar chart for different categories Powerpoint Templates . Your Assets Will Rise Significantly.

Quantitative Data Analysis Bar Chart For Financial Markets PowerPoint Templates
Draft It Out On Our quantitative data analysis bar chart for financial markets Powerpoint Templates . Give The Final Touches With Your Ideas.
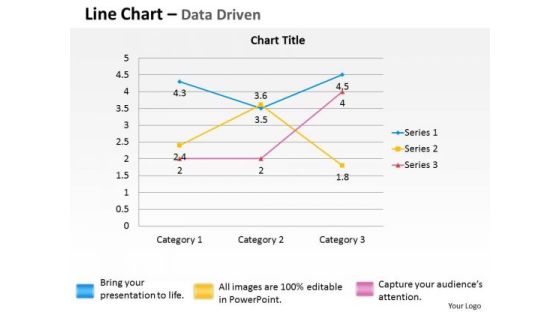
Quantitative Data Analysis Driven Economic Line Chart PowerPoint Slides Templates
Break The Deadlock With Our quantitative data analysis driven economic line chart powerpoint slides Templates . Let The Words Start To Flow.

Financial Predictions Ppt PowerPoint Presentation File Clipart Images
This is a financial predictions ppt powerpoint presentation file clipart images. This is a three stage process. The stages in this process are revenue, expense, aggregate net income, monthly breakeven, aggregate breakeven.

Business Data Analysis Chart Comparing Multiple Entities PowerPoint Templates
Analyze Ailments On Our business data analysis chart comparing multiple entities Powerpoint Templates. Bring Out The Thinking Doctor In You. Dock Your Thoughts With Our Financial Analysis . They Will Launch Them Into Orbit.
Incident Management Chart Change Execution Plan Ppt PowerPoint Presentation Icon Diagrams PDF
This slide illustrates the incidents of the transition project. It covers the details such as explanation, status, priority, and resolution of the incident to ensure that technological change is successfully completed in the organization. Deliver and pitch your topic in the best possible manner with this Incident Management Chart Change Execution Plan Ppt PowerPoint Presentation Icon Diagrams PDF. Use them to share invaluable insights on Incident Status Priority, Cyber Attack Sensitive, Added Data Security and impress your audience. This template can be altered and modified as per your expectations. So, grab it now.
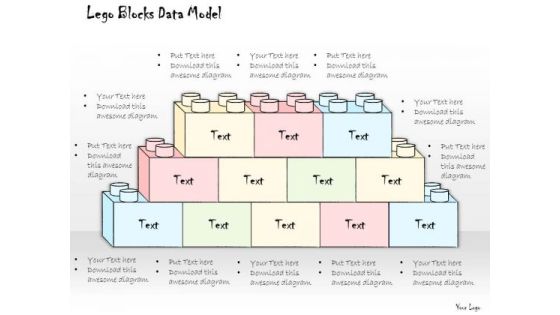
Ppt Slide Lego Blocks Data Model Consulting Firms
Our PPT Slide Lego Blocks Data Model Consulting Firms Powerpoint Templates Enjoy Drama. They Provide Entertaining Backdrops. Our Consulting Firms Powerpoint Templates Help To Make A Draft. They Give You A Good Place To Start.
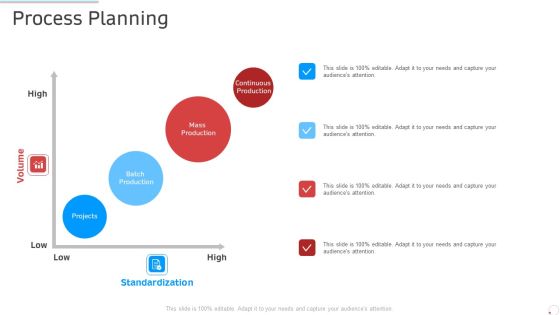
Process Planning Manufacturing Control Ppt Layouts Diagrams PDF
This is a process planning manufacturing control ppt layouts diagrams pdf template with various stages. Focus and dispense information on four stages using this creative set, that comes with editable features. It contains large content boxes to add your information on topics like projects, batch production, mass production, continuous production. You can also showcase facts, figures, and other relevant content using this PPT layout. Grab it now.

Integrating Aiops To Enhance Process Effectiveness Predictive Analysis Process In Aiops Diagrams PDF
Explore a selection of the finest Integrating Aiops To Enhance Process Effectiveness Predictive Analysis Process In Aiops Diagrams PDF here. With a plethora of professionally designed and pre-made slide templates, you can quickly and easily find the right one for your upcoming presentation. You can use our Integrating Aiops To Enhance Process Effectiveness Predictive Analysis Process In Aiops Diagrams PDF to effectively convey your message to a wider audience. Slidegeeks has done a lot of research before preparing these presentation templates. The content can be personalized and the slides are highly editable. Grab templates today from Slidegeeks.
Six Steps Of Bidding Process With Icons Ppt PowerPoint Presentation Pictures Guide
Presenting this set of slides with name six steps of bidding process with icons ppt powerpoint presentation pictures guide. This is a six stage process. The stages in this process are develop bid specifications, qualifying vendors, develop bid summary, present bid summary to board, award the project. This is a completely editable PowerPoint presentation and is available for immediate download. Download now and impress your audience.

Strategic Implementation Model For Improving Operational Efficiency Ppt PowerPoint Presentation Styles Clipart Images PDF
Presenting strategic implementation model for improving operational efficiency ppt powerpoint presentation styles clipart images pdf to dispense important information. This template comprises six stages. It also presents valuable insights into the topics including build your strategy, communication your strategy, prioritize your strategy, strategy progress, must win projects. This is a completely customizable PowerPoint theme that can be put to use immediately. So, download it and address the topic impactfully.

Predictive Analytics Benefits Ppt PowerPoint Presentation Professional Samples
This is a predictive analytics benefits ppt powerpoint presentation professional samples. This is a five stage process. The stages in this process are business, finance, marketing, strategy, analysis.
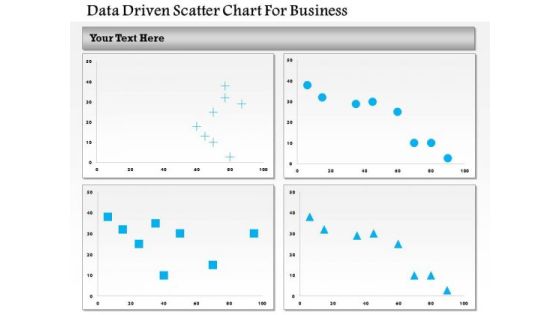
Business Diagram Data Driven Scatter Chart For Business PowerPoint Slide
This business diagram has been designed with four comparative charts. This slide suitable for data representation. You can also use this slide to present business analysis and reports. Use this diagram to present your views in a wonderful manner.
Identify Value Impacting Deliverables Icons PDF
This template covers the guidelines for identifying and validating the top three to five value-added IT services apps or projects. Presenting identify value impacting deliverables icons pdf to provide visual cues and insights. Share and navigate important information on three stages that need your due attention. This template can be used to pitch topics like transaction systems, optimization, service, risk mitigation, revenue impact. In addtion, this PPT design contains high resolution images, graphics, etc, that are easily editable and available for immediate download.
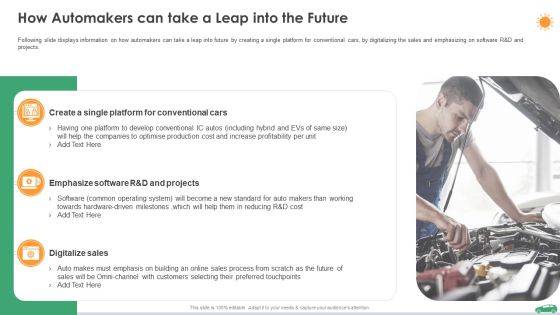
How Automakers Can Take A Leap Into The Future Ppt Pictures Objects PDF
Following slide displays information on how automakers can take a leap into future by creating a single platform for conventional cars, by digitalizing the sales and emphasizing on software R and D and projects. Deliver an awe inspiring pitch with this creative how automakers can take a leap into the future ppt pictures objects pdf bundle. Topics like software, develop, cost, process, customers can be discussed with this completely editable template. It is available for immediate download depending on the needs and requirements of the user.
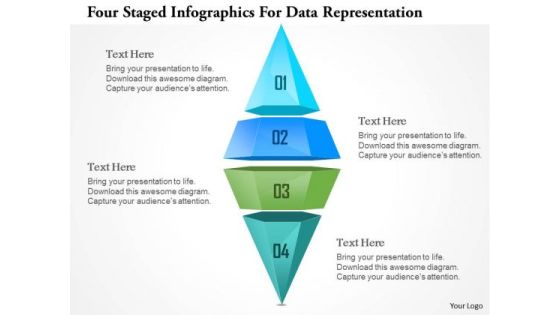
Busines Diagram Four Staged Ingographics For Data Representation Ppt Template
This business diagram has been designed with graphic of four staged info graphics. This info graphic can be used for data representation. Deliver amazing presentations to mesmerize your audience.

Active Ppt For Tenders And Bid Management Dashboard Microsoft PDF
This slide illustrates facts and figures related to bid management and PPT for tender submission. It includes active PPT for tenders, total PPT for tenders, awarded PPT for tenders, overdue PPT for tenders, etc. Presenting Active Ppt For Tenders And Bid Management Dashboard Microsoft PDF to dispense important information. This template comprises four stages. It also presents valuable insights into the topics including Project, Tender Name, Bid Invites. This is a completely customizable PowerPoint theme that can be put to use immediately. So, download it and address the topic impactfully.
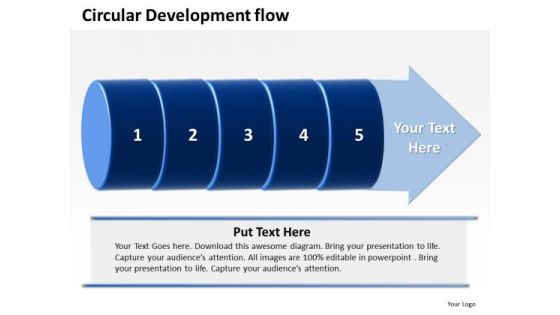
Ppt PowerPoint Presentation Circular Flow Of 5 Steps Involved Development Templates
PPT powerpoint presentation circular flow of 5 steps involved development Templates-The Business PowerPoint Diagram shows Circular flow of 5 steps involved in development of Business. It includes adding to, addition, adulthood, advance, advancement, advancing, augmentation, augmenting, boost, buildup, chrysalis etc.-PPT powerpoint presentation circular flow of 5 steps involved development Templates-Affiliate, Affiliation, Arrow, Business, Chart, Circular, Commerce, Concept, Contribution, Cycle, Development, Diagram, Idea, Informative, Internet, Join, Making, Manage, Management, Market, Marketing, Member, Money, Network, Partner, Partnership, Pay, Paying, Performance, Plans, Process, Productive, Productivity, Profit, Profitable, Project, Recruit, Recruiting, Recruitment, Refer, Referral, Referring, Revenue, Sales, Socialize, Steps, Strategy
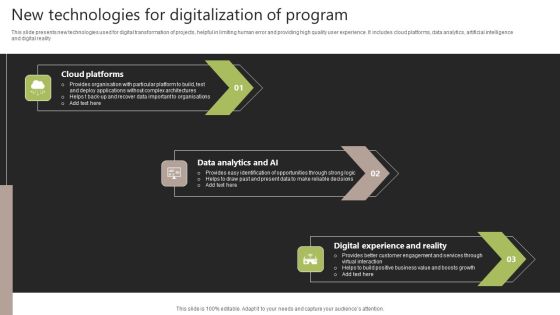
New Technologies For Digitalization Of Program Structure PDF
This slide presents new technologies used for digital transformation of projects, helpful in limiting human error and providing high quality user experience. It includes cloud platforms, data analytics, artificial intelligence and digital reality. Presenting New Technologies For Digitalization Of Program Structure PDF to dispense important information. This template comprises three stages. It also presents valuable insights into the topics including Cloud Platforms, Data Analytics AI, Digital Experience Reality. This is a completely customizable PowerPoint theme that can be put to use immediately. So, download it and address the topic impactfully.
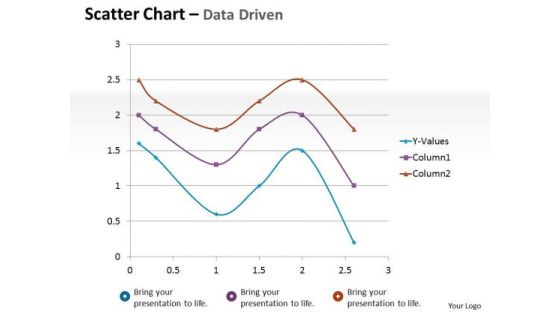
Financial Data Analysis Driven Scatter Chart Mathematical Diagram PowerPoint Slides Templates
Dominate Proceedings With Your Ideas. Our financial data analysis driven scatter chart mathematical diagram powerpoint slides Templates Will Empower Your Thoughts.

5 Steps Process For Efficient Supply Chain Management Rules PDF
This slide covers SQERT model process which for successfully managing the project. It steps are such as scope, quality, risk, time and effort.Presenting 5 Steps Process For Efficient Supply Chain Management Rules PDF to dispense important information. This template comprises five stages. It also presents valuable insights into the topics including Requirements, Analysis, Resource. This is a completely customizable PowerPoint theme that can be put to use immediately. So, download it and address the topic impactfully.

Business Diagram Laptop With Data Driven Area Chart PowerPoint Slide
This diagram has been designed with laptop and data driven area chart. Download this diagram to give your presentations more effective look. It helps in clearly conveying your message to clients and audience.

Ppt Correlative Seven PowerPoint Slide Numbers Of Business Process Templates
PPT correlative seven powerpoint slide numbers of business process Templates-This image has been professionally designed to emphasize distinct roles and functions you can link each layer to artifacts in your solution, such as projects, classes, and namespaces. Use this template to emphasize your views.-PPT correlative seven powerpoint slide numbers of business process Templates-3, Advice, Analysis, Analyze, Answer, Area, Career, Chart, Choice, Circles, Concept, Determination, Diagram, Graph, Idea, Illustration, Intersect, Measurement, Opportunities, Options, Overlap, Overlapped, Overlapping, Passion, Passionate, Prioritize, Priority, Profession

Ppt Pyramid Diagram Design PowerPoint Presentation Layout Templates
PPT pyramid diagram design powerpoint presentation layout Templates-Your ideas are fundamentally stable with a broad base of workable possibilities. Illustrate these thoughts with this slide. Discuss each one and slowly but surely move up the pyramid narrowing down to the best and most success oriented project.-PPT pyramid diagram design powerpoint presentation layout Templates-Business, Chart, Color, Data Pyramid, Diagram, Graph, Group, Growth, Hierarchy, Illustration, Layer, Layered, Layered Pyramid, Level, Multicolor, Object, Performance, Presentation, Progress, Pyramid, Rank, Seam, Segment, Set, Shape, Stage, Structure, Symbol, System, Top

Data Analytics Vector Icon Ppt PowerPoint Presentation Professional
Presenting this set of slides with name data analytics vector icon ppt powerpoint presentation professional. This is a four stage process. The stages in this process are data visualization icon, research analysis, business focus. This is a completely editable PowerPoint presentation and is available for immediate download. Download now and impress your audience.

Predictive Data Model Lifecycle Of Predictive Analytics Model Diagrams PDF
This slide depicts the lifecycle of the predictive analytics model, and it includes highlighting and formulating a problem, data preparation, information exploration, transforming and choosing, making, validating, and deploying a model, and then evaluating and monitoring results. If you are looking for a format to display your unique thoughts, then the professionally designed Predictive Data Model Lifecycle Of Predictive Analytics Model Diagrams PDF is the one for you. You can use it as a Google Slides template or a PowerPoint template. Incorporate impressive visuals, symbols, images, and other charts. Modify or reorganize the text boxes as you desire. Experiment with shade schemes and font pairings. Alter, share or cooperate with other people on your work. Download Predictive Data Model Lifecycle Of Predictive Analytics Model Diagrams PDF and find out how to give a successful presentation. Present a perfect display to your team and make your presentation unforgettable.

Business Diagram Flask With Data Driven Chart PowerPoint Slide
This data driven diagram has been designed with flask graphics. Download this diagram to give your presentations more effective look. It helps in clearly conveying your message to clients and audience.
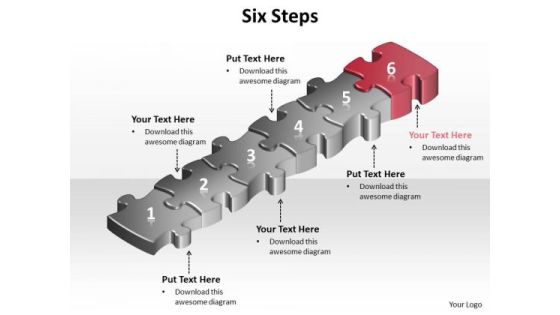
Ppt Red Layouts PowerPoint 2003 Jigsaw Puzzle 2010 Step Templates
PPT red layouts PowerPoint 2003 jigsaw puzzle 2010 step Templates-Use this Business based PowerPoint Diagram to represent the Business issues Graphically. It indicates arrange, block out, blueprint, cast, delineate, design, devise, draft, graph , lay out, outline, plot, project, shape, sketch etc.-PPT red layouts PowerPoint 2003 jigsaw puzzle 2010 step Templates-achievement, activity, adversity, bridge, built, business, cartoon, challenge, character, computer, concept, construction, creativity, decisions, figure, games, goal, graphic, icon, idea, intelligence, organization, people, planning, problems, puzzle, solution, stick, strategy, success
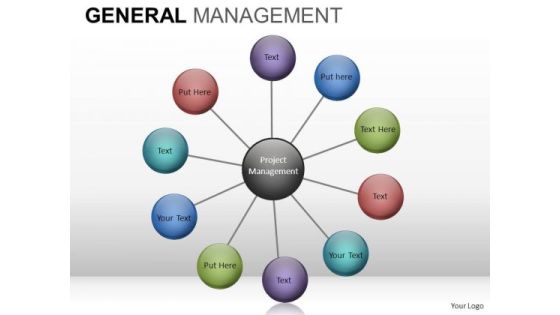
Wheel Chart Diagram PowerPoint Slides And Editable Ppt Templates Download
Wheel_Chart_Diagram_PowerPoint_slides_and_Editable_PPT_templates_Download-These high quality powerpoint pre-designed slides and powerpoint templates have been carefully created by our professional team to help you impress your audience. All slides have been created and are 100% editable in powerpoint. Each and every property of any graphic - color, size, orientation, shading, outline etc. can be modified to help you build an effective powerpoint presentation. Any text can be entered at any point in the powerpoint template or slide. Simply DOWNLOAD, TYPE and PRESENT! These PowerPoint presentation slides can be used to represent themes relating to --Abstract, action, analysis, blank, business, chart, clipart, commerce, concept, conceptual, design, diagram, direction, flow, generic, goals, guide, guidelines, heirarchy, icon, idea, illustration, lingakes, links, manage, management, mba, model, organization, performance, plan, process, project, relationship, representation, resource, steps, strategy, success, tactics, theoretical, theory, tool, workflow-Wheel_Chart_Diagram_PowerPoint_slides_and_Editable_PPT_templates_Download
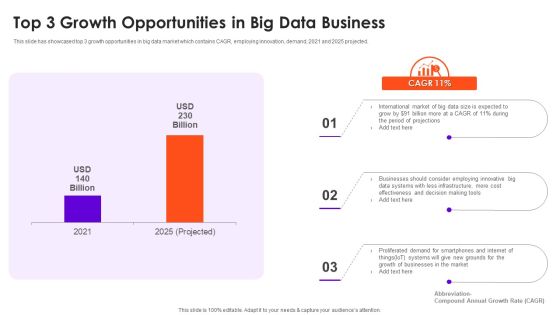
Top 3 Growth Opportunities In Big Data Business Download PDF
This slide has showcased top 3 growth opportunities in big data market which contains CAGR, employing innovation, demand, 2021 and 2025 projected. Pitch your topic with ease and precision using this Top 3 Growth Opportunities In Big Data Business Download PDF. This layout presents information on Cost, Businesses, Data Systems. It is also available for immediate download and adjustment. So, changes can be made in the color, design, graphics or any other component to create a unique layout.
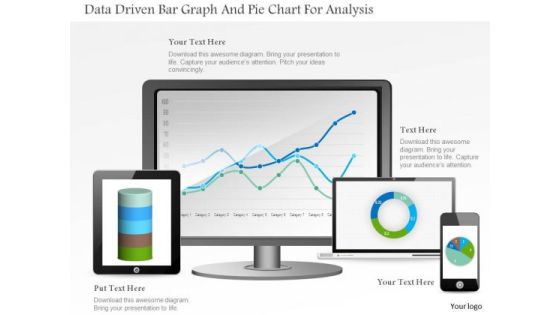
Business Diagram Data Driven Bar Graph And Pie Chart For Analysis PowerPoint Slide
This PowerPoint template displays technology gadgets with various business charts. Use this diagram slide, in your presentations to make business reports for statistical analysis. You may use this diagram to impart professional appearance to your presentations.
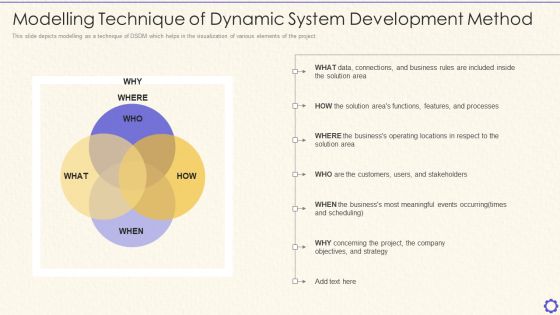
Dynamic System Development Method Tools And Techniques IT Modelling Technique Of Dynamic Structure PDF
This slide depicts modelling as a technique of DSDM which helps in the visualization of various elements of the project. This is a dynamic system development method tools and techniques it modelling technique of dynamic structure pdf template with various stages. Focus and dispense information on four stages using this creative set, that comes with editable features. It contains large content boxes to add your information on topics like connections, business, operating, locations, stakeholders. You can also showcase facts, figures, and other relevant content using this PPT layout. Grab it now.
File Transfer Data Management Vector Icon Ppt PowerPoint Presentation File Graphic Images
Presenting this set of slides with name file transfer data management vector icon ppt powerpoint presentation file graphic images. The topics discussed in these slides are data sources, database management, marketing. This is a completely editable PowerPoint presentation and is available for immediate download. Download now and impress your audience.

Accounting Control System Flowchart For Managing Payables Introduction PDF
The following slide showcases accounts payable flow chart to show ordinary people reference point while dealing with any project. It presents information related to operations, purchasing, etc. Showcasing this set of slides titled Accounting Control System Flowchart For Managing Payables Introduction PDF. The topics addressed in these templates are Purchase Approver, Purchasing Manager, Expense Payment. All the content presented in this PPT design is completely editable. Download it and make adjustments in color, background, font etc. as per your unique business setting.
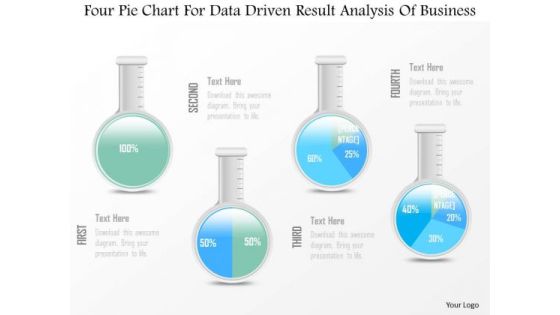
Business Diagram Four Pie Chart For Data Driven Result Analysis Of Business PowerPoint Slide
This business diagram displays graphic of pie charts in shape of flasks. This business slide is suitable to present and compare business data. Use this diagram to build professional presentations for your viewers.

Business Diagram 3d Thumb Chart And Tablet For Data Representation PowerPoint Slide
This business diagram displays graphic of 3d thumb up chart with icons on computer screen. This business slide contains the concept of business data representation. Use this diagram to build professional presentations for your viewers.

Data Interpretation With Tick Mark Simplify Vector Icon Ppt PowerPoint Presentation Gallery Format Ideas PDF
Pitch your topic with ease and precision using this data interpretation with tick mark simplify vector icon ppt powerpoint presentation gallery format ideas pdf. This layout presents information on data interpretation with tick mark simplify vector icon. It is also available for immediate download and adjustment. So, changes can be made in the color, design, graphics or any other component to create a unique layout.

Cash Market Investor Deck Table Of Content Ppt Icon Backgrounds PDF
This is a cash market investor deck table of content products ppt summary design inspiration pdf template with various stages. Focus and dispense information on one stage using this creative set, that comes with editable features. It contains large content boxes to add your information on topics like market valuation, shareholding structure, historical and projection, financial, competitive analysis. You can also showcase facts, figures, and other relevant content using this PPT layout. Grab it now.
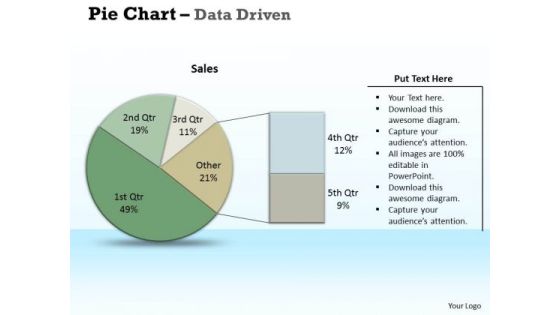
Examples Of Data Analysis Market Driven Pie Chart Research PowerPoint Slides Templates
Chalk It Up With Our examples of data analysis market driven pie chart research powerpoint slides Templates . Add To The Credits Of Your Ideas.
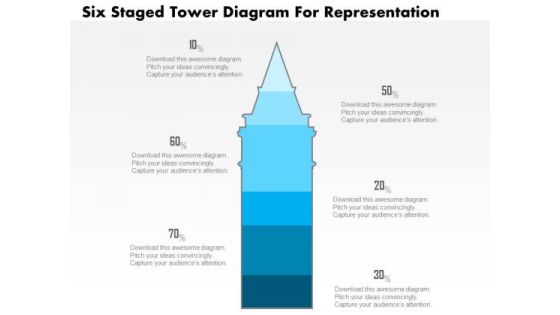
Business Diagram Five Staged Tower Diagram For Representation PowerPoint Slide
This business slide displays five staged tower diagram. It contains blue tower graphic divided into five parts. This diagram slide depicts processes, stages, steps, points, options information display. Use this diagram, in your presentations to express your views innovatively.
Risk Assessment Decision Tree Analysis To Evaluate Options Icons PDF
This slide exhibits decision tree analysis to help identify suitable contractors for the project. It includes vendor decisions, the chance of being late and path value. From laying roadmaps to briefing everything in detail, our templates are perfect for you. You can set the stage with your presentation slides. All you have to do is download these easy to edit and customizable templates. Risk Assessment Decision Tree Analysis To Evaluate Options Icons PDF will help you deliver an outstanding performance that everyone would remember and praise you for. Do download this presentation today.

2021 Schedule For Branding And Marketing Ppt PowerPoint Presentation Outline Icon PDF
Pitch your topic with ease and precision using this 2021 schedule for branding and marketing ppt powerpoint presentation outline icon pdf. This layout presents information on market analysis, business plans, price definition, projections, sales strategy, branding and marketing, team development, research, strategy, action, concurrent. It is also available for immediate download and adjustment. So, changes can be made in the color, design, graphics or any other component to create a unique layout.
Six Stages Of Effective Network Design Process With Icons Ppt PowerPoint Presentation Professional Brochure PDF
Presenting this set of slides with name six stages of effective network design process with icons ppt powerpoint presentation professional brochure pdf. This is a six stage process. The stages in this process are create scenarios, evaluate alternatives, detail and do, orient project, define variables , analyze sensitivities . This is a completely editable PowerPoint presentation and is available for immediate download. Download now and impress your audience.
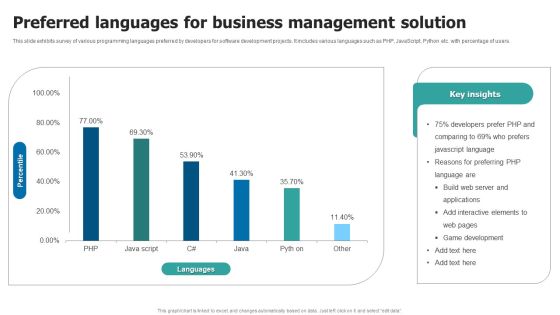
Preferred Languages For Business Management Solution Guidelines PDF
This slide exhibits survey of various programming languages preferred by developers for software development projects. It includes various languages such as PHP, JavaScript, Python etc. with percentage of users. Showcasing this set of slides titled Preferred Languages For Business Management Solution Guidelines PDF. The topics addressed in these templates are Preferred Languages, Business Management Solution. All the content presented in this PPT design is completely editable. Download it and make adjustments in color, background, font etc. as per your unique business setting.

Artificial Intelligence Playbook Key Capabilities Required For Ai Success Demonstration PDF
Mentioned slide showcases details about the capabilities required for successful implementation of AI pilot project. Capabilities covered are technology platform, talent, repository and workflow. This is a artificial intelligence playbook key capabilities required for ai success demonstration pdf template with various stages. Focus and dispense information on four stages using this creative set, that comes with editable features. It contains large content boxes to add your information on topics like technology platform, workflow, talent, repository. You can also showcase facts, figures, and other relevant content using this PPT layout. Grab it now.

Big Data Management In Automobile Industry Ppt Icon Example PDF
This slide explains the big data use cases in the automobile industry and how it would help automobile firms in supply chain management, connected cars, automobile financing, predictive analysis, and design and production. This is a big data management in automobile industry ppt icon example pdf template with various stages. Focus and dispense information on five stages using this creative set, that comes with editable features. It contains large content boxes to add your information on topics like supply chain management, automobile financing, predictive analysis, design, production. You can also showcase facts, figures, and other relevant content using this PPT layout. Grab it now.
Progress Assessment Outline Need For BSC Ppt PowerPoint Presentation Icon Example Topics PDF
Presenting this set of slides with name progress assessment outline need for bsc ppt powerpoint presentation icon example topics pdf. This is a six stage process. The stages in this process are improves organization performance, prioritize, projects, initiatives, focuses future performance, increases focus strategy and results, align organization strategy workers, improves communication vision and strategy. This is a completely editable PowerPoint presentation and is available for immediate download. Download now and impress your audience.
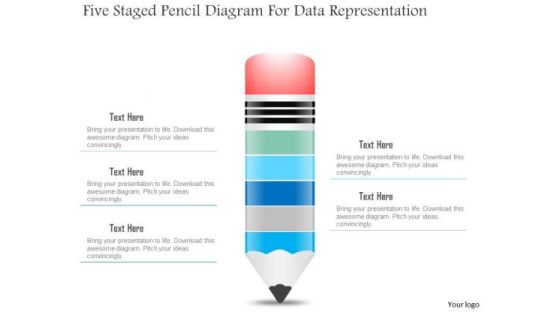
Business Diagram Five Staged Pencil Diagram For Data Representation PowerPoint Slide
This business slide displays five staged pencil diagram. It contains pencil graphic divided into five parts. This diagram slide depicts processes, stages, steps, points, options and education information display. Use this diagram, in your presentations to express your views innovatively.

Database Management Vector Icon Ppt PowerPoint Presentation Professional Format Ideas
Presenting this set of slides with name database management vector icon ppt powerpoint presentation professional format ideas. The topics discussed in these slides are data sources, database management, marketing. This is a completely editable PowerPoint presentation and is available for immediate download. Download now and impress your audience.

Business Intelligence And Big Key Training Skills For Data Analytics Program Guidelines PDF
This slide highlights multiple skills required for conducting the data analytics project. It includes skills such as python, data mining skills, predictive modeling skills and many more. This is a business intelligence and big key training skills for data analytics program guidelines pdf template with various stages. Focus and dispense information on twelve stages using this creative set, that comes with editable features. It contains large content boxes to add your information on topics like regression analytics, data mining, data visualization using tableau, statistical analytics, predictive modelling. You can also showcase facts, figures, and other relevant content using this PPT layout. Grab it now.

How To Build A Revenue Funnel Impact Analysis Predictive Mapping To Increase Representative Efforts Ideas PDF
This slide portrays information regarding the ability to prioritize sales representatives call lists in real time, workflow will collaborate with increased representative efforts to improve close rates and ultimately increase sales revenues. Deliver an awe inspiring pitch with this creative how to build a revenue funnel impact analysis predictive mapping to increase representative efforts ideas pdf bundle. Topics like impact analysis predictive mapping to increase representative efforts can be discussed with this completely editable template. It is available for immediate download depending on the needs and requirements of the user.

Skills Of Information Technology Blockchain Developer Ppt PowerPoint Presentation Infographic Template Graphics Template PDF
Presenting skills of information technology blockchain developer ppt powerpoint presentation infographic template graphics template pdf. to dispense important information. This template comprises one stages. It also presents valuable insights into the topics including primary skills, strong background in software development, experience working with open-source projects, experience working with large codebases. This is a completely customizable PowerPoint theme that can be put to use immediately. So, download it and address the topic impactfully.

AI Playbook For Business Stage Four Staffing Requirements For AI Implementation Diagrams PDF
Following slide provides information about the resources required for successfully implementing the AI pilot project. Elements covered in the table are staffing requirement, and role description. Deliver an awe inspiring pitch with this creative AI Playbook For Business Stage Four Staffing Requirements For AI Implementation Diagrams PDF bundle. Topics like Staffing Requirement, Role Description, Staffing Requirement can be discussed with this completely editable template. It is available for immediate download depending on the needs and requirements of the user.

Agile QA Procedure Post Implementation Agile Quality Assurance Process Pictures PDF
This slide shows the impact statistics of introducing agile quality assurance model upon company profits, loss, revenue along with the status of ongoing software projects. Deliver and pitch your topic in the best possible manner with this agile qa procedure framework of agile quality assurance process plan inspiration pdf. Use them to share invaluable insights on gap analysis of quality assurance process and impress your audience. This template can be altered and modified as per your expectations. So, grab it now.
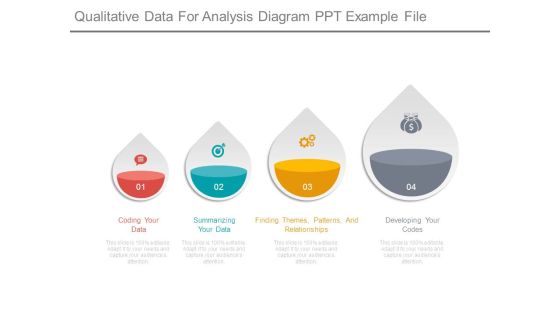
Qualitative Data For Analysis Diagram Ppt Example File
This is a qualitative data for analysis diagram ppt example file. This is a four stage process. The stages in this process are coding your data, summarizing your data, finding themes, patterns, and relationships, developing your codes.

Data Analysis Excel Driven Pie Chart For Business Stratregy PowerPoint Slides Templates
Open Up Doors That Lead To Success. Our data analysis excel driven pie chart for business stratregy powerpoint slides Templates Provide The Handles.
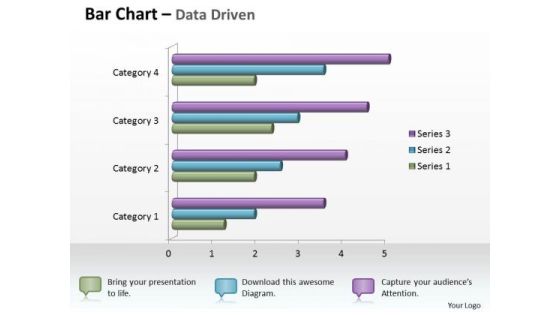
Data Analysis In Excel 3d Bar Chart For Business Statistics PowerPoint Templates
Knock On The Door To Success With Our data analysis in excel 3d bar chart for business statistics Powerpoint Templates . Be Assured Of Gaining Entry.

Data Analysis Template Driven Stock Chart For Market Trends PowerPoint Slides Templates
Drive Your Team Along The Road To Success. Take The Wheel With Our data analysis template driven stock chart for market trends powerpoint slides Templates .
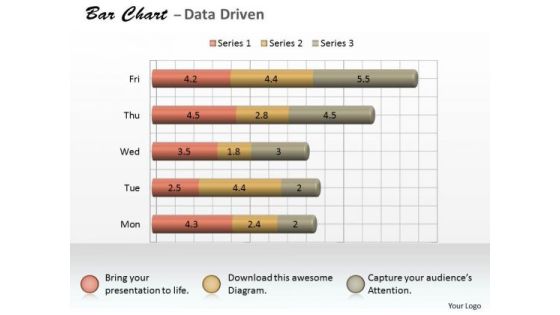
Microsoft Excel Data Analysis 3d Bar Chart As Research Tool PowerPoint Templates
Knock On The Door To Success With Our microsoft excel data analysis 3d bar chart as research tool Powerpoint Templates . Be Assured Of Gaining Entry.

Company History From 2005 To 2022 Web Design And Development Company Profile Themes PDF
This slide covers the company history from 2005 to 2022 which includes achieved milestones such as company incorporation, business expansion, acquisition, partnership, received projects, etc Slidegeeks is one of the best resources for PowerPoint templates. You can download easily and regulate Company History From 2005 To 2022 Web Design And Development Company Profile Themes PDF for your personal presentations from our wonderful collection. A few clicks is all it takes to discover and get the most relevant and appropriate templates. Use our Templates to add a unique zing and appeal to your presentation and meetings. All the slides are easy to edit and you can use them even for advertisement purposes.
Reinforcement Learning Techniques And Applications Performance Tracking Dashboard Reinforcement Diagrams PDF
This slide shows the roadmap for the reinforcement learning project, including the list of tasks to be performed from March 2023 to February 2024. The tasks include initializing the values table, observing the current state, choosing an action for that state, and so on. Formulating a presentation can take up a lot of effort and time, so the content and message should always be the primary focus. The visuals of the PowerPoint can enhance the presenters message, so our Reinforcement Learning Techniques And Applications Performance Tracking Dashboard Reinforcement Diagrams PDF was created to help save time. Instead of worrying about the design, the presenter can concentrate on the message while our designers work on creating the ideal templates for whatever situation is needed. Slidegeeks has experts for everything from amazing designs to valuable content, we have put everything into Reinforcement Learning Techniques And Applications Performance Tracking Dashboard Reinforcement Diagrams PDF

5 Principles Visual For Predictive Pricing Model Ppt PowerPoint Presentation File Gallery PDF
Presenting 5 principles visual for predictive pricing model ppt powerpoint presentation file gallery pdf to dispense important information. This template comprises five stages. It also presents valuable insights into the topics including 5 principles visual for predictive pricing model. This is a completely customizable PowerPoint theme that can be put to use immediately. So, download it and address the topic impactfully.

6 Elements Slide For Predictive Pricing Model Ppt PowerPoint Presentation Gallery Picture PDF
Presenting 6 elements slide for predictive pricing model ppt powerpoint presentation gallery picture pdf to dispense important information. This template comprises six stages. It also presents valuable insights into the topics including 6 elements slide for predictive pricing model. This is a completely customizable PowerPoint theme that can be put to use immediately. So, download it and address the topic impactfully.

Predictive Analytics Implementation In Retail Industry Forward Looking Analysis IT Diagrams PDF
This slide represents the application of predictive analytics technology in the retail industry in customer behavior analysis, improved customer service and experience, better customer segmentation, and enhanced inventory management.Formulating a presentation can take up a lot of effort and time, so the content and message should always be the primary focus. The visuals of the PowerPoint can enhance the presenters message, so our Predictive Analytics Implementation In Retail Industry Forward Looking Analysis IT Diagrams PDF was created to help save time. Instead of worrying about the design, the presenter can concentrate on the message while our designers work on creating the ideal templates for whatever situation is needed. Slidegeeks has experts for everything from amazing designs to valuable content, we have put everything into Predictive Analytics Implementation In Retail Industry Forward Looking Analysis IT Diagrams PDF.

Business Idea Financer For Seed Funding Microsoft PDF
The following slide illustrates the one page business plan for seed funding, which highlights the business concept, team structure and financial projections. Showcasing this set of slides titled Business Idea Financer For Seed Funding Microsoft PDF. The topics addressed in these templates are Application, Develop, Business Concept. All the content presented in this PPT design is completely editable. Download it and make adjustments in color, background, font etc. as per your unique business setting.
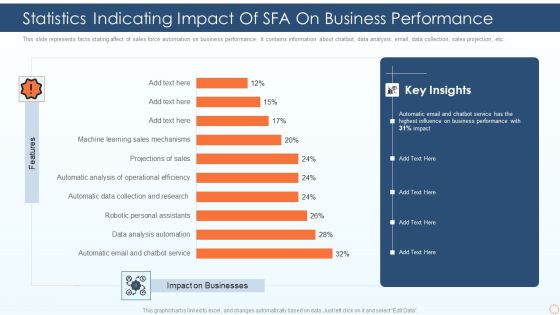
Statistics Indicating Impact Of SFA On Business Performance Ppt PowerPoint Presentation Gallery Outfit PDF
This slide represents facts stating affect of sales force automation on business performance. It contains information about chatbot, data analysis, email, data collection, sales projection, etc. Pitch your topic with ease and precision using this statistics indicating impact of sfa on business performance ppt powerpoint presentation gallery outfit pdf. This layout presents information on automatic email and chatbot service, data analysis automation, robotic personal assistants. It is also available for immediate download and adjustment. So, changes can be made in the color, design, graphics or any other component to create a unique layout.

Ppt Circular Interpretation Of 9 Steps Involved Procedure PowerPoint Templates
PPT circular interpretation of 9 steps involved procedure PowerPoint Templates-Use this Circular flow diagram to describe key strategic issues and information flows and internal communication.-PPT circular interpretation of 9 steps involved procedure PowerPoint Templates-Affiliate, Affiliation, Arrow, Business, Chart, Circular, Commerce, Concept, Contribution, Cycle, Development, Diagram, Idea, Informative, Internet, Join, Making, Manage, Management, Market, Marketing, Member, Money, Network, Partner, Partnership, Pay, Paying, Performance, Plans, Process, Productive, Productivity, Profit, Profitable, Project, Recruit, Recruiting, Recruitment, Refer, Referral, Referring, Revenue, Sales, Socialize, Steps, Strategy

Ppt Circular Interpretation Of 12 Steps Involved Procedure PowerPoint Templates
PPT circular interpretation of 12 steps involved procedure PowerPoint Templates-Use this Circular flow diagram to describe key strategic issues and information flows and internal communication.-PPT circular interpretation of 12 steps involved procedure PowerPoint Templates-Affiliate, Affiliation, Arrow, Business, Chart, Circular, Commerce, Concept, Contribution, Cycle, Development, Diagram, Idea, Informative, Internet, Join, Making, Manage, Management, Market, Marketing, Member, Money, Network, Partner, Partnership, Pay, Paying, Performance, Plans, Process, Productive, Productivity, Profit, Profitable, Project, Recruit, Recruiting, Recruitment, Refer, Referral, Referring, Revenue, Sales, Socialize, Steps, Strategy

Application Of Artificial Intelligence AI Driven Predictive Analysis For Business Icon Brochure PDF
Presenting Application Of Artificial Intelligence AI Driven Predictive Analysis For Business Icon Brochure PDF to dispense important information. This template comprises four stages. It also presents valuable insights into the topics including Application, Artificial Intelligence, AI Driven, Predictive Analysis, Business Icon. This is a completely customizable PowerPoint theme that can be put to use immediately. So, download it and address the topic impactfully.
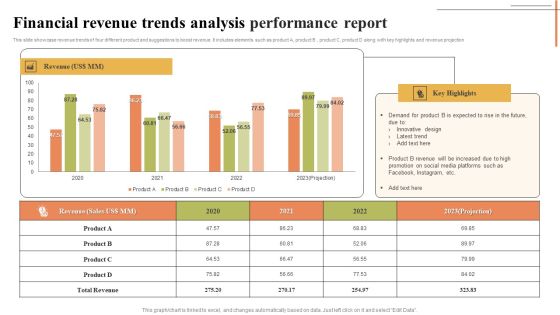
Financial Revenue Trends Analysis Performance Report Designs PDF
This slide showcase revenue trends of four different product and suggestions to boost revenue. It includes elements such as product A, product B , product C, product D along with key highlights and revenue projection. Showcasing this set of slides titled Financial Revenue Trends Analysis Performance Report Designs PDF. The topics addressed in these templates are Revenue, Innovative Design, Latest Trend. All the content presented in this PPT design is completely editable. Download it and make adjustments in color, background, font etc. as per your unique business setting.

Six Steps Action Plan To Develop Effective Cyber Security Strategy Ppt Layouts Designs Download PDF
This slide signifies the six stage implementation plan to create effective cyber security project. It covers information about steps like identify, analyse, evaluate, prioritise, treat and monitor. Presenting Six Steps Action Plan To Develop Effective Cyber Security Strategy Ppt Layouts Designs Download PDF to dispense important information. This template comprises six stages. It also presents valuable insights into the topics including Identify, Monitor, Priorities, Evaluate. This is a completely customizable PowerPoint theme that can be put to use immediately. So, download it and address the topic impactfully.

Business Diagram Alarm Clock With Pie Chart For Result Analysis PowerPoint Slide
This business slide displays alarm clock with pie chart. This diagram is a data visualization tool that gives you a simple way to present statistical information. This slide helps your audience examine and interpret the data you present.
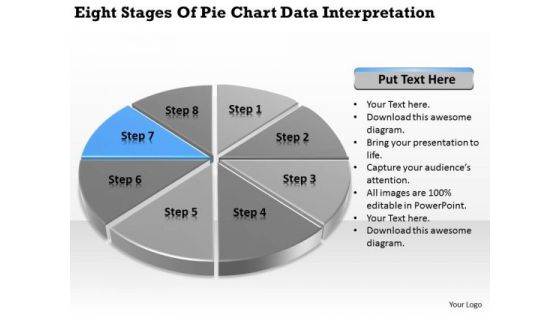
Stages Of Pie Chart Data Interpretation Business Plan Template PowerPoint Templates
We present our stages of pie chart data interpretation business plan template PowerPoint templates.Download and present our Circle Charts PowerPoint Templates because You can Stir your ideas in the cauldron of our PowerPoint Templates and Slides. Cast a magic spell on your audience. Download our Marketing PowerPoint Templates because Our PowerPoint Templates and Slides will let you Hit the target. Go the full distance with ease and elan. Use our Business PowerPoint Templates because Our PowerPoint Templates and Slides are truly out of this world. Even the MIB duo has been keeping tabs on our team. Download our Shapes PowerPoint Templates because Watching this your Audience will Grab their eyeballs, they wont even blink. Download our Process and Flows PowerPoint Templates because It will Give impetus to the hopes of your colleagues. Our PowerPoint Templates and Slides will aid you in winning their trust.Use these PowerPoint slides for presentations relating to achievement, analysis, background, bank, banking, business, calculation, chart, circle, commerce, commercial, commission, concept, credit, crisis, debt, deposit, design, detail, diagram, earnings, economics, economy, element, finance, goal, gold, golden, graph, graphic, growth, icon, idea, illustration, income, increase, invest, isolated, level, loss, market, marketing, metal, modern, money, new, object, part, percent, percentage, pie, plot, politics, profit, progress, ratio, reflection, reflective. The prominent colors used in the PowerPoint template are Blue, Gray, Black.
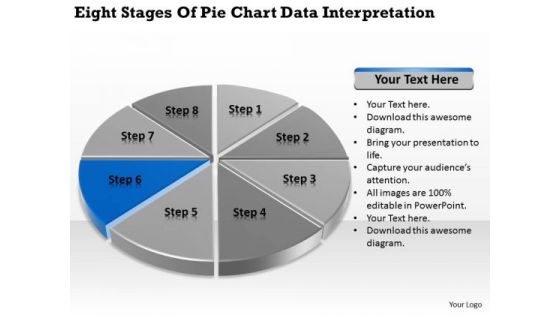
Stages Of Pie Chart Data Interpretation Example Business Plan PowerPoint Slides
We present our stages of pie chart data interpretation example business plan PowerPoint Slides.Download and present our Circle Charts PowerPoint Templates because It will let you Set new benchmarks with our PowerPoint Templates and Slides. They will keep your prospects well above par. Download our Marketing PowerPoint Templates because Our PowerPoint Templates and Slides will weave a web of your great ideas. They are gauranteed to attract even the most critical of your colleagues. Use our Business PowerPoint Templates because It will Strengthen your hand with your thoughts. They have all the aces you need to win the day. Present our Shapes PowerPoint Templates because It will get your audience in sync. Present our Process and Flows PowerPoint Templates because Our PowerPoint Templates and Slides will generate and maintain the level of interest you desire. They will create the impression you want to imprint on your audience.Use these PowerPoint slides for presentations relating to achievement, analysis, background, bank, banking, business, calculation, chart, circle, commerce, commercial, commission, concept, credit, crisis, debt, deposit, design, detail, diagram, earnings, economics, economy, element, finance, goal, gold, golden, graph, graphic, growth, icon, idea, illustration, income, increase, invest, isolated, level, loss, market, marketing, metal, modern, money, new, object, part, percent, percentage, pie, plot, politics, profit, progress, ratio, reflection, reflective. The prominent colors used in the PowerPoint template are Blue navy, Gray, Black.

Stages Of Pie Chart Data Interpretation How To Write Business Plan PowerPoint Templates
We present our stages of pie chart data interpretation how to write business plan PowerPoint templates.Present our Circle Charts PowerPoint Templates because Our PowerPoint Templates and Slides will provide you a launch platform. Give a lift off to your ideas and send them into orbit. Present our Marketing PowerPoint Templates because Our PowerPoint Templates and Slides will let you Hit the right notes. Watch your audience start singing to your tune. Use our Business PowerPoint Templates because Our PowerPoint Templates and Slides come in all colours, shades and hues. They help highlight every nuance of your views. Download our Shapes PowerPoint Templates because It can Leverage your style with our PowerPoint Templates and Slides. Charm your audience with your ability. Use our Process and Flows PowerPoint Templates because You can Connect the dots. Fan expectations as the whole picture emerges.Use these PowerPoint slides for presentations relating to achievement, analysis, background, bank, banking, business, calculation, chart, circle, commerce, commercial, commission, concept, credit, crisis, debt, deposit, design, detail, diagram, earnings, economics, economy, element, finance, goal, gold, golden, graph, graphic, growth, icon, idea, illustration, income, increase, invest, isolated, level, loss, market, marketing, metal, modern, money, new, object, part, percent, percentage, pie, plot, politics, profit, progress, ratio, reflection, reflective. The prominent colors used in the PowerPoint template are Blue, Gray, Black.
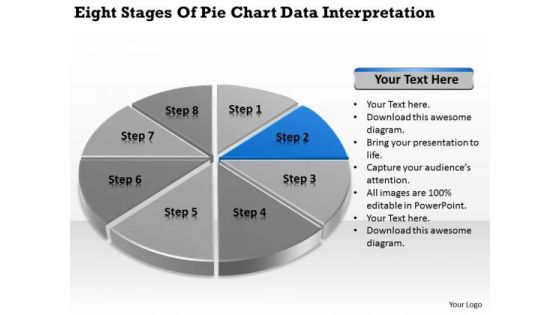
Stages Of Pie Chart Data Interpretation Vending Machine Business Plan PowerPoint Slides
We present our stages of pie chart data interpretation vending machine business plan PowerPoint Slides.Present our Circle Charts PowerPoint Templates because You should Bet on your luck with our PowerPoint Templates and Slides. Be assured that you will hit the jackpot. Present our Marketing PowerPoint Templates because Our PowerPoint Templates and Slides will provide you the cutting edge. Slice through the doubts in the minds of your listeners. Download our Business PowerPoint Templates because you should Experience excellence with our PowerPoint Templates and Slides. They will take your breath away. Download our Shapes PowerPoint Templates because It will Raise the bar of your Thoughts. They are programmed to take you to the next level. Present our Process and Flows PowerPoint Templates because Our PowerPoint Templates and Slides will give good value for money. They also have respect for the value of your time.Use these PowerPoint slides for presentations relating to achievement, analysis, background, bank, banking, business, calculation, chart, circle, commerce, commercial, commission, concept, credit, crisis, debt, deposit, design, detail, diagram, earnings, economics, economy, element, finance, goal, gold, golden, graph, graphic, growth, icon, idea, illustration, income, increase, invest, isolated, level, loss, market, marketing, metal, modern, money, new, object, part, percent, percentage, pie, plot, politics, profit, progress, ratio, reflection, reflective. The prominent colors used in the PowerPoint template are Blue, Gray, Black.
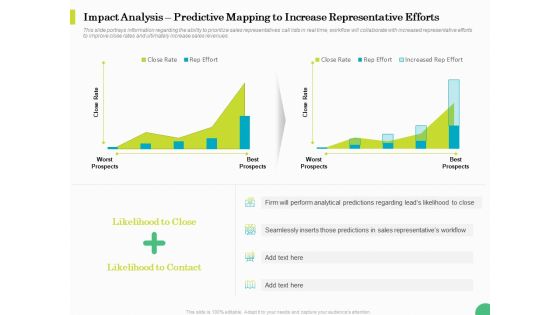
Evaluating Rank Prospects Impact Analysis Predictive Mapping To Increase Representative Efforts Ppt Summary Clipart PDF
This slide portrays information regarding the ability to prioritize sales representatives call lists in real time, workflow will collaborate with increased representative efforts to improve close rates and ultimately increase sales revenues. Deliver and pitch your topic in the best possible manner with this evaluating rank prospects impact analysis predictive mapping to increase representative efforts ppt summary clipart pdf. Use them to share invaluable insights on worst prospects, likelihood to close, likelihood to contact, best prospects and impress your audience. This template can be altered and modified as per your expectations. So, grab it now.
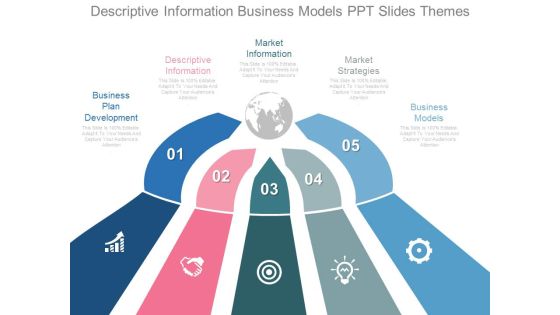
Descriptive Information Business Models Ppt Slides Themes
This is a descriptive information business models ppt slides themes. This is a five stage process. The stages in this process are globe, marketing, geographical.
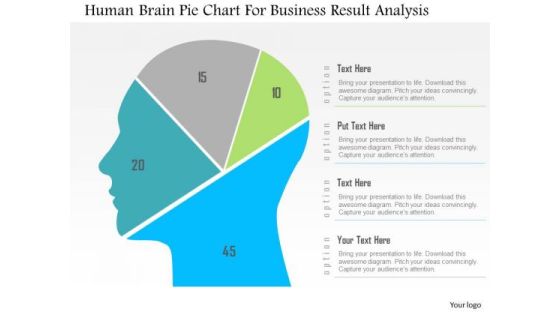
Business Diagram Human Brain Pie Chart For Business Result Analysis PowerPoint Slide
This diagram displays human face graphic divided into sections. This section can be used for data display. Use this diagram to build professional presentations for your viewers.
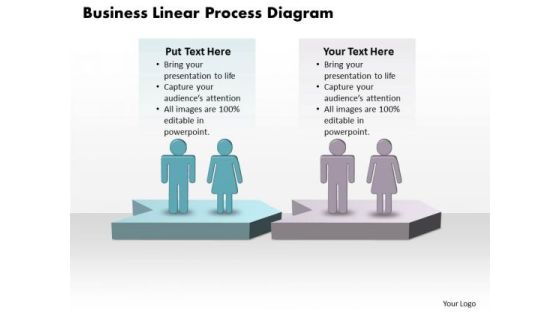
Success Ppt Template World Business PowerPoint Charts Linear Process Diagram 2 Design
We present our success PPT template world business Powerpoint charts linear process diagram 2 design. Use our People PowerPoint Templates because, the structure of our templates allows you to effectively highlight the key issues concerning the growth of your business. Use our Arrows PowerPoint Templates because, the plans are in your head, stage by stage, year by year. Use our Shapes PowerPoint Templates because, you understand the illness and its causes. Use our Communication PowerPoint Templates because, designed to attract the attention of your audience. Use our Business PowerPoint Templates because, you have the process in your head, our template design showing will illuminate your thoughts. Use these PowerPoint slides for presentations relating to abstract, achievement, aim, arrow, business, chart, communication, company, competition, concept, cycle, development, diagram, financial, flow, graph, growth, icon, marketing, sign, price, process, profit, progress, project, shape, sign, success, symbol, target, team. The prominent colors used in the PowerPoint template are Blue, Blue navy, Blue light

Agenda For Sustainable Energy Resources Ppt PowerPoint Presentation Icon Files PDF
This is a Agenda For Sustainable Energy Resources Ppt PowerPoint Presentation Icon Files PDF template with various stages. Focus and dispense information on five stages using this creative set, that comes with editable features. It contains large content boxes to add your information on topics like Introduce Green Energy, Various Sources, Successful Projects. You can also showcase facts, figures, and other relevant content using this PPT layout. Grab it now.

Idea Symbol In Carton Box Shapes PowerPoint Templates And PowerPoint Themes 1012
Idea Symbol In Carton Box Shapes PowerPoint Templates And PowerPoint Themes 1012-The above Template displays a Template of a cartoon Box consisting of a Red Bulb along with Idea Sticker. The Above Template Portrays the Concept of preparation, setting up, development, arrangement, scheduling, forecasting, design, organization, formation, projection, provision etc. The templates are Designed to enhance the essence of your viable ideas.-Idea Symbol In Carton Box Shapes PowerPoint Templates And PowerPoint Themes 1012-This PowerPoint template can be used for presentations relating to-Idea Symbol In A Carton Box, Green Energy, Success, Shapes, Light Bulbs, Metaphor

Dynamic Systems Development Approach Delivery On Time Principle Of DSDM Icons PDF
This slide explains delivery on time as a principle of DSDM which is based on timely delivery of the project, to create a faith in development team. This is a Dynamic Systems Development Approach Delivery On Time Principle Of DSDM Icons PDF template with various stages. Focus and dispense information on four stages using this creative set, that comes with editable features. It contains large content boxes to add your information on topics like Timely Delivery, Focus Priorities, DSDM Teams. You can also showcase facts, figures, and other relevant content using this PPT layout. Grab it now.
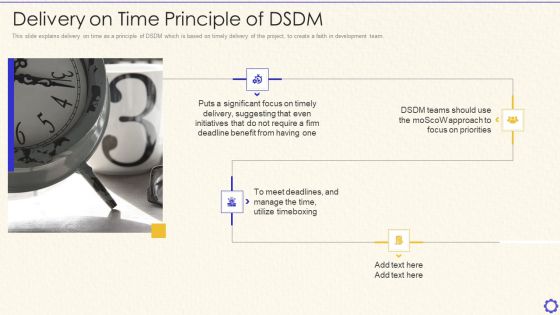
Dynamic System Development Method Tools And Techniques IT Delivery On Time Principle Of DSDM Diagrams PDF
This slide explains delivery on time as a principle of DSDM which is based on timely delivery of the project, to create a faith in development team. Presenting dynamic system development method tools and techniques it delivery on time principle of dsdm diagrams pdf to provide visual cues and insights. Share and navigate important information on four stages that need your due attention. This template can be used to pitch topics like significant, initiatives, benefit, require, suggesting. In addtion, this PPT design contains high resolution images, graphics, etc, that are easily editable and available for immediate download.
 Home
Home