It Project Discovery Phase

Company Budget Assessment Dashboard With Progress Overview Background PDF
The following slide shows business departments budget portfolio with progress summary. It provides information about actuals, marketing accounting, human resource, etc. Showcasing this set of slides titled Company Budget Assessment Dashboard With Progress Overview Background PDF. The topics addressed in these templates are Total Costs, Budget Progress, Key Resources. All the content presented in this PPT design is completely editable. Download it and make adjustments in color, background, font etc. as per your unique business setting.
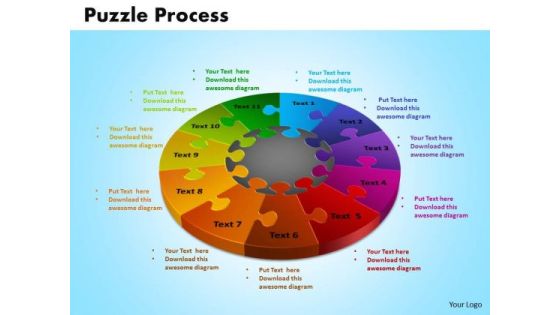
PowerPoint Themes Puzzle Process Success Ppt Template
PowerPoint Themes Puzzle Process Success PPT Template-This PowerPoint Diagram is compelling presentation tool. By piecing together the parts or your project, organization or product in PowerPoint, you help make a critical point to your audience. You can apply other 3D Styles and shapes to the slide to enhance your presentations. -PowerPoint Themes Puzzle Process Success PPT Template

Business Scope Process Sample Diagram Presentation Images
This is a business scope process sample diagram presentation images. This is a six stage process. The stages in this process are develop strategy, select supplier, initiate project, supplier evaluation, supplier development, supplier registration.

Preservation Assessment Diagram Powerpoint Slides Rules
This is a preservation assessment diagram powerpoint slides rules. This is a four stage process. The stages in this process are develop relationship, learn and develop practice, carry out tasks and projects, create new knowledge.

Lead Consultant Roles And Responsibilities Example Ppt Diagrams
This is a lead consultant roles and responsibilities example ppt diagrams. This is a one stage process. The stages in this process are business, idea, strategy, project, cloud, marketing, growth, company, brand, finance, new.

Cascade Framework With Focus Areas Ppt PowerPoint Presentation File Example Topics PDF
Showcasing this set of slides titled cascade framework with focus areas ppt powerpoint presentation file example topics pdf. The topics addressed in these templates are vision, value, focus area, objective, project, kpi. All the content presented in this PPT design is completely editable. Download it and make adjustments in color, background, font etc. as per your unique business setting.

Business Intelligence And Big Key Features Of Predictive Data Analytics Software Microsoft PDF
This slide represents the characteristics of predictive data analytics software. It includes features like predictive modeling, predictive scoring and data mining functions that help companies to get better insights. This is a business intelligence and big key features of predictive data analytics software microsoft pdf template with various stages. Focus and dispense information on five stages using this creative set, that comes with editable features. It contains large content boxes to add your information on topics like analysis network and links, data mining functions, predictive modeling, predictive scoring, automate analytics. You can also showcase facts, figures, and other relevant content using this PPT layout. Grab it now.

Map Diagram With Four Locations Powerpoint Slides
This PowerPoint template displays graphics of map diagram with four locations and percentage values. This Map template can be used in business presentations to depict economic analysis. This slide can also be used by school students for educational projects.
Predictive Analytics Model Performance Tracking Dashboard Forward Looking Analysis IT Introduction PDF
This slide represents the predictive analytics model performance tracking dashboard, and it covers the details of total visitors, total buyers, total products added to the cart, filters by date and category, visitors to clients conversion rate, and so on.The Predictive Analytics Model Performance Tracking Dashboard Forward Looking Analysis IT Introduction PDF is a compilation of the most recent design trends as a series of slides. It is suitable for any subject or industry presentation, containing attractive visuals and photo spots for businesses to clearly express their messages. This template contains a variety of slides for the user to input data, such as structures to contrast two elements, bullet points, and slides for written information. Slidegeeks is prepared to create an impression.

Predictive Analytics In Banking And Finance Industry Forward Looking Analysis IT Diagrams PDF
This slide represents the application of predictive analytics in the finance and banking sector as they deal with vast amounts of data. It helps these industries identify fraudulent transactions, generate credit score, monitor credit risks, and optimize cross-sell or up-sell possibilities.Coming up with a presentation necessitates that the majority of the effort goes into the content and the message you intend to convey. The visuals of a PowerPoint presentation can only be effective if it supplements and supports the story that is being told. Keeping this in mind our experts created Predictive Analytics In Banking And Finance Industry Forward Looking Analysis IT Diagrams PDF to reduce the time that goes into designing the presentation. This way, you can concentrate on the message while our designers take care of providing you with the right template for the situation.
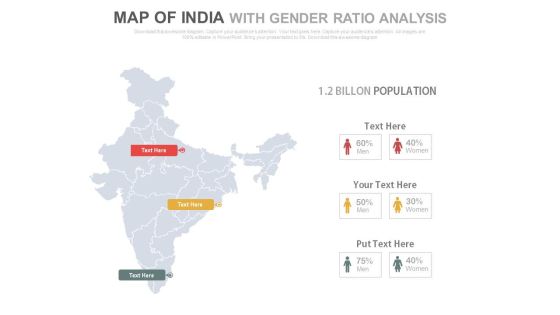
India Map Of With Gender Ratio Analysis Powerpoint Slides
This PowerPoint template displays graphics of India map with male female icons. This Map template can be used in presentations to depict gender ratio analysis. This slide can also be used by school students for educational projects.

Predictive Analytics Methods How Businesses Use Predictive Analytics Background PDF
This slide depicts the importance of predictive analytics that covers detecting fraud, improving operations, optimizing marketing campaigns, and reducing risks. Predictive analytics is being used by businesses to fix complex challenges and identify new possibilities. Do you know about Slidesgeeks Predictive Analytics Methods How Businesses Use Predictive Analytics Background PDF These are perfect for delivering any kind od presentation. Using it, create PowerPoint presentations that communicate your ideas and engage audiences. Save time and effort by using our pre designed presentation templates that are perfect for a wide range of topic. Our vast selection of designs covers a range of styles, from creative to business, and are all highly customizable and easy to edit. Download as a PowerPoint template or use them as Google Slides themes.

Venn Diagram For Business Intelligence And Predictive Analysis Powerpoint Slides
This power point template has been designed with two steps Venn diagram. Use this Venn diagram for business intelligence and predictive analysis. Illustrate your ideas and imprint them in the minds of your team with this template.

Comparative Analysis Of Waterfall Software Development Tools Themes PDF
This slide compares the various tools of waterfall software development based on tool features, limitations and pricing model. It incorporates tools such as Smartsheet, Wrike, Asana, Jira, Microsoft project, Hive and Zoho project. Want to ace your presentation in front of a live audience Our Comparative Analysis Of Waterfall Software Development Tools Themes PDF can help you do that by engaging all the users towards you. Slidegeeks experts have put their efforts and expertise into creating these impeccable powerpoint presentations so that you can communicate your ideas clearly. Moreover, all the templates are customizable, and easy-to-edit and downloadable. Use these for both personal and commercial use.
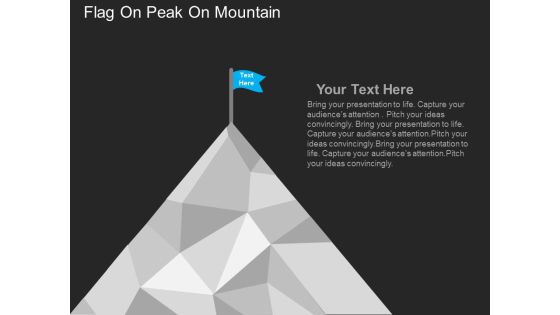
Flag On Peak On Mountain Powerpoint Templates
Our above business diagram has been designed with colorful tags. This slide is suitable to present evaluation of business project. Use this business diagram to present your work in a more smart and precise manner.
Icons Slide For Predictive Analytics Methods Themes PDF
Presenting our innovatively structured Icons Slide For Predictive Analytics Methods Themes PDF set of slides. The slides contain a hundred percent editable icons. You can replace these icons without any inconvenience. Therefore, pick this set of slides and create a striking presentation.

Process Of Advisor Marketing Service Diagram Ppt Example File
This is a process of advisor marketing service diagram ppt example file. This is a five stage process. The stages in this process are success, action, promotion, expertise, project.

B Two B Marketing Methodology Sample Diagram Ppt Model
This is a b two b marketing methodology sample diagram ppt model. This is a six stage process. The stages in this process are special projects, core tools, environment, strategic analysis, organization, core programmers.

Professional Sales Planning Cycle Diagram Ppt Slide Template
This is a professional sales planning cycle diagram ppt slide template. This is a six stage process. The stages in this process are establish purpose, scope the project, strategy development, sales planning, design survey strategy, evaluate the products, operational planning.
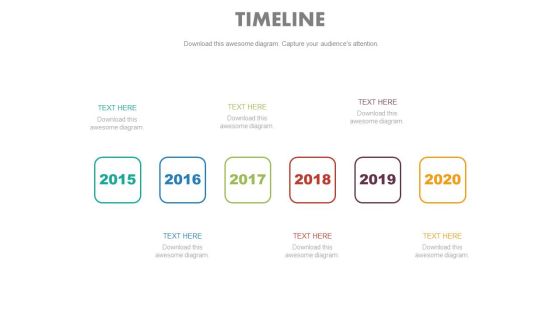
Six Staged Year Based Linear Timeline Powerpoint Slides
You can use this PPT template as a timeline for business development project. This business timeline slide contains graphics of linear timeline diagram. Chart the course you intend to take with this slide.
Consulting Slides 4 Horizontal Steps Of Business Process Business Presentation
You can use this horizontal steps diagram to describe the business process. You can also use this diagram to display milestones in a project. This is an excellent communication tool for analysts to model processes and functional requirements.

Customer Relationship Management Action Plan CRM Application Dashboard Icon Themes PDF
Deliver an awe inspiring pitch with this creative customer relationship management action plan crm application dashboard icon themes pdf bundle. Topics like onboarding projects, accounts at risk, ongoing accounts can be discussed with this completely editable template. It is available for immediate download depending on the needs and requirements of the user.

Budgeting Template Ppt PowerPoint Presentation Icon Examples
This is a budgeting template ppt powerpoint presentation icon examples. This is a four stage process. The stages in this process are public relations, web marketing, advertising, press release development, microsoft as program.
New Product Portfolio Management Ppt PowerPoint Presentation Icon Gridlines
This is a new product portfolio management ppt powerpoint presentation icon gridlines. This is a four stage process. The stages in this process are development, commercialization, project, management, business.

Change Metrics To Analyze Status By Priority Formats PDF
The following slide displays dashboard for real time tracking of major change kpis of the organization. It includes elements such as requests, projects, open, approved, review, in- progress, etc. Pitch your topic with ease and precision using this Change Metrics To Analyze Status By Priority Formats PDF This layout presents information on Project, Request Statistics, Priority. It is also available for immediate download and adjustment. So, changes can be made in the color, design, graphics or any other component to create a unique layout.

Forthcoming Growth Opportunities In Big Data Market Ppt Inspiration Brochure PDF
This slide covers top 3 growth opportunities in big data market . It also contains CAGR, employing innovation, demand, 2021 and 2026 projected. Showcasing this set of slides titled Forthcoming Growth Opportunities In Big Data Market Ppt Inspiration Brochure PDF. The topics addressed in these templates are Big Data International, Market Size, Period Projections. All the content presented in this PPT design is completely editable. Download it and make adjustments in color, background, font etc. as per your unique business setting.
Technology Upgradation Action Plan Dashboard For Issues Tracking Ppt Portfolio Graphics Pictures PDF
This slide shows the issues tracking the dashboard for the business transition project. It provides details of multiple issues faced by users to keep records for effective management of the project. Deliver an awe inspiring pitch with this creative Technology Upgradation Action Plan Dashboard For Issues Tracking Ppt Portfolio Graphics Pictures PDF bundle. Topics like Issues Failed Verification, Immediate Issues, High Churn Issues, Suspect Requirements, Failed Test Runs can be discussed with this completely editable template. It is available for immediate download depending on the needs and requirements of the user.
Information Technology Change Implementation Plan Dashboard For Issues Tracking Clipart PDF
This slide shows the issues tracking the dashboard for the business transition project. It provides details of multiple issues faced by users to keep records for effective management of the project. Deliver an awe inspiring pitch with this creative Information Technology Change Implementation Plan Dashboard For Issues Tracking Clipart PDF bundle. Topics like Issues Failed Verification, Immediate Issues, High Churn Issues, Suspect Requirements, Failed Test Runs can be discussed with this completely editable template. It is available for immediate download depending on the needs and requirements of the user.

Change Execution Plan Dashboard For Issues Tracking Ppt PowerPoint Presentation Gallery Background Images PDF
This slide shows the issues tracking the dashboard for the business transition project. It provides details of multiple issues faced by users to keep records for effective management of the project. Deliver and pitch your topic in the best possible manner with this Change Execution Plan Dashboard For Issues Tracking Ppt PowerPoint Presentation Gallery Background Images PDF. Use them to share invaluable insights on Employee Wise Issues, Overall Issues Status, High Churn Issue and impress your audience. This template can be altered and modified as per your expectations. So, grab it now.

KPI Dashboard To Track Effectiveness Of Real Estate Business Performance Slides PDF
The following slide exhibits key performance indicator KPI dashboard which can be used to measure the financial performance of the real estate company. It covers various kpis such as sales vs target per agent, top 10 projects, top 5 agencies etc. Deliver an awe inspiring pitch with this creative KPI Dashboard To Track Effectiveness Of Real Estate Business Performance Slides PDF bundle. Topics like KPI Dashboard, Track Effectiveness, Real Estate Business Performance can be discussed with this completely editable template. It is available for immediate download depending on the needs and requirements of the user.
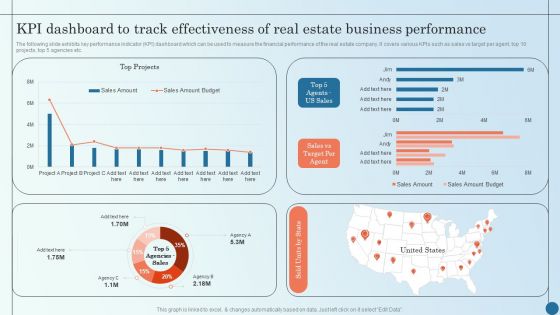
KPI Dashboard To Track Effectiveness Of Real Estate Business Managing Commercial Property Risks Demonstration PDF
The following slide exhibits key performance indicator KPI dashboard which can be used to measure the financial performance of the real estate company. It covers various KPIs such as sales vs target per agent, top 10 projects, top 5 agencies etc.Deliver an awe inspiring pitch with this creative KPI Dashboard To Track Effectiveness Of Real Estate Business Managing Commercial Property Risks Demonstration PDF bundle. Topics like Kpi Dashboard, Track Effectiveness, Estate Business can be discussed with this completely editable template. It is available for immediate download depending on the needs and requirements of the user.

Best Practices For Capacity Capacity Planning Structure PDF
The following slide highlights the best practices to optimize staff capacity planning. It constitutes of elements developing cross functional team, estimating resource capacity, prioritizing projects, opening. Presenting Best Practices For Capacity Capacity Planning Structure PDF to dispense important information. This template comprises four stages. It also presents valuable insights into the topics including Estimate Resource Capacity, Prioritize Projects, Open Communication. This is a completely customizable PowerPoint theme that can be put to use immediately. So, download it and address the topic impactfully.
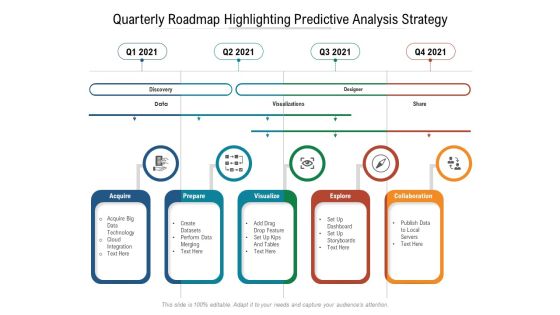
Quarterly Roadmap Highlighting Predictive Analysis Strategy Graphics
Presenting our jaw-dropping quarterly roadmap highlighting predictive analysis strategy graphics. You can alternate the color, font size, font type, and shapes of this PPT layout according to your strategic process. This PPT presentation is compatible with Google Slides and is available in both standard screen and widescreen aspect ratios. You can also download this well-researched PowerPoint template design in different formats like PDF, JPG, and PNG. So utilize this visually-appealing design by clicking the download button given below.
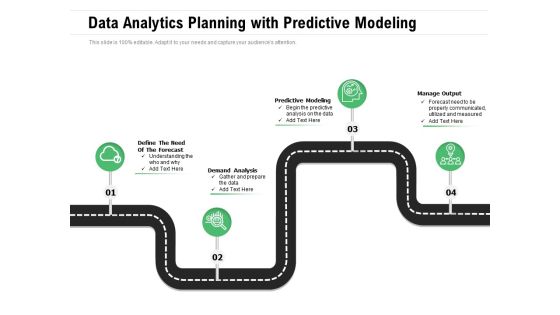
Data Analytics Planning With Predictive Modeling Ppt PowerPoint Presentation File Example Topics PDF
Presenting data analytics planning with predictive modeling ppt powerpoint presentation file example topics pdf to dispense important information. This template comprises four stages. It also presents valuable insights into the topics including analysis, communicated, predictive. This is a completely customizable PowerPoint theme that can be put to use immediately. So, download it and address the topic impactfully.

Expertise Offered By Human Resource Consulting Ppt Styles Diagrams PDF
The following slide highlights the expertise offered by human resource consulting, It depicts turn key projects, legal services, payroll management, talent management, communication, policy development, capability building, organizational change and learning and development. Presenting Expertise Offered By Human Resource Consulting Ppt Styles Diagrams PDF to dispense important information. This template comprises nine stages. It also presents valuable insights into the topics including Turn Key Projects, Learning and Development, Organizational Change, Capability Building. This is a completely customizable PowerPoint theme that can be put to use immediately. So, download it and address the topic impactfully.

Consumer Portfolio Dashboard With Budget Details Ppt PowerPoint Presentation Styles Graphics Tutorials PDF
Presenting this set of slides with name consumer portfolio dashboard with budget details ppt powerpoint presentation styles graphics tutorials pdf. The topics discussed in these slides are portfolio summary, portfolio owner, budget, projects, estimated cost across portfolios. This is a completely editable PowerPoint presentation and is available for immediate download. Download now and impress your audience.

Map Of Africa With Men And Women Gender Ratio Powerpoint Slides
This PowerPoint template displays graphics of Africa map with men women icons. This PPT template can be used to display gender ratio analysis. This slide can also be used by school students for educational projects.
Five Stages Of Business Research Approach Ppt PowerPoint Presentation Summary Tips PDF
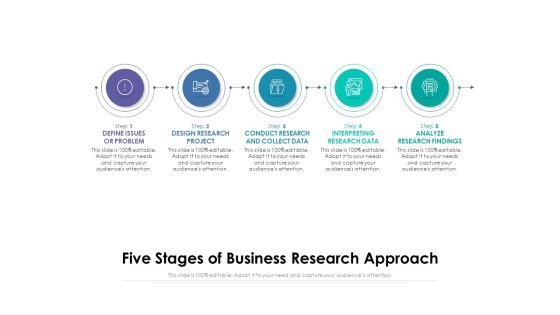
Persuade your audience using this five stages of business research approach ppt powerpoint presentation summary tips pdf. This PPT design covers five stages, thus making it a great tool to use. It also caters to a variety of topics including define issues or problem, design research project, conduct research and collect data, interpreting research data, analyze research findings. Download this PPT design now to present a convincing pitch that not only emphasizes the topic but also showcases your presentation skills.
Predictive Analysis Strategy Half Yearly Roadmap For Business Success Microsoft
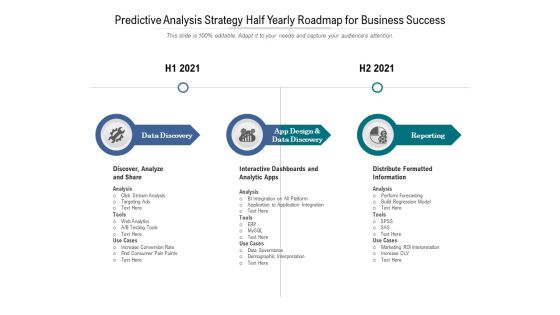
Presenting our innovatively-structured predictive analysis strategy half yearly roadmap for business success microsoft Template. Showcase your roadmap process in different formats like PDF, PNG, and JPG by clicking the download button below. This PPT design is available in both Standard Screen and Widescreen aspect ratios. It can also be easily personalized and presented with modified font size, font type, color, and shapes to measure your progress in a clear way.
Performance Tracking Dashboard For Software Development Life Cycle Structure PDF
This slide represents the software development life cycle dashboard, including summary, tasks, workloads, time spent on projects, new vs. finished, and team cost breakdown. Deliver an awe inspiring pitch with this creative overview of the software development life cycle company demonstration pdf bundle. Topics like performance tracking dashboard for software development life cycle can be discussed with this completely editable template. It is available for immediate download depending on the needs and requirements of the user.
Solution Development Process Performance Tracking Dashboard For SDLC Ideas PDF
This slide represents the software development life cycle dashboard, including summary, tasks, workloads, time spent on projects, new vs. finished, and team cost breakdown.Deliver an awe inspiring pitch with this creative Solution Development Process Performance Tracking Dashboard For SDLC Ideas PDF bundle. Topics like Summary, Workload, Cost Backdown can be discussed with this completely editable template. It is available for immediate download depending on the needs and requirements of the user.
Performance Analysis Of New Product Development Sales Historical And Forecasted Data Rules PDF
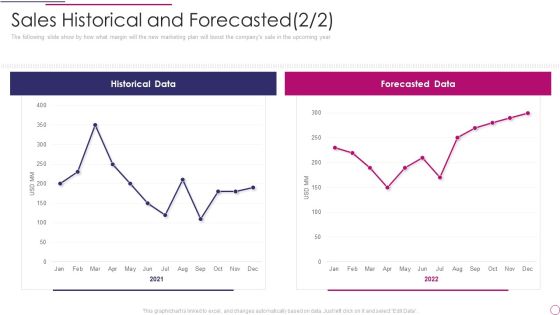
The following slide show by how what margin will the new marketing plan will boost the companys sale in the upcoming year. Deliver and pitch your topic in the best possible manner with this performance analysis of new product development sales historical and forecasted data rules pdf. Use them to share invaluable insights on historical data, forecasted data and impress your audience. This template can be altered and modified as per your expectations. So, grab it now.

Transformation Toolkit Competitive Intelligence Information Analysis Key Training Skills For Data Analytics Program Structure PDF
This slide highlights multiple skills required for conducting the data analytics project. It includes skills such as python, data mining skills, predictive modeling skills and many more. Retrieve professionally designed Transformation Toolkit Competitive Intelligence Information Analysis Key Training Skills For Data Analytics Program Structure PDF to effectively convey your message and captivate your listeners. Save time by selecting pre made slideshows that are appropriate for various topics, from business to educational purposes. These themes come in many different styles, from creative to corporate, and all of them are easily adjustable and can be edited quickly. Access them as PowerPoint templates or as Google Slides themes. You do not have to go on a hunt for the perfect presentation because Slidegeeks got you covered from everywhere.
Business Diagram Multiple Meters On Dashboard For Speed Measurement PowerPoint Slide
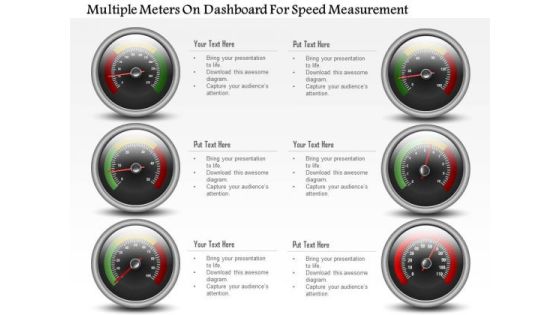
This business diagram has been designed with multiple meters on dashboard. This slide can be used for business planning and progress. Use this diagram for your business and success milestones related presentations.

Product And Application Development With Predictive Analysis Themes PDF
Persuade your audience using this Product And Application Development With Predictive Analysis Themes PDF. This PPT design covers six stages, thus making it a great tool to use. It also caters to a variety of topics including Application Rationalization, Application Support, Performance Reporting. Download this PPT design now to present a convincing pitch that not only emphasizes the topic but also showcases your presentation skills.

Logistics Approach To Improve Supply Chain Performance Table Of Contents Themes PDF
Deliver an awe inspiring pitch with this creative logistics approach to improve supply chain performance table of contents themes pdf bundle. Topics like financial projections, implementation, strategy, logistic industry, organization can be discussed with this completely editable template. It is available for immediate download depending on the needs and requirements of the user.
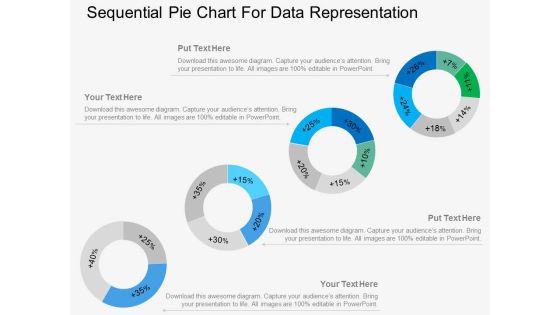
Four Sequential Pie Charts For Data Representation Powerpoint Template
Our above PowerPoint template displays infographic diagram of sequential pie chart. This diagram slide may be used for data representation in visual manner. Above slide provide ideal backdrop to make business presentations.
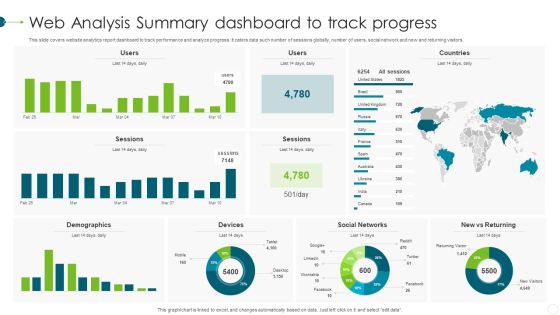
Web Analysis Summary Dashboard To Track Progress Elements PDF
This slide covers website analytics report dashboard to track performance and analyze progress. It caters data such number of sessions globally, number of users, social network and new and returning visitors. Showcasing this set of slides titled Web Analysis Summary Dashboard To Track Progress Elements PDF. The topics addressed in these templates are Demographics, Devices, Social Networks. All the content presented in this PPT design is completely editable. Download it and make adjustments in color, background, font etc. as per your unique business setting.

Data Analysis Strategy Using Ai Information Strategy Methodologies Topics PDF
Presenting data analysis strategy using ai information strategy methodologies topics pdf to dispense important information. This template comprises four stages. It also presents valuable insights into the topics including data processing, prediction, gamma test, spatial analysis. This is a completely customizable PowerPoint theme that can be put to use immediately. So, download it and address the topic impactfully.

Consulting Diagram Business Dashboard Progress Meter Business Diagram
Be The Doer With Our Consulting Diagram Business Dashboard Progress Meter Business Diagram Powerpoint Templates. Put Your Thoughts Into Practice.
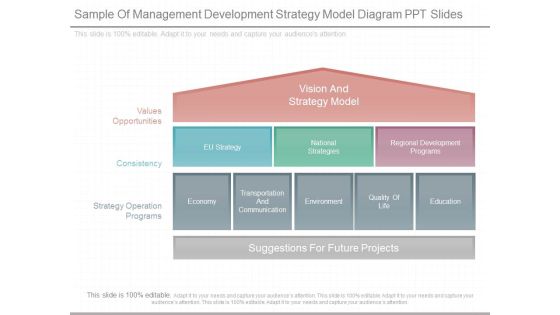
Sample Of Management Development Strategy Model Diagram Ppt Slides
This is a sample of management development strategy model diagram ppt slides. This is a ten stage process. The stages in this process are vision and strategy model, eu strategy, national strategies, regional development programs, economy, transportation and communication, environment, quality of life, education, suggestions for future projects, strategy operation programs, consistency, values opportunities.

Monthly Real Estate Sales Dashboard For Real Estate Business Ppt PowerPoint Presentation File Skills PDF
This slide showcases property sales dashboard to track progress and communicate key development to management. It further includes details such as US sales, target per employee, top selling segments, etc. Showcasing this set of slides titled Monthly Real Estate Sales Dashboard For Real Estate Business Ppt PowerPoint Presentation File Skills PDF. The topics addressed in these templates are Top 5 Sales Segments, Sold Units By State, Top 10 Projects, Sales Vs Target Per Agent. All the content presented in this PPT design is completely editable. Download it and make adjustments in color, background, font etc. as per your unique business setting.

Flowchart For Quantitative Data Analysis Collection And Analysis Professional PDF
This slide presents a flowchart for qualitative and quantitative data collection and analysis to examine certain findings in the process. It includes stages such as qualitative and quantitative data collection, analyzation and interpretation. Presenting Flowchart For Quantitative Data Analysis Collection And Analysis Professional PDF to dispense important information. This template comprises one stages. It also presents valuable insights into the topics including Interpretation Results, Analyze Qualitative Data, Collect Qualitative Data. This is a completely customizable PowerPoint theme that can be put to use immediately. So, download it and address the topic impactfully.
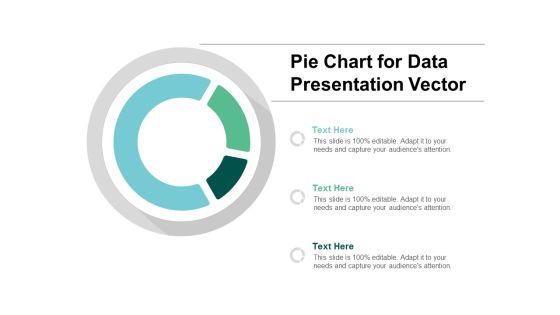
Pie Chart For Data Presentation Vector Ppt PowerPoint Presentation Summary Files
Presenting this set of slides with name pie chart for data presentation vector ppt powerpoint presentation summary files. The topics discussed in these slides are data visualization icon, research analysis, business focus. This is a completely editable PowerPoint presentation and is available for immediate download. Download now and impress your audience.

Business Diagram Sample Advantages Benefits Of Big Data Analysis And Modelling Ppt Slide
Explain the concept of sample advantages and benefits of big data analysis with this unique diagram. This slide contains the graphic of data icons. Use this slide to present data analysis and modeling related topics in any presentation.

Executing Risk Mitigation KPI Dashboard To Track Effectiveness Of Real Estate Rules PDF
The following slide exhibits key performance indicator KPI dashboard which can be used to measure the financial performance of the real estate company. It covers various KPIs such as sales vs target per agent, top 10 projects, top 5 agencies etc. Find highly impressive Executing Risk Mitigation KPI Dashboard To Track Effectiveness Of Real Estate Rules PDF on Slidegeeks to deliver a meaningful presentation. You can save an ample amount of time using these presentation templates. No need to worry to prepare everything from scratch because Slidegeeks experts have already done a huge research and work for you. You need to download Executing Risk Mitigation Kpi Dashboard To Track Effectiveness Of Real Estate Rules PDF for your upcoming presentation. All the presentation templates are 100 percent editable and you can change the color and personalize the content accordingly. Download now.
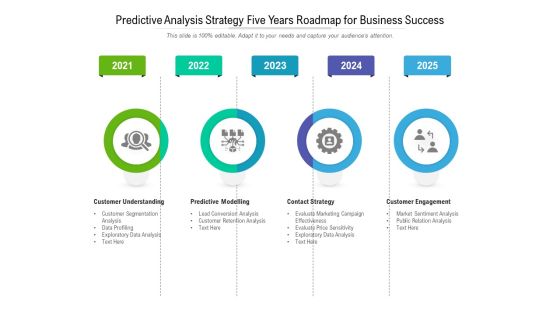
Predictive Analysis Strategy Five Years Roadmap For Business Success Rules
Presenting our jaw-dropping predictive analysis strategy five years roadmap for business success rules. You can alternate the color, font size, font type, and shapes of this PPT layout according to your strategic process. This PPT presentation is compatible with Google Slides and is available in both standard screen and widescreen aspect ratios. You can also download this well-researched PowerPoint template design in different formats like PDF, JPG, and PNG. So utilize this visually-appealing design by clicking the download button given below.
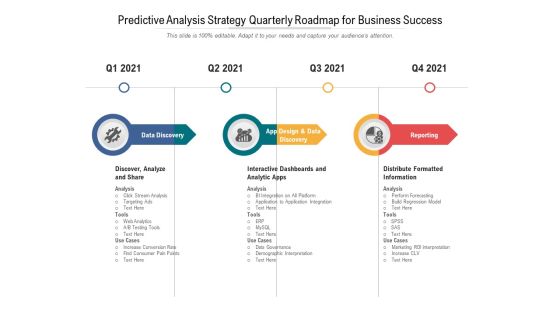
Predictive Analysis Strategy Quarterly Roadmap For Business Success Inspiration
Presenting our jaw-dropping predictive analysis strategy quarterly roadmap for business success inspiration. You can alternate the color, font size, font type, and shapes of this PPT layout according to your strategic process. This PPT presentation is compatible with Google Slides and is available in both standard screen and widescreen aspect ratios. You can also download this well-researched PowerPoint template design in different formats like PDF, JPG, and PNG. So utilize this visually-appealing design by clicking the download button given below.

Predictive Analysis Strategy Six Months Roadmap For Business Success Rules
Introducing our predictive analysis strategy six months roadmap for business success rules. This PPT presentation is Google Slides compatible, therefore, you can share it easily with the collaborators for measuring the progress. Also, the presentation is available in both standard screen and widescreen aspect ratios. So edit the template design by modifying the font size, font type, color, and shapes as per your requirements. As this PPT design is fully editable it can be presented in PDF, JPG and PNG formats.
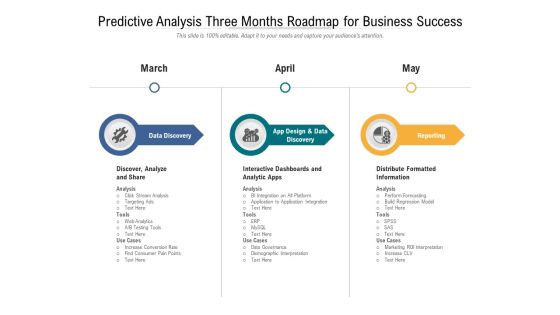
Predictive Analysis Three Months Roadmap For Business Success Infographics
Introducing our predictive analysis three months roadmap for business success infographics. This PPT presentation is Google Slides compatible, therefore, you can share it easily with the collaborators for measuring the progress. Also, the presentation is available in both standard screen and widescreen aspect ratios. So edit the template design by modifying the font size, font type, color, and shapes as per your requirements. As this PPT design is fully editable it can be presented in PDF, JPG and PNG formats.
Financial Analysis Calculator With Dollar Symbol Vector Icon Ppt PowerPoint Presentation File Example Topics PDF
Presenting this set of slides with name financial analysis calculator with dollar symbol vector icon ppt powerpoint presentation file example topics pdf. This is a three stage process. The stages in this process are financial analysis calculator with dollar symbol vector icon. This is a completely editable PowerPoint presentation and is available for immediate download. Download now and impress your audience.

Budget Analysis Dashboard With Actual And Forecasted Revenue Comparison Structure PDF
This slide displays the budget analysis report comparing the budget with the actual year to date data. It also helps in making estimations for the remaining year. It includes variance between budgeted and actual gross margin results, service revenue, profit margin, product revenue, payroll cost, etc. Pitch your topic with ease and precision using this Budget Analysis Dashboard With Actual And Forecasted Revenue Comparison Structure PDF. This layout presents information on Payroll Cost, Budget Revenue Components, Product Revenue. It is also available for immediate download and adjustment. So, changes can be made in the color, design, graphics or any other component to create a unique layout.
Skill Analysis Chart With Mission Vision And Core Values Ppt PowerPoint Presentation Layouts Icons PDF
Presenting this set of slides with name skill analysis chart with mission vision and core values ppt powerpoint presentation layouts icons pdf. The topics discussed in these slides are mission, vision, core values, business, goals and objectives, capital purchase plan, annual cash flow projections. This is a completely editable PowerPoint presentation and is available for immediate download. Download now and impress your audience.

Data Interpretation Percentage Analysis Ppt Powerpoint Presentation Summary Icon
This is a data interpretation percentage analysis ppt powerpoint presentation summary icon. This is a six stage process. The stages in this process are data presentation, content presentation, information presentation.

Strategic Partnership Management Plan Business Partners Dashboard Mockup PDF
This slide covers the business partners dashboard which covers active projects, issues found, root cause analysis, impact analysis and top vulnerabilities. Deliver an awe inspiring pitch with this creative strategic partnership management plan business partners dashboard mockup pdf bundle. Topics like issues found vs patched, impact analysis, root cause analysis, top vulnerabilities can be discussed with this completely editable template. It is available for immediate download depending on the needs and requirements of the user.

Real Estate Development Budget Variance Analysis Operational Ppt PowerPoint Presentation Styles Introduction PDF
Presenting this set of slides with name real estate development budget variance analysis operational ppt powerpoint presentation styles introduction pdf. The topics discussed in these slides are total revenue, total operating expenses, real estate taxes, net operating income, projected. This is a completely editable PowerPoint presentation and is available for immediate download. Download now and impress your audience.

Bifurcation In Internal External Stakeholders Themes PDF
This slide covers the bifurcation of internal and external stakeholders after identification of the potential stakeholders such as social organizations, or anyone interested to have stake in the project. This is a bifurcation in internal external stakeholders themes pdf template with various stages. Focus and dispense information on three stages using this creative set, that comes with editable features. It contains large content boxes to add your information on topics like external stakeholders, internal shareholders, project. You can also showcase facts, figures, and other relevant content using this PPT layout. Grab it now.

Data Quality Auditing And Threats Reporting Process Ppt Icon Picture PDF
This slide covers auditing process of data quality and reporting risk detected. It includes framework depicting checkpoints needed to audit data quality for data warehouse and business intelligence projects. Presenting Data Quality Auditing And Threats Reporting Process Ppt Icon Picture PDF to dispense important information. This template comprises one stages. It also presents valuable insights into the topics including External Data, Customer Data, Legacy Data. This is a completely customizable PowerPoint theme that can be put to use immediately. So, download it and address the topic impactfully.
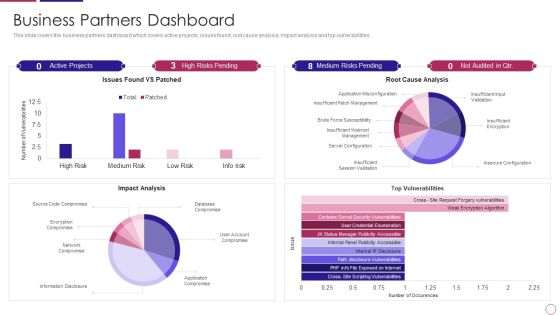
PRM To Streamline Business Processes Business Partners Dashboard Introduction PDF
This slide covers the business partners dashboard which covers active projects, issues found, root cause analysis, impact analysis and top vulnerabilities. Deliver and pitch your topic in the best possible manner with this prm to streamline business processes business partners dashboard introduction pdf. Use them to share invaluable insights on impact analysis, top vulnerabilities, server configuration, network compromise, issues found vs patched and impress your audience. This template can be altered and modified as per your expectations. So, grab it now.

Business Partners Dashboard Ppt Professional File Formats PDF
This slide covers the business partners dashboard which covers active projects, issues found, root cause analysis, impact analysis and top vulnerabilities. Deliver an awe inspiring pitch with this creative business partners dashboard ppt professional file formats pdf bundle. Topics like business partners dashboard can be discussed with this completely editable template. It is available for immediate download depending on the needs and requirements of the user.

Agile Development Approach IT Team Management Dashboard In Agile Sample PDF
This slide represents the team management dashboard in agile by covering the details of total resources, overall task completion rate, features closed, and bugs closed. Deliver an awe inspiring pitch with this creative Agile Development Approach IT Team Management Dashboard In Agile Sample PDF bundle. Topics like Total Resources, Project, Features Closed, Bugs Closed, Team Roles can be discussed with this completely editable template. It is available for immediate download depending on the needs and requirements of the user.

Predictive Analytics Models For Predictive Problems Forward Looking Analysis IT Clipart PDF
This slide depicts the overview of predictive analytics models, including the predictive problems they solve, such as binary results, number prediction, detecting odd behavior, and so on. The models include classification, forecasting, anomaly, cluster, and time series. Are you searching for a Predictive Analytics Models For Predictive Problems Forward Looking Analysis IT Clipart PDF that is uncluttered, straightforward, and original Its easy to edit, and you can change the colors to suit your personal or business branding. For a presentation that expresses how much effort you ve put in, this template is ideal With all of its features, including tables, diagrams, statistics, and lists, its perfect for a business plan presentation. Make your ideas more appealing with these professional slides. Download Predictive Analytics Models For Predictive Problems Forward Looking Analysis IT Clipart PDF from Slidegeeks today.

Essential Key Performance Indicators In Investment Summary Demonstration PDF
The following slide showcases dashboard of portfolio summary with important key performance indicators to provide an oversight of the project. Key metrics covered are cost, work, variance, active risk and issues. Showcasing this set of slides titled Essential Key Performance Indicators In Investment Summary Demonstration PDF. The topics addressed in these templates are Cost, Active Risks, Projects. All the content presented in this PPT design is completely editable. Download it and make adjustments in color, background, font etc. as per your unique business setting.

Strategic Management Progress Meter Dashboard Design Marketing Diagram
Be A Donor Of Great Ideas. Display Your Charity On Our Strategic Management Progress Meter Dashboard Design Marketing Diagram Powerpoint Templates.

Strategy Diagram Meter Design For Business Progress Sales Diagram
Our Strategy Diagram Meter Design For Business Progress Sales Diagram Powerpoint Templates Abhor Doodling. They Never Let The Interest Flag.

Calculating Customer Lifetime Value Clv Ppt PowerPoint Presentation Show Icon
This is a calculating customer lifetime value clv ppt powerpoint presentation show icon. This is a five stage process. The stages in this process are average acquisition cost, average customer revenue, average customer costs, average customer profit, customer retention rate.
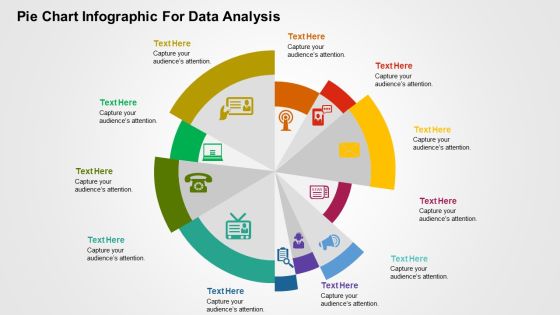
Pie Chart Infographic For Data Analysis PowerPoint Templates
This is one of the most downloaded PowerPoint template. This slide can be used for various purposes and to explain a number of processes. This can be included in your presentation to explain each step of a process and even include its relevance and importance in a single diagram. Using the uneven circular structure of the pie chart, the presenter can also explain random steps or highlight particular steps of process or parts of an organization or business that need special attention of any kind to the audience. Additionally, you can use this slide to show a transformation process or highlight key features of a product.

Key Steps Of Technology Innovation Process Ppt PowerPoint Presentation Ideas Mockup PDF
Presenting key steps of technology innovation process ppt powerpoint presentation ideas mockup pdf to dispense important information. This template comprises six stages. It also presents valuable insights into the topics including major technologies to consider for transformation, basic business details, information requirement, use of the collected information, ensure governance and compliance, initiate with small project. This is a completely customizable PowerPoint theme that can be put to use immediately. So, download it and address the topic impactfully.
Team Achievement Dashboard For Tracking Tasks Completion Graphics PDF
This slide illustrates team success dashboard for tracking tasks completion. This provides information about rate, section, incomplete, assignee, upcoming tasks, etc. Showcasing this set of slides titled team achievement dashboard for tracking tasks completion graphics pdf. The topics addressed in these templates are completion rate, spent time on project, task completion. All the content presented in this PPT design is completely editable. Download it and make adjustments in color, background, font etc. as per your unique business setting.

30 60 90 Days Sales And Promotion Planning Valuation Icon Summary PDF
The given below slide showcases the required actions to improve companys sales and achieve the set targets. It also includes KPIs such as product, projection, and quality standards etc. Showcasing this set of slides titled 30 60 90 Days Sales And Promotion Planning Valuation Icon Summary PDF. The topics addressed in these templates are Quality Standards, Products, Projection. All the content presented in this PPT design is completely editable. Download it and make adjustments in color, background, font etc. as per your unique business setting.

Arrow Infographics For Financial Data Analysis Powerpoint Template
This PowerPoint slide contains diagram of arrows infographic. This professional slide helps to exhibit financial data analysis for business growth. Use this PowerPoint template to make impressive presentations.

Internet Browser And Rss Symbol Business PowerPoint Templates And PowerPoint Themes 1112
We present our Internet Browser And RSS Symbol Business PowerPoint Templates And PowerPoint Themes 1112.Use our Technology PowerPoint Templates because, Discuss each one and slowly but surely move up the pyramid narrowing down to the best and most success oriented project. Use our Communication PowerPoint Templates because, Explain your strategy to co-ordinate activities of these seperate groups. Use our Signs PowerPoint Templates because,Master them all and you have it made. Use our Business PowerPoint Templates because, Inform your team of your ideas using our illustrative slides. Use our Stars PowerPoint Templates because, Stable ideas are the building blocks of a sucessful structure.Use these PowerPoint slides for presentations relating to Internet browser and rss symbol, technology, communication, signs, business, stars. The prominent colors used in the PowerPoint template are Yellow, White, Black

Predictive Analysis Strategy Half Yearly Roadmap With Multiple Activities Diagrams
Presenting the predictive analysis strategy half yearly roadmap with multiple activities diagrams. The template includes a roadmap that can be used to initiate a strategic plan. Not only this, the PowerPoint slideshow is completely editable and you can effortlessly modify the font size, font type, and shapes according to your needs. This PPT slide can be easily reached in standard screen and widescreen aspect ratios. The set is also available in various formats like PDF, PNG, and JPG. So download and use it multiple times as per your knowledge.

Business Partners Dashboard Effective Partnership Administration With Clients Channel And Corporate Partners Guidelines PDF
This slide covers the business partners dashboard which covers active projects, issues found, root cause analysis, impact analysis and top vulnerabilities. Deliver an awe inspiring pitch with this creative business partners dashboard effective partnership administration with clients channel and corporate partners guidelines pdf bundle. Topics like impact analysis, vulnerabilities, root cause analysis can be discussed with this completely editable template. It is available for immediate download depending on the needs and requirements of the user.

Using Ml And Devops In Product Development Process Average Cost And Schedule Overrun Mockup PDF
This slide shows informational stats on the average cost and schedule overrun faced by the organization while completing its software projects. Here the slide shows that on an average organization bears 55 percent cost overrun in the year 2022. Deliver an awe inspiring pitch with this creative Using Ml And Devops In Product Development Process Average Cost And Schedule Overrun Mockup PDF bundle. Topics like Average Cost, Previously Completed Projects, Schedule Overrun can be discussed with this completely editable template. It is available for immediate download depending on the needs and requirements of the user.

Business Framework Predictive Analytics PowerPoint Presentation
Explain the concept of predictive analytics in any presentation with this unique PPT slide. This PPT diagram slide contains the graphic of arrow diagram with three text boxes on a graph. This PPT slide shows the growth analysis an make a professional presentation.

Big Data Funnel Diagram Powerpoint Templates
Our above business slide has been designed with graphics of big data funnel diagram. This slide is suitable to present data analysis, storage and sharing. Use this business diagram to present your work in a more smart and precise manner.
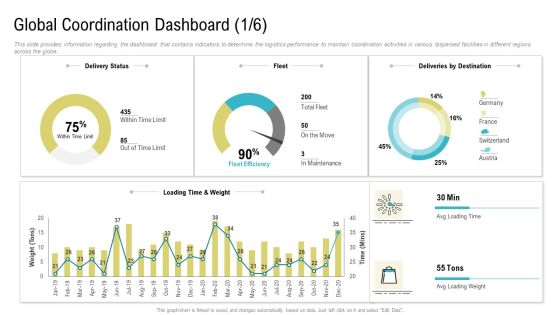
Global Coordination Dashboard Ppt Styles Graphics Download PDF
This slide provides information regarding the dashboard that contains indicators to determine the coordination activities in various dispersed facilities in different regions across the globe. Deliver and pitch your topic in the best possible manner with this global coordination dashboard ppt styles graphics download pdf. Use them to share invaluable insights on project, global coordination dashboard and impress your audience. This template can be altered and modified as per your expectations. So, grab it now.

Data Mining Implementation Dashboard For Data Mining Implementation Pictures PDF
This slide depicts the dashboard for data integration in the business, and it is showing real-time details about expenses, profits, margins percentage, and new addition projects.Deliver and pitch your topic in the best possible manner with this data mining implementation dashboard for data mining implementation pictures pdf Use them to share invaluable insights on dashboard for data mining implementation and impress your audience. This template can be altered and modified as per your expectations. So, grab it now.
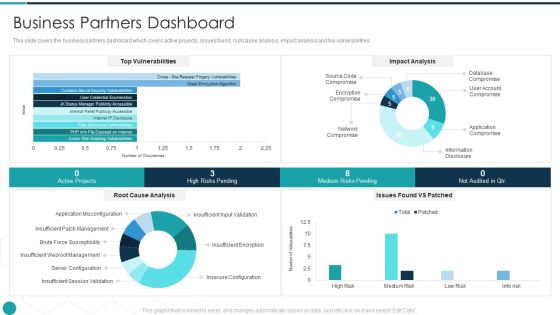
Upgrade Management Of Complex Business Associates Business Partners Dashboard Brochure PDF
This slide covers the business partners dashboard which covers active projects, issues found, root cause analysis, impact analysis and top vulnerabilities. Deliver and pitch your topic in the best possible manner with this upgrade management of complex business associates business partners dashboard brochure pdf. Use them to share invaluable insights on business partners dashboard and impress your audience. This template can be altered and modified as per your expectations. So, grab it now.
Predictive Analysis Strategy Six Months Roadmap With Multiple Activities Icons
Presenting our jaw-dropping predictive analysis strategy six months roadmap with multiple activities icons. You can alternate the color, font size, font type, and shapes of this PPT layout according to your strategic process. This PPT presentation is compatible with Google Slides and is available in both standard screen and widescreen aspect ratios. You can also download this well-researched PowerPoint template design in different formats like PDF, JPG, and PNG. So utilize this visually-appealing design by clicking the download button given below.

Dashboard For Data Analytics Implementation Ppt Model Files PDF
This slide depicts the dashboard for data integration in the business, and it is showing real time details about expenses, profits, margins percentage, and new addition projects. Deliver and pitch your topic in the best possible manner with this dashboard for data analytics implementation ppt model files pdf. Use them to share invaluable insights on expenses, profits, analytics, data and impress your audience. This template can be altered and modified as per your expectations. So, grab it now.

Architecture Transformation Playbook Essential Construction Activities Management Dashboard Topics PDF
This slide provides information regarding essential construction activities management dashboard with details about site inspection, rework costs, safety meetings, etc. Deliver an awe inspiring pitch with this creative Architecture Transformation Playbook Essential Construction Activities Management Dashboard Topics PDF bundle. Topics like Project, Customer Complaints, Customer Satisfaction Ratio can be discussed with this completely editable template. It is available for immediate download depending on the needs and requirements of the user.
Forecast Analysis Technique IT Predictive Modeling Model Performance Tracking Dashboard Brochure PDF
This slide represents the predictive analytics model performance tracking dashboard, and it covers the details of total visitors, total buyers, total products added to the cart, filters by date and category, visitors to clients conversion rate, and so on. There are so many reasons you need a Forecast Analysis Technique IT Predictive Modeling Model Performance Tracking Dashboard Brochure PDF. The first reason is you can not spend time making everything from scratch, Thus, Slidegeeks has made presentation templates for you too. You can easily download these templates from our website easily.
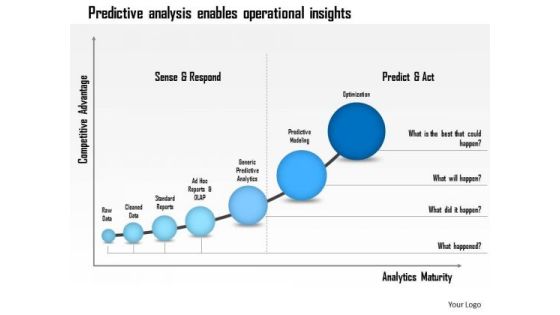
Business Framework Predictive Analysis Enables Operational Insights PowerPoint Presentation
This Power Point template diagram slide has been designed with graphic of growth arrows with text boxes. This text box arrow contains the concept of predictive analysis for operational insights. Use this PPT slide for business operation related presentations.

Table Of Contents For Pmp Training Program It Themes PDF
Deliver an awe inspiring pitch with this creative table of contents for pmp training program it themes pdf bundle. Topics like management, project, professional can be discussed with this completely editable template. It is available for immediate download depending on the needs and requirements of the user.
Predictive Analysis With Growth Business Trend Icon Portrait PDF
Presenting Predictive Analysis With Growth Business Trend Icon Portrait PDF to dispense important information. This template comprises Four stages. It also presents valuable insights into the topics including Predictive Analysis, Growth Business, Trend Icon This is a completely customizable PowerPoint theme that can be put to use immediately. So, download it and address the topic impactfully.
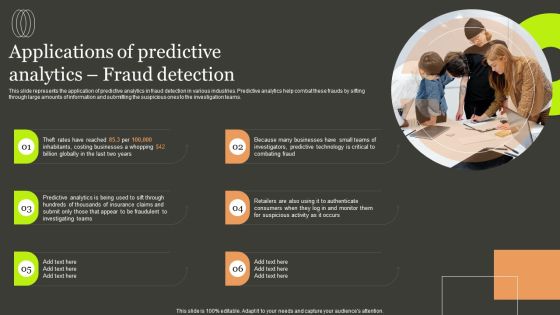
Predictive Analytics Methods Applications Of Predictive Analytics Fraud Detection Designs PDF
This slide represents the application of predictive analytics in fraud detection in various industries. Predictive analytics help combat these frauds by sifting through large amounts of information and submitting the suspicious ones to the investigation teams. If you are looking for a format to display your unique thoughts, then the professionally designed Predictive Analytics Methods Applications Of Predictive Analytics Fraud Detection Designs PDF is the one for you. You can use it as a Google Slides template or a PowerPoint template. Incorporate impressive visuals, symbols, images, and other charts. Modify or reorganize the text boxes as you desire. Experiment with shade schemes and font pairings. Alter, share or cooperate with other people on your work. Download Predictive Analytics Methods Applications Of Predictive Analytics Fraud Detection Designs PDF and find out how to give a successful presentation. Present a perfect display to your team and make your presentation unforgettable.

Production Procedures To Enhance Quality And Productivity Improvement With Operation Management Strategies Rules PDF
The slide presents some strategies that can be adopted by operation managers to improve production quality and productivity. it includes designing and data importance in process, inventory analysis, future projections, collaborating, being environment friendly and full documentation. Persuade your audience using this Production Procedures To Enhance Quality And Productivity Improvement With Operation Management Strategies Rules PDF. This PPT design covers five stages, thus making it a great tool to use. It also caters to a variety of topics including Designing And Importance, Data Process Building, Collaborating, Being Environment Friendly. Download this PPT design now to present a convincing pitch that not only emphasizes the topic but also showcases your presentation skills.
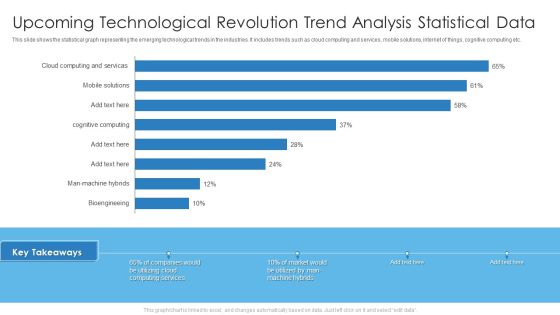
Upcoming Technological Revolution Trend Analysis Statistical Data Professional PDF
This slide shows the statistical graph representing the emerging technological trends in the industries. It includes trends such as cloud computing and services, mobile solutions, internet of things, cognitive computing etc. Deliver an awe inspiring pitch with this creative Upcoming Technological Revolution Trend Analysis Statistical Data Professional PDF bundle. Topics like Upcoming Technological Revolution, Trend Analysis Statistical Data can be discussed with this completely editable template. It is available for immediate download depending on the needs and requirements of the user.

Advanced Service Data Analysis Icons Slide Infographics PDF
Download our innovative and attention grabbing advanced service data analysis icons slide infographics pdf template. The set of slides exhibit completely customizable icons. These icons can be incorporated into any business presentation. So download it immediately to clearly communicate with your clientele.

Force Field Analysis Template 2 Ppt PowerPoint Presentation Themes
This is a force field analysis template 2 ppt powerpoint presentation themes. This is a two stage process. The stages in this process are restraining forces, driving forces, estimated strength, equilibrium.
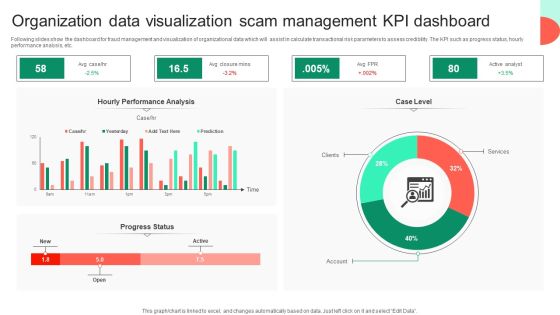
Organization Data Visualization Scam Management KPI Dashboard Rules PDF
Following slides show the dashboard for fraud management and visualization of organizational data which will assist in calculate transactional risk parameters to assess credibility. The KPI such as progress status, hourly performance analysis, etc. Showcasing this set of slides titled Organization Data Visualization Scam Management KPI Dashboard Rules PDF. The topics addressed in these templates are Hourly Performance Analysis, Services, Organization Data Visualization. All the content presented in this PPT design is completely editable. Download it and make adjustments in color, background, font etc. as per your unique business setting.
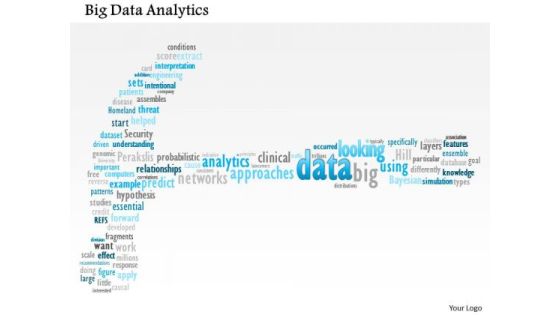
Business Framework Big Data Analytics PowerPoint Presentation
This unique power point diagram slide has been crafted with big data analytics. This data analytics is used to improve predictions and support decision making. Use this image slide for big data analysis related presentations.

Predictive Data Model Predictive Analytics Forecast Model Introduction Themes PDF
This slide outlines the introduction of the forecast model used for predictive analytics to make the metric value predictions for business processes. This model uses the Prophet algorithm to make predictions and includes its use cases in the manufacturing industry. The best PPT templates are a great way to save time, energy, and resources. Slidegeeks have 100 percent editable powerpoint slides making them incredibly versatile. With these quality presentation templates, you can create a captivating and memorable presentation by combining visually appealing slides and effectively communicating your message. Download Predictive Data Model Predictive Analytics Forecast Model Introduction Themes PDF from Slidegeeks and deliver a wonderful presentation.
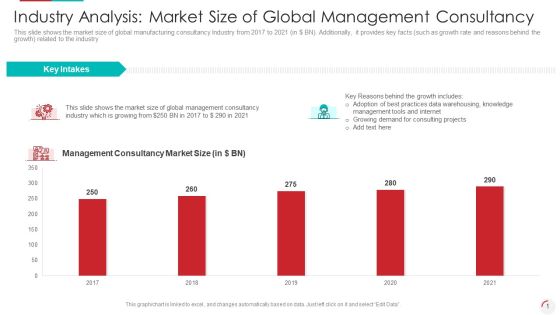
Industry Analysis Market Size Of Global Management Consultancy Graphics PDF
Deliver an awe-inspiring pitch with this creative industry analysis market size of global management consultancy graphics pdf. bundle. Topics like management consultancy market size, growing demand for consulting projects, key intakes can be discussed with this completely editable template. It is available for immediate download depending on the needs and requirements of the user.

Departmental Tracking Goals Progress Dashboard Diagrams PDF
This slide depicts a progress chart for maintaining transparency and alignment in tracking cross-functional goals. It also includes organizational objective details such as total on track objectives, recently updated, overall progress, etc. Showcasing this set of slides titled Departmental Tracking Goals Progress Dashboard Diagrams PDF. The topics addressed in these templates are Departmental Tracking Goals, Progress Dashboard . All the content presented in this PPT design is completely editable. Download it and make adjustments in color, background, font etc. as per your unique business setting.

Big Data Analytics Benefits For Social Platforms Data Analysis Marketing Mockup PDF
This slide covers the advantages of analyzing big data for social media marketing. It includes four benefits of big data analytics such as real-time interaction, target clients, future predictions and omnichannel sources. Presenting Big Data Analytics Benefits For Social Platforms Data Analysis Marketing Mockup PDF to dispense important information. This template comprises four stages. It also presents valuable insights into the topics including Target Clients, Future Predictions, Omnichannel Sources. This is a completely customizable PowerPoint theme that can be put to use immediately. So, download it and address the topic impactfully.

Functional Analysis Of Business Operations Discounted Payback Period Valuation Summary Themes PDF
Presenting this set of slides with name functional analysis of business operations discounted payback period valuation summary themes pdf. The topics discussed in these slides are cost, project, cash inflows, factors, year. This is a completely editable PowerPoint presentation and is available for immediate download. Download now and impress your audience.

Information Science Domains Where Data Science Is Creating Its Impression Ppt PowerPoint Presentation Icon Backgrounds PDF
This slide represents the data science impression in various domains such as marketing, upselling, social media, automation, travel, sales, credit and insurance, and healthcare.Deliver and pitch your topic in the best possible manner with this Information Science Domains Where Data Science Is Creating Its Impression Ppt PowerPoint Presentation Icon Backgrounds PDF. Use them to share invaluable insights on Disease Prediction, Medication Effectiveness, Demand Forecasting and impress your audience. This template can be altered and modified as per your expectations. So, grab it now.
Strategic Plan Development Ppt PowerPoint Presentation Slides Icons
Presenting this set of slides with name strategic plan development ppt powerpoint presentation slides icons. The topics discussed in these slides are industry dynamics and implications, competitive assessment, internal assessment, strategy articulation strategic initiatives, financial projection. This is a completely editable PowerPoint presentation and is available for immediate download. Download now and impress your audience.

Infographic For Data Analysis Powerpoint Templates
This PowerPoint slide has been designed with process infographic. This PPT diagram may be used to display evaluation of business process. This diagram slide can be used to make impressive presentations.

Freehold Property Business Plan Budget Variance Analysis Operational Ppt PowerPoint Presentation Professional Show PDF
Presenting this set of slides with name freehold property business plan budget variance analysis operational ppt powerpoint presentation professional show pdf. The topics discussed in these slides are total revenue, total operating expenses, real estate taxes, net operating income, projected. This is a completely editable PowerPoint presentation and is available for immediate download. Download now and impress your audience.
Partner Engagement Planning Procedure Bifurcation In Internal External Stakeholders Icons PDF
This slide covers the bifurcation of internal and external stakeholders after identification of the potential stakeholders such as social organizations, or anyone interested to have stake in the project. This is a partner engagement planning procedure bifurcation in internal external stakeholders icons pdf template with various stages. Focus and dispense information on three stages using this creative set, that comes with editable features. It contains large content boxes to add your information on topics like external stakeholders, internal shareholders, project. You can also showcase facts, figures, and other relevant content using this PPT layout. Grab it now.

Building Quality Inspection Dashboard With Customer Satisfaction Ratio Icons PDF
The following slide showcases dashboard of construction company exhibiting quality KPIs regarding safety, workmanship and customer satisfaction. Key indicators covered are site inspection success level, CSR, defect count, net promoter score, promotors, passives, defectors, total rework cost, safety meetings and average time taken to fix defects. Showcasing this set of slides titled Building Quality Inspection Dashboard With Customer Satisfaction Ratio Icons PDF. The topics addressed in these templates are Construction Project, Customer Satisfaction Ratio, Promoters. All the content presented in this PPT design is completely editable. Download it and make adjustments in color, background, font etc. as per your unique business setting.

Five Years Roadmap With Predictive Analysis Transformation Strategy Formats
Presenting our innovatively-structured five years roadmap with predictive analysis transformation strategy formats Template. Showcase your roadmap process in different formats like PDF, PNG, and JPG by clicking the download button below. This PPT design is available in both Standard Screen and Widescreen aspect ratios. It can also be easily personalized and presented with modified font size, font type, color, and shapes to measure your progress in a clear way.
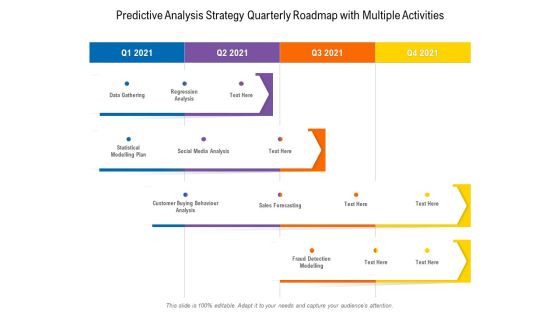
Predictive Analysis Strategy Quarterly Roadmap With Multiple Activities Clipart
Presenting our innovatively-structured predictive analysis strategy quarterly roadmap with multiple activities clipart Template. Showcase your roadmap process in different formats like PDF, PNG, and JPG by clicking the download button below. This PPT design is available in both Standard Screen and Widescreen aspect ratios. It can also be easily personalized and presented with modified font size, font type, color, and shapes to measure your progress in a clear way.

Predictive Analysis Strategy Three Months Roadmap With Multiple Activities Template
Presenting our innovatively-structured predictive analysis strategy three months roadmap with multiple activities template Template. Showcase your roadmap process in different formats like PDF, PNG, and JPG by clicking the download button below. This PPT design is available in both Standard Screen and Widescreen aspect ratios. It can also be easily personalized and presented with modified font size, font type, color, and shapes to measure your progress in a clear way.
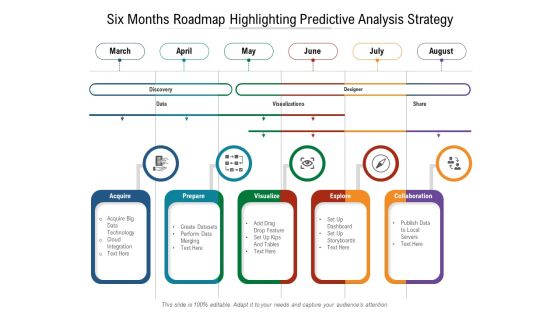
Six Months Roadmap Highlighting Predictive Analysis Strategy Brochure
Presenting our innovatively-structured six months roadmap highlighting predictive analysis strategy brochure Template. Showcase your roadmap process in different formats like PDF, PNG, and JPG by clicking the download button below. This PPT design is available in both Standard Screen and Widescreen aspect ratios. It can also be easily personalized and presented with modified font size, font type, color, and shapes to measure your progress in a clear way.
Software Test Scenario Checklist Icon Mockup PDF
Showcasing this set of slides titled Software Test Scenario Checklist Icon Mockup PDF. The topics addressed in these templates are Software Test, Scenario Project, Management Icon. All the content presented in this PPT design is completely editable. Download it and make adjustments in color, background, font etc. as per your unique business setting.
 Home
Home