Infographic Circular

Brand Loyalty Through Public Relation Tactics Ppt PowerPoint Presentation Infographics Infographics PDF
Presenting brand loyalty through public relation tactics ppt powerpoint presentation infographics infographics pdf to dispense important information. This template comprises three stages. It also presents valuable insights into the topics including brand loyalty through public relation tactics. This is a completely customizable PowerPoint theme that can be put to use immediately. So, download it and address the topic impactfully.

Four Petals Showing Design Thinking Approach Ppt PowerPoint Presentation Infographics Infographics PDF
Persuade your audience using this four petals showing design thinking approach ppt powerpoint presentation infographics infographics pdf. This PPT design covers four stages, thus making it a great tool to use. It also caters to a variety of topics including use swot analysis, design thinking approach, input from your team and mentors, market research and customer outreach. Download this PPT design now to present a convincing pitch that not only emphasizes the topic but also showcases your presentation skills.

Circle Of Technology And Communication Icons Powerpoint Template
This business slide has been designed with circular infographic. This diagram is suitable for technology and communication related topics. This professional slide helps in making an instant impact on viewers.
Five Boxes With Different Icons Powerpoint Template
This PowerPoint template has been designed with five boxes infographic. Download this circular diagram to depict workflow. You can easily customize this template to make it more unique as per your need.
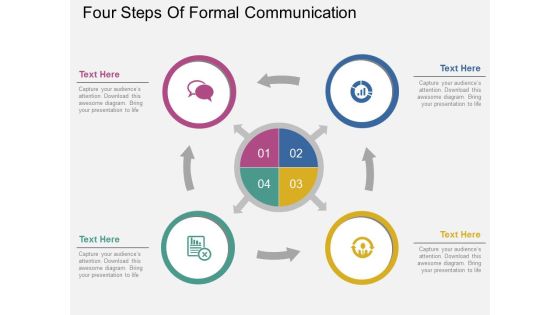
Four Steps Of Formal Communication Powerpoint Template
This PowerPoint template contains circular infographic. This diagram is suitable present formal communication. Visual effect of this diagram helps in maintaining the flow of the discussion and provides more clarity to the subject.

Circles For Business Process And Technology Powerpoint Templates
This PowerPoint diagram slide contains circular infographic. Download this diagram slide to display six steps of business process. You can edit text, color, shade and style of this diagram as per you need.

Circle Of Business Icons And Process Powerpoint Templates
This business diagram has been designed with diagram of circular infographic. Download this slide to portray concept of management strategy for success. This diagram can be used for global business and communication related topics.
Four Staged Interconnected Circles With Icons Powerpoint Templates
Create visually stunning and define your presentations in a unique and inspiring manner using our above template. It contains diagram of circular infographic. Download this slide to display planning for business growth.
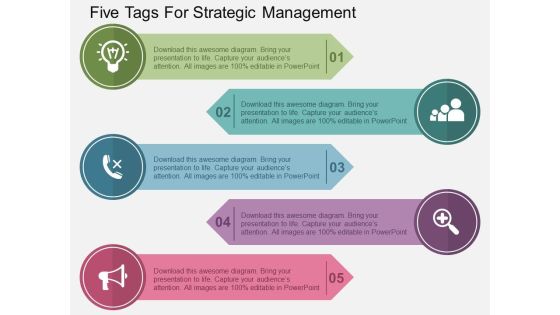
Five Tags For Strategic Management Powerpoint Templates
Our above slide contains diagram of circular infographic. It helps to exhibit six steps of goal planning. Use this diagram to impart more clarity to data and to create more sound impact on viewers.
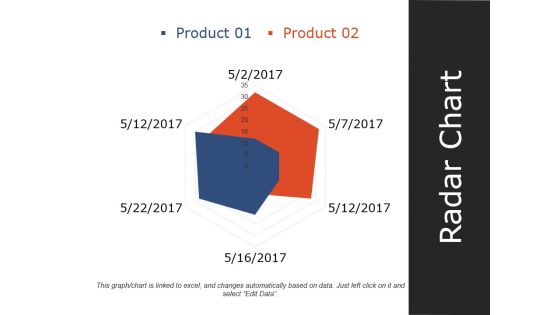
Radar Chart Ppt PowerPoint Presentation Infographics Slideshow
This is a radar chart ppt powerpoint presentation infographics slideshow. This is a two stage process. The stages in this process are product, radar chart, shape, management, marketing.

Radar Chart Ppt PowerPoint Presentation Infographics Ideas
This is a radar chart ppt powerpoint presentation infographics ideas. This is a three stage process. The stages in this process are product, business, shapes, marketing, radar chart.
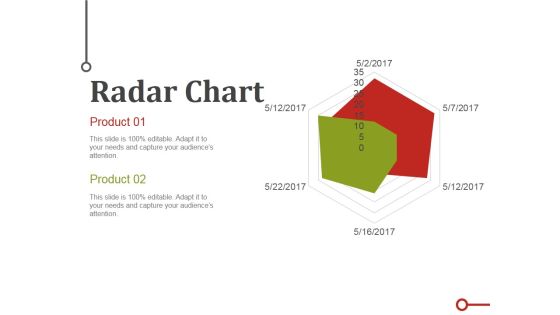
Radar Chart Ppt PowerPoint Presentation Infographics Templates
This is a radar chart ppt powerpoint presentation infographics templates. This is a two stage process. The stages in this process are business, marketing, charts, radar, scatter.

Communication Strategy Ppt PowerPoint Presentation Infographics
This is a communication strategy ppt powerpoint presentation infographics. This is a six stage process. The stages in this process are business, marketing, diagram, presentation.
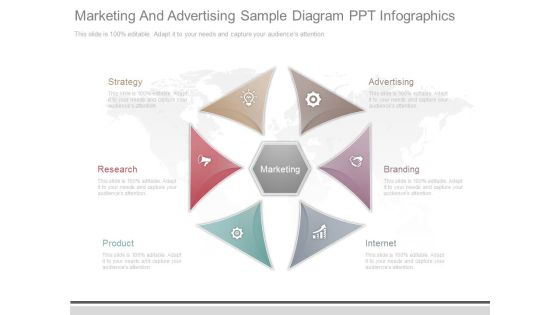
Marketing And Advertising Sample Diagram Ppt Infographics
This is a marketing and advertising sample diagram ppt infographics. This is a six stage process. The stages in this process are marketing, strategy, research, product, advertising, branding, internet.

Radar Chart Ppt PowerPoint Presentation Styles Infographics
This is a radar chart ppt powerpoint presentation styles infographics. This is a six stage process. The stages in this process are business, marketing, product, radar chart, strategy.
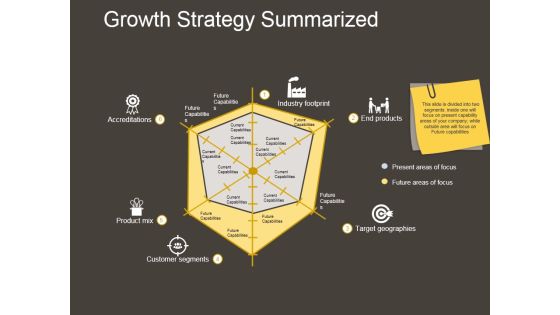
Growth Strategy Summarized Ppt PowerPoint Presentation Infographics
This is a growth strategy summarized ppt powerpoint presentation infographics. This is a six stage process. The stages in this process are accreditations, product mix, customer segments, target geographies, end products, industry footprint.

Business Process Improvement Ppt PowerPoint Presentation Infographics Show
This is a business process improvement ppt powerpoint presentation infographics show. This is a five stage process. The stages in this process are business, marketing, circle, process, arrow.

Customer Loyalty Lifecycle Ppt PowerPoint Presentation Infographics Icons
This is a customer loyalty lifecycle ppt powerpoint presentation infographics icons. This is a seven stage process. The stages in this process are attract, loyalty, engage, retain, reward.

Employee Referral Bonus Announcement Ppt PowerPoint Presentation Infographics Layout
This is a employee referral bonus announcement ppt powerpoint presentation infographics layout. This is a six stage process. The stages in this process are employee referral bonus announcement.

Media Objectives Template 1 Ppt PowerPoint Presentation Infographics Objects
This is a media objectives template 1 ppt powerpoint presentation infographics objects. This is a three stage process. The stages in this process are step, business, marketing, management.
Musical Instrument Vector Icon Ppt Powerpoint Presentation Infographics Backgrounds
This is a musical instrument vector icon ppt powerpoint presentation infographics backgrounds. This is a three stage process. The stages in this process are harmonization, standarization, redundant.
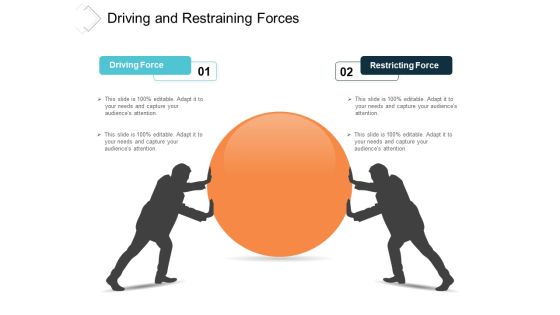
Driving And Restraining Forces Ppt Powerpoint Presentation Infographics Inspiration
This is a driving and restraining forces ppt powerpoint presentation infographics inspiration. This is a two stage process. The stages in this process are strength, efforts, forces.

Circle With Four Sections Ppt PowerPoint Presentation Infographics Slides
This is a circle with four sections ppt powerpoint presentation infographics slides. This is a three stage process. The stages in this process are sectioned circle, segmented circle, partitioned circle.

Circle Of Colourful Human Hands Ppt PowerPoint Presentation Infographics Elements
This is a circle of colourful human hands ppt powerpoint presentation infographics elements. This is a four stage process. The stages in this process are human hand with circle of icons, unity hand circle icons, teamwork hand circle of icons.

Business Model Innovation Template Ppt PowerPoint Presentation Infographics Graphics Download
This is a business model innovation template ppt powerpoint presentation infographics graphics download. This is a seven stage process. The stages in this process are collaboration, ceo club, bmi award, future events, research studies.
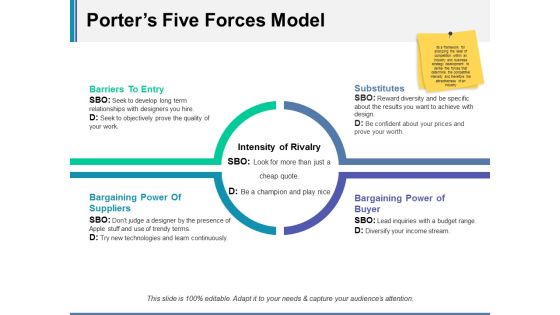
Porters Five Forces Model Ppt Powerpoint Presentation Infographics Background
This is a porters five forces model ppt powerpoint presentation infographics background. This is a four stage process. The stages in this process are barriers to entry, substitutes, bargaining power of suppliers, bargaining power of buyer.

Customer Support And Services Metrics Ppt PowerPoint Presentation Infographics Ideas
This is a customer support and services metrics ppt powerpoint presentation infographics ideas. This is a four stage process. The stages in this process are rep activity, team efficiency, churn prevention, product development.

Customer Acquisition Process Ppt PowerPoint Presentation Infographics Master Slide
This is a customer acquisition process ppt powerpoint presentation infographics master slide. This is a six stage process. The stages in this process are seo, analytics, market research, blog, social networks.

Business Process Roadmap Ppt PowerPoint Presentation Infographics Example Topics
This is a business process roadmap ppt powerpoint presentation infographics example topics. This is a five stage process. The stages in this process are process, business, management, strategy, planning.

Steps Of Order Fulfillment Ppt PowerPoint Presentation Infographics Pictures
This is a steps of order fulfillment ppt powerpoint presentation infographics pictures. This is a four stage process. The stages in this process are customer, merchant, order management, fulfillment, returns.

Business Transformation Areas Ppt PowerPoint Presentation Infographics Graphics
This is a business transformation areas ppt powerpoint presentation infographics graphics. This is a five stage process. The stages in this process are business analytics, project management, project leadership, change management, business transformation.

Business Ethics Survey Reverse Engineering Ppt PowerPoint Presentation Infographics Portrait
This is a business ethics survey reverse engineering ppt powerpoint presentation infographics portrait. This is a five stage process. The stages in this process are business ethics survey, reverse engineering.

Business Process Integration Ppt PowerPoint Presentation Infographics Objects
This is a business process integration ppt powerpoint presentation infographics objects. This is a three stage process. The stages in this process are process integration, integration of processes, integration of procedure.
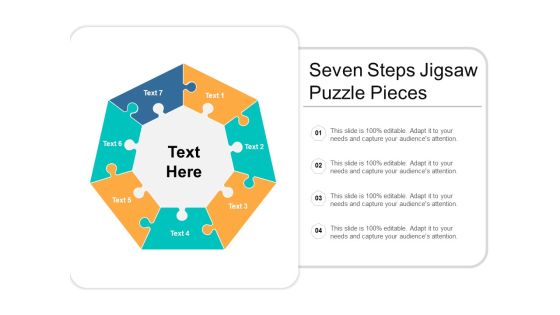
Seven Steps Jigsaw Puzzle Pieces Ppt PowerPoint Presentation Infographics Graphics
This is a seven steps jigsaw puzzle pieces ppt powerpoint presentation infographics graphics. This is a seven stage process. The stages in this process are 5 pieces jigsaw puzzle, 5 parts jigsaw puzzle, 5 segments jigsaw puzzle.

Manifesto For Agile Application Development Agile Marketing Values Infographics PDF
This slide provides the glimpse about the agile marketing values such as validated learning, customer focused collaboration, adaptive campaigns, customer discovery, flexible planning, etc. This is a Manifesto For Agile Application Development Agile Marketing Values Infographics PDF template with various stages. Focus and dispense information on seven stages using this creative set, that comes with editable features. It contains large content boxes to add your information on topics like Validated Learning, Customer Focused Collaboration, Adaptive And Iterative Campaigns, ProcessCustomer Discovery. You can also showcase facts, figures, and other relevant content using this PPT layout. Grab it now.
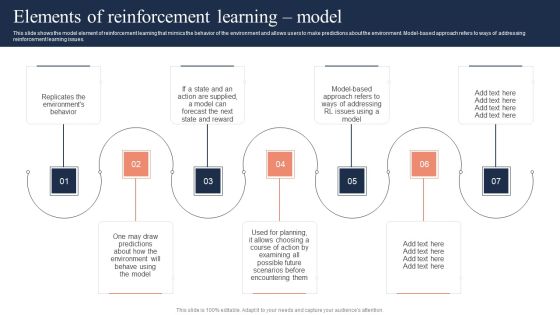
Fundamentals Of Reinforcement Elements Of Reinforcement Learning Model Infographics PDF
This slide shows the model element of reinforcement learning that mimics the behavior of the environment and allows users to make predictions about the environment. Model-based approach refers to ways of addressing reinforcement learning issues. Want to ace your presentation in front of a live audience Our Fundamentals Of Reinforcement Elements Of Reinforcement Learning Model Infographics PDF can help you do that by engaging all the users towards you. Slidegeeks experts have put their efforts and expertise into creating these impeccable powerpoint presentations so that you can communicate your ideas clearly. Moreover, all the templates are customizable, and easy-to-edit and downloadable. Use these for both personal and commercial use.

Exploring Digital Marketing Learning Model Ppt Infographics Picture PDF
This slide illustrate the roadmap to becoming a digital marketing specialist by exploring modern ways of marketing. It includes search engine optimization, email, search engine marketing, social media and content. Presenting Exploring Digital Marketing Learning Model Ppt Infographics Picture PDF to dispense important information. This template comprises five stages. It also presents valuable insights into the topics including SEO, Email, Content, Social Media, SEM. This is a completely customizable PowerPoint theme that can be put to use immediately. So, download it and address the topic impactfully.

Challenges Of Online Business Ppt PowerPoint Presentation Show Infographics
This is a challenges of online business ppt powerpoint presentation show infographics. This is a five stage process. The stages in this process are checklist, list of ideas, pain points.

Puzzle Ppt PowerPoint Presentation Infographics Good
This is a puzzle ppt powerpoint presentation infographics good. This is a two stage process. The stages in this process are business, strategy, planning, marketing, process.

Venn Ppt PowerPoint Presentation Infographics Example Topics
This is a venn ppt powerpoint presentation infographics example topics. This is a four stage process. The stages in this process are venn, marketing, management, strategy, business.

Pie Chart Ppt PowerPoint Presentation Infographics Templates
This is a pie chart ppt powerpoint presentation infographics templates. This is a five stage process. The stages in this process are business, percentage, management, process.

Hobbies Ppt PowerPoint Presentation Infographics Examples
This is a hobbies ppt powerpoint presentation infographics examples. This is a four stage process. The stages in this process are hobbies, icon, business, marketing, strategy.

Financial Ppt PowerPoint Presentation Infographics Portrait
This is a financial ppt powerpoint presentation infographics portrait. This is a three stage process. The stages in this process are maximum, medium, minimum.
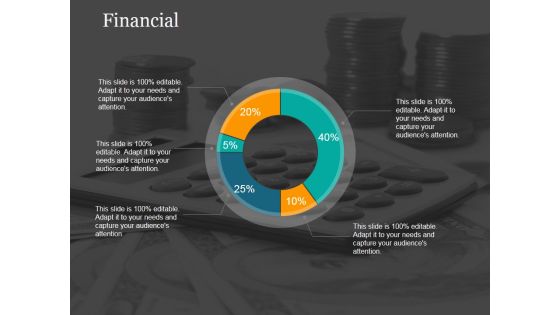
Financial Ppt PowerPoint Presentation Infographics Example File
This is a financial ppt powerpoint presentation infographics example file. This is a five stage process. The stages in this process are business, finance, marketing, strategy, process.
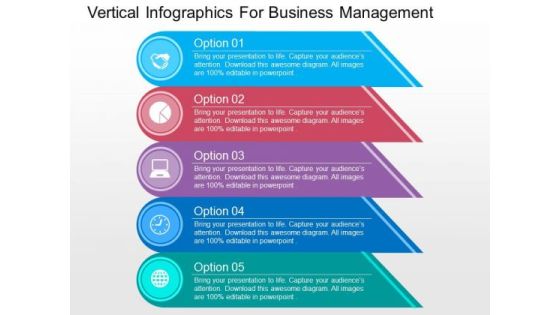
Vertical Infographics For Business Management PowerPoint Templates
Our above PPT slide displays vertical infographic. This diagram slide may use to represent concepts related to business management. Download this template to leave permanent impression on your audience.

Continuous Process Improvement Plan Overview Infographics PDF
The slide outlines the plan for continuous process improvement for overall organizational growth. Various steps included are assess, design, implement and monitor. Showcasing this set of slides titled Continuous Process Improvement Plan Overview Infographics PDF. The topics addressed in these templates are Increase Staff Motivation, Eliminate Extra Processes, Increase Tools Efficiency. All the content presented in this PPT design is completely editable. Download it and make adjustments in color, background, font etc. as per your unique business setting.

Pie Chart Ppt PowerPoint Presentation Infographics Show
This is a pie chart ppt powerpoint presentation infographics show. This is a three stage process. The stages in this process are process, percentage, business, marketing, success, pie chart.
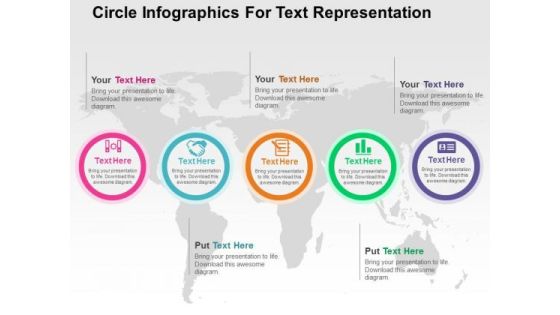
Circle Infographics For Text Representation PowerPoint Templates
This creative slide is designed with graphics of circles. This slide has been designed for text representation. Use this diagram in business presentations to give better impact.
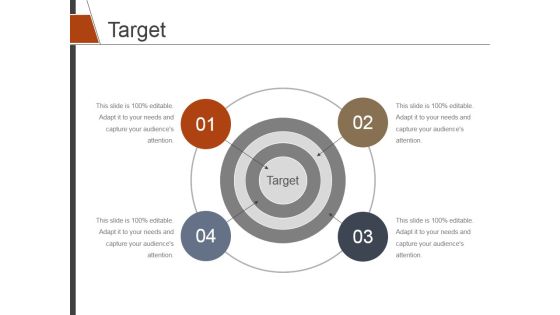
Target Ppt PowerPoint Presentation Infographics Visual Aids
This is a target ppt powerpoint presentation infographics visual aids. This is a four stage process. The stages in this process are business, our goal, target, competition, strategy, analysis.

Magnifying Glass Ppt PowerPoint Presentation Infographics
This is a magnifying glass ppt powerpoint presentation infographics. This is a five stage process. The stages in this process are business, marketing, management, process, magnifier glass.

Circles Infographics For Business Services Powerpoint Template
This business slide contains five circles process diagram. This diagram provides schematic representation of any information. Visual effect this slide helps in maintaining the flow of the discussion and provides more clarity to the subject.
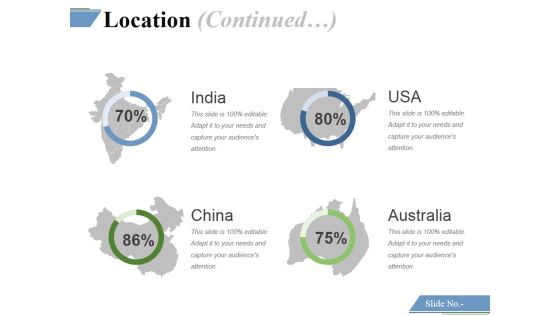
Location Continued Ppt PowerPoint Presentation Ideas Infographics
This is a location continued ppt powerpoint presentation ideas infographics. This is a four stage process. The stages in this process are india, usa, china, australia.

Service Provider Technology Transformation Model Infographics PDF
The following slide showcases new technology cycle which influences consumer behaviour. It presents information related to business investing, communication ways, etc. Presenting Service Provider Technology Transformation Model Infographics PDF to dispense important information. This template comprises one stages. It also presents valuable insights into the topics including Improved Customer Experience, Digital Transformation, Customer Behaviour. This is a completely customizable PowerPoint theme that can be put to use immediately. So, download it and address the topic impactfully.

Datafy Framework Of Datafication Technology Infographics PDF
This slide represents the framework of datafication technology, and it includes two cycles such as design data and data use. The design data further contains four elements, including domain, domain model, implementation and appropriation, and design. Whether you have daily or monthly meetings, a brilliant presentation is necessary. Datafy Framework Of Datafication Technology Infographics PDF can be your best option for delivering a presentation. Represent everything in detail using Datafy Framework Of Datafication Technology Infographics PDF and make yourself stand out in meetings. The template is versatile and follows a structure that will cater to your requirements. All the templates prepared by Slidegeeks are easy to download and edit. Our research experts have taken care of the corporate themes as well. So, give it a try and see the results.

Total Quality Management Elements System Infographics PDF
This slide shows components of total quality management that should be considered for better quality of output. It include elements such as commitment and understanding, quality improvement culture, continuous improving areas etc. Persuade your audience using this Total Quality Management Elements System Infographics PDF. This PPT design covers five stages, thus making it a great tool to use. It also caters to a variety of topics including Continuous Improving Areas, Customer Satisfaction Advantages, Effective Control Measures. Download this PPT design now to present a convincing pitch that not only emphasizes the topic but also showcases your presentation skills.
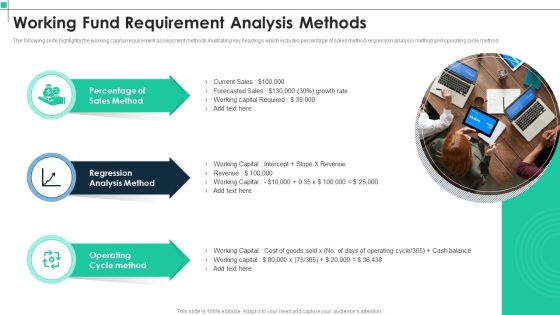
Working Fund Requirement Analysis Methods Infographics PDF
The following slide highlights the working capital requirement assessment methods illustrating key headings which includes percentage of sales method, regression analysis method and operating cycle method. Persuade your audience using this Working Fund Requirement Analysis Methods Infographics PDF. This PPT design covers three stages, thus making it a great tool to use. It also caters to a variety of topics including Sales Method, Regression Analysis Method, Operating Cycle Method. Download this PPT design now to present a convincing pitch that not only emphasizes the topic but also showcases your presentation skills.

Benefits Of Conversational Marketing Infographics PDF
Purpose of the following slide is to display benefits of conversational marketing. These benefits can be increase in customer satisfaction rate, better insight into customer behavior, reduction in cost, short sales cycle, increase in lead quality etc. This is a Benefits Of Conversational Marketing Infographics PDF template with various stages. Focus and dispense information on eight stages using this creative set, that comes with editable features. It contains large content boxes to add your information on topics like Customer Satisfaction Rate, Quality, Sales Cycle. You can also showcase facts, figures, and other relevant content using this PPT layout. Grab it now.

Circle Infographics For Visual Representation Powerpoint Template
This business slide provides background for four option display. Display the options, business steps or workflow using this diagram as a tool. You can present your opinions using this impressive slide.
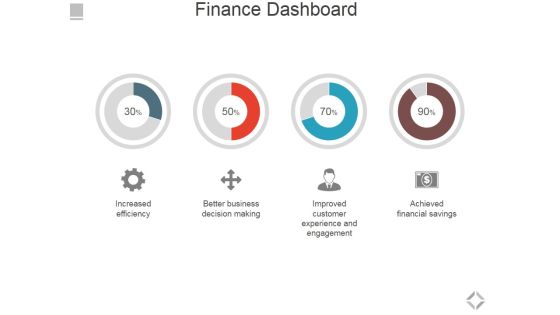
Finance Dashboard Ppt PowerPoint Presentation Layouts Infographics
This is a finance dashboard ppt powerpoint presentation layouts infographics. This is a four stage process. The stages in this process are increased efficiency, better business decision making, improved customer experience and engagement, achieved financial savings.

Market Budget Ppt PowerPoint Presentation Infographics
This is a market budget ppt powerpoint presentation infographics. This is a five stage process. The stages in this process are marketing objectives, target marketing, business opportunities, competition, product and services.

 Home
Home