Infographic Circular

Key Skills Circle Chart Ppt Infographics
This is a key skills circle chart ppt infographics. This is a five stage process. The stages in this process are questioning, researching, analyzing, evaluating, communicating, key skills.

Basic Enhancement Template Diagram Ppt Infographics
This is a basic enhancement template diagram ppt infographics. This is a four stage process. The stages in this process are creative, problem, insight, solution.
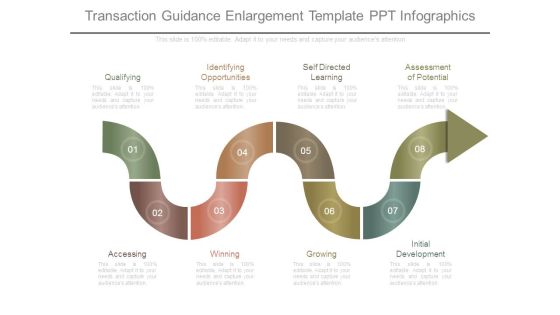
Transaction Guidance Enlargement Template Ppt Infographics
This is a transaction guidance enlargement template ppt infographics. This is a eight stage process. The stages in this process are qualifying, accessing, identifying opportunities, winning, self directed learning, growing, assessment of potential, initial development.

Service Improvement Plan Pie Chart Ppt Infographics
This is a service improvement plan pie chart ppt infographics. This is a four stage process. The stages in this process are service improvement plan, business, strategy, marketing, management.

Employee Performance Comparison Ppt Infographics
This is a employee performance comparison ppt infographics. This is a two stage process. The stages in this process are customer focus, accountability, service excellence, problem solving, continuous improvement, collaborative conflict resolution.

Circle Chart With Educational Icons Powerpoint Template
This PPT slide has been designed with circular infographic diagram. This PowerPoint diagram is suitable for education and study related topics. This professional slide helps in making an instant impact on viewers.

Circle Of Five Banking And Financial Icons Powerpoint Template
Concepts of banking and finance have been displayed in this power point template. This PPT diagram contains the circular infographic layout. Use this PPT diagram slide to make outstanding presentations.

Circle Of Six Business Options Powerpoint Templates
This PowerPoint template has been designed with circle of six business options. This circular infographic contains the concept of target achievement. Add this slide to your presentation and impress your audiences.

Four Wings Diagram For Process Control Powerpoint Template
Our above business slide contains circular infographic design. This PowerPoint slide may be used to exhibit business planning and process control. Capture the attention of your audience with this slide.
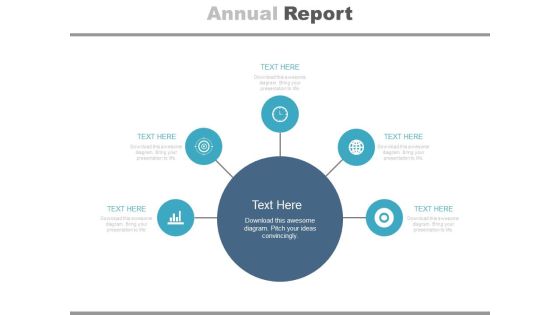
Diagram For Market Research Analysis Powerpoint Slides
This PowerPoint template has been designed with circular infographic diagram. It can be used to display steps for market research and also for financial data analysis. You can download finance PowerPoint template to prepare awesome presentations.
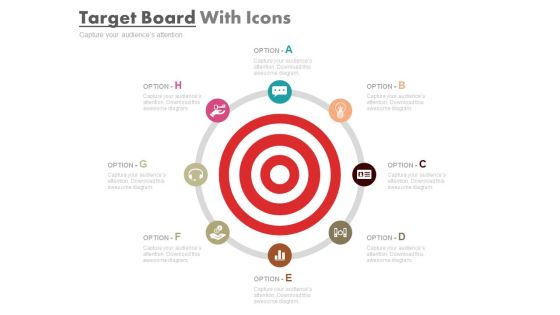
Role Of Strategies And Action Plans Powerpoint Slides
This PowerPoint template is useful for making presentations on business goals and strategy formation. This PPT background has a design of circular infographic diagram. This PPT slide is suitable for topics like corporate strategic planning.

Six Steps For Global Business Process Powerpoint Template
This Power Point template has been designed with circular infographic diagram. This PPT slide may be used to display global business process. Use this PPT diagram for business and finance related presentations.

Colorful Infographics For Business Process Powerpoint Templates
Our professionally designed business diagram is as an effective tool for communicating ideas and planning. It contains circular graphics for project task and resources. Convey your views with this diagram slide. It will amplify the strength of your logic.
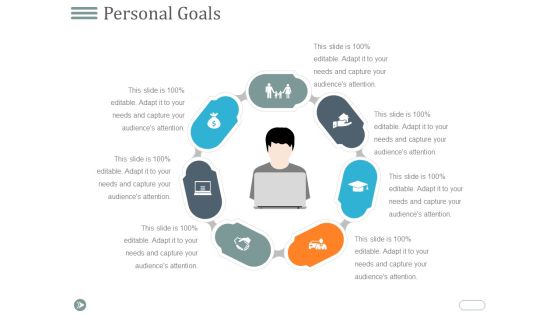
Personal Goals Ppt PowerPoint Presentation Infographics Example
This is a personal goals ppt powerpoint presentation infographics example. This is a seven stage process. The stages in this process are process, icons, business, management.

Business Model Ppt PowerPoint Presentation Infographics Smartart
This is a business model ppt powerpoint presentation infographics smartart. This is a four stage process. The stages in this process are business, management, marketing, process.
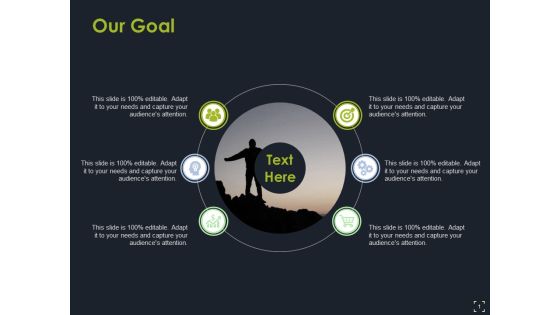
Our Goal Ppt PowerPoint Presentation Infographics Ideas
This is a our goal ppt powerpoint presentation infographics ideas. This is a six stage process. The stages in this process are our goal, icons, marketing, strategy, business.
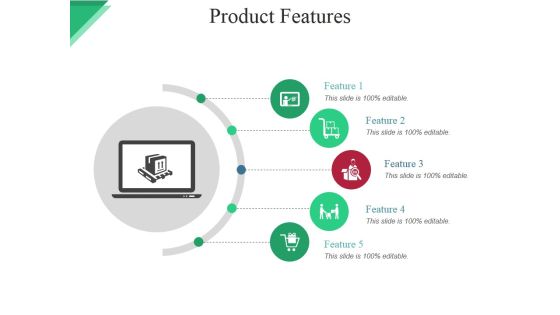
Product Features Ppt PowerPoint Presentation Infographics Microsoft
This is a product features ppt powerpoint presentation infographics microsoft. This is a six stage process. The stages in this process are icons, technology, business, marketing, strategy.

Scm Advantages Ppt PowerPoint Presentation Infographics Aids
This is a scm advantages ppt powerpoint presentation infographics aids. This is a seven stage process. The stages in this process are business, icons, strategy, marketing.
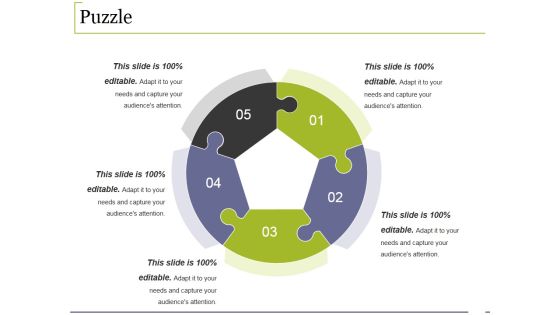
Puzzle Ppt PowerPoint Presentation Infographics Inspiration
This is a puzzle ppt powerpoint presentation infographics inspiration. This is a five stage process. The stages in this process are puzzle, business, management, marketing, strategy.

Puzzle Ppt PowerPoint Presentation Infographics Images
This is a puzzle ppt powerpoint presentation infographics images. This is a four stage process. The stages in this process are puzzle, business, marketing, strategy, planning.

Scheduling Ppt PowerPoint Presentation Infographics Slides
This is a scheduling ppt powerpoint presentation infographics slides. This is a six stage process. The stages in this process are jan, feb, mar, apr, may, jun, our core values.

Service Development Ppt PowerPoint Presentation Infographics Visuals
This is a service development ppt powerpoint presentation infographics visuals. This is a three stage process. The stages in this process are brainstorm concepts, prioritize insight, hypothesis, experiment, clear need.

Revenue Streams Ppt PowerPoint Presentation Infographics Layout
This is a revenue streams ppt powerpoint presentation infographics layout. This is a four stage process. The stages in this process are partner commission, supplier commission, selling in house products, indirect sources such as advertising, affiliates etc.

Expense Model Ppt PowerPoint Presentation Infographics Portrait
This is a expense model ppt powerpoint presentation infographics portrait. This is a seven stage process. The stages in this process are name of company and purpose it serves, average cost to acquire a customer, how long will new funding last, how long is sales cycle to get a client.

SMM Strategies Ppt PowerPoint Presentation Infographics Template
Presenting this set of slides with name smm strategies ppt powerpoint presentation infographics template. This is a seven stage process. The stages in this process are content, implement, goal, social media, marketing strategy. This is a completely editable PowerPoint presentation and is available for immediate download. Download now and impress your audience.
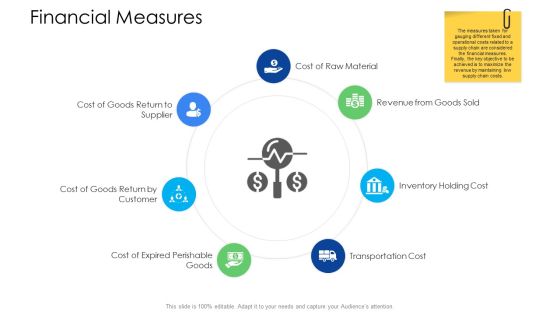
Logistics Management Services Financial Measures Infographics PDF
Presenting logistics management services financial measures infographics pdf to provide visual cues and insights. Share and navigate important information on seven stages that need your due attention. This template can be used to pitch topics like revenue from goods sold, inventory holding cost, transportation cost, cost of raw material. In addtion, this PPT design contains high resolution images, graphics, etc, that are easily editable and available for immediate download.

System For Operational Performance Management Infographics PDF
This slide covers the framework for operational performance management which includes planning, executing, measuring and improving with key business drivers such as people, leadership, operational security, etc. Presenting System For Operational Performance Management Infographics PDF to dispense important information. This template comprises four stages. It also presents valuable insights into the topics including Performance, Procedures, People, Plant. This is a completely customizable PowerPoint theme that can be put to use immediately. So, download it and address the topic impactfully.

EMM Solution International Market Segmentation Infographics PDF
This is a emm solution international market segmentation infographics pdf template with various stages. Focus and dispense information on four stages using this creative set, that comes with editable features. It contains large content boxes to add your information on topics like international market segmentation, cultural, geographic, economic, political legal. You can also showcase facts, figures, and other relevant content using this PPT layout. Grab it now.

Companys Merger And Acquisition Process Infographics PDF
This slide shows the companys merger and acquisition process which includes Definition of strategic goals, definition of investment framework, carrying out of target screening, etc.This is a companys merger and acquisition process infographics pdf template with various stages. Focus and dispense information on six stages using this creative set, that comes with editable features. It contains large content boxes to add your information on topics like carrying out of target screening, definition of investment framework, definition of strategic goal. You can also showcase facts, figures, and other relevant content using this PPT layout. Grab it now.

Catastrophe Recovery Application Plan Introduction Infographics PDF
This slide represents the disaster recovery plan and various steps of an effective DR plan, such as assemble a plan, identify the scope, appoint emergency contacts, designate a disaster recovery team, assign roles and responsibilities, and so on. Presenting catastrophe recovery application plan introduction infographics pdf to provide visual cues and insights. Share and navigate important information on eight stages that need your due attention. This template can be used to pitch topics like identify scope, assemble plan, testing and maintenance, restore technology functionality, disaster recovery plan. In addtion, this PPT design contains high resolution images, graphics, etc, that are easily editable and available for immediate download.

Knowledge Management Process Innovation Lifecycle Infographics PDF
The slide showcases knowledge management innovation cycle it illustrates the transformation of unstructured knowledge into more structured, reproducible information that is included into processes or products. It covers key processes like create, codify, embed and diffuse. Persuade your audience using this Knowledge Management Process Innovation Lifecycle Infographics PDF. This PPT design covers four stages, thus making it a great tool to use. It also caters to a variety of topics including Create, Codify, Embed. Download this PPT design now to present a convincing pitch that not only emphasizes the topic but also showcases your presentation skills.

Four Options Zigzag Infographics Powerpoint Template
Emphatically define your message with our above template which contains four options zigzag infographic. This business diagram may be used to plot data series. Deliver amazing presentations to mesmerize your audience.
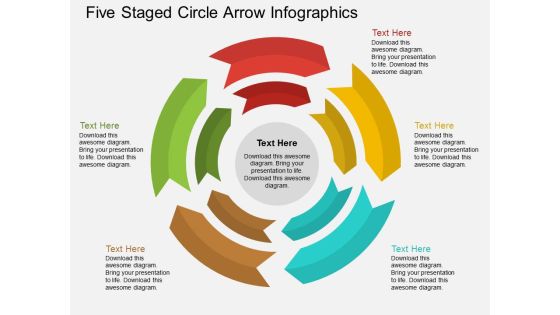
Five Staged Circle Arrow Infographics Powerpoint Template
This pre-designed and appealing graphics offer an optimized possibility to illustrate your business strategy. This PowerPoint slide displays five staged circle arrow infographic. You can present your opinions using this impressive slide.

Retail Conversion Strategy Diagram Ppt Infographics
This is a retail conversion strategy diagram ppt infographics. This is a five stage process. The stages in this process are sharing, browsing, buying, researching, evaluating.
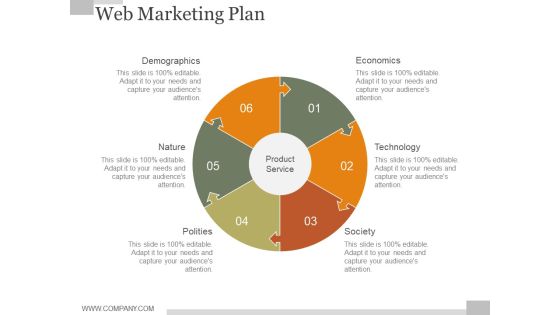
Web Marketing Plan Ppt PowerPoint Presentation Infographics
This is a web marketing plan ppt powerpoint presentation infographics. This is a six stage process. The stages in this process are demographics, nature, polities, economics, technology, society.

5S Analysis Ppt PowerPoint Presentation Infographics
This is a 5s analysis ppt powerpoint presentation infographics. This is a five stage process. The stages in this process are standardise, sustain, sort, straighten, shine.

Revenue Generating Ppt Powerpoint Presentation Layouts Infographics
This is a revenue generating ppt powerpoint presentation layouts infographics. This is a four stage process. The stages in this process are revenue generating.

Sample Sales Cycle Flow Chart Ppt Infographics
This is a sample sales cycle flow chart ppt infographics. This is a seven stage process. The stages in this process are fix it, feedback, ask customers, assess progress, set the improved product, make changes, improve it.

Tqm Principles Ppt PowerPoint Presentation Model Infographics
This is a tqm principles ppt powerpoint presentation model infographics. This is a eight stage process. The stages in this process are supplier relationship, decision making, continual improvement, strategic approach, process approach.

Action Plan Influencer Marketing Ppt Infographics
This is a action plan influencer marketing ppt infographics. This is a five stage process. The stages in this process are define, discover, monitor, take action, measure.
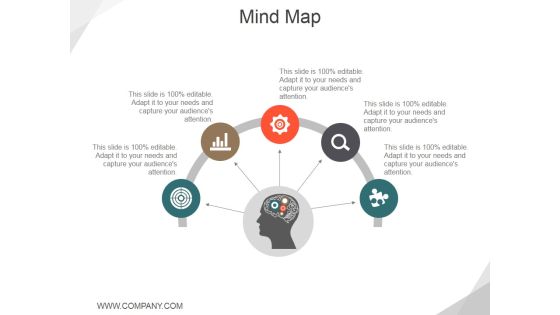
Mind Map Ppt PowerPoint Presentation File Infographics
This is a mind map ppt powerpoint presentation file infographics. This is a five stage process. The stages in this process are semi, icons, management, strategy.

Todays Goal Ppt PowerPoint Presentation Show Infographics
This is a todays goal ppt powerpoint presentation show infographics. This is a three stage process. The stages in this process are reliability, superior quality, commitment and dedication.
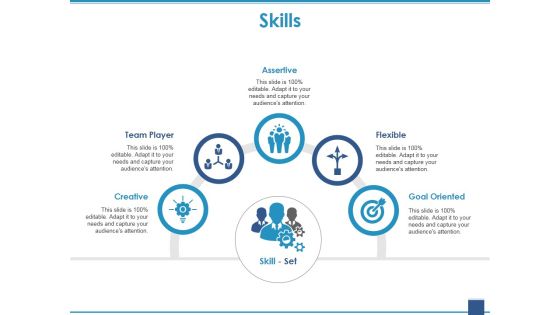
Skills Ppt PowerPoint Presentation Model Infographics
This is a skills ppt powerpoint presentation model infographics. This is a five stage process. The stages in this process are assertive, team player, creative, flexible, goal oriented.

Financial Measures Ppt PowerPoint Presentation Model Infographics
This is a financial measures ppt powerpoint presentation model infographics. This is a seven stage process. The stages in this process are cost of raw material, revenue from goods sold, inventory holding cost, transportation cost, cost of expired perishable goods.

Corporate Workflow Solutions Template Ppt Infographics
This is a corporate workflow solutions template ppt infographics. This is a five stage process. The stages in this process are reliable research management, electronic document management, automated work paper management, paperless tax management, streamlined fixed assets management.

Business Core Values Diagram Ppt Infographics
This is a business core values diagram ppt infographics. This is a six stage process. The stages in this process are execution, customer orientation, integrity, commitment, innovation, excellence, core value.

Integrated Quality Management System Diagram Infographics
This is a integrated quality management system diagram infographics. This is a six stage process. The stages in this process are integrated qm system, corporate legislation, local legislation, regulatory requirement, iso requirement, customer legislation, market legislation.
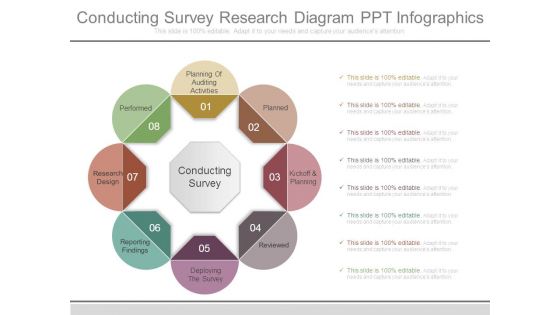
Conducting Survey Research Diagram Ppt Infographics
This is a conducting survey research diagram ppt infographics. This is a eight stage process. The stages in this process are planned, kickoff and planning, reviewed, deploying the survey, reporting findings, research design, performed, planning of auditing activities, conducting survey.

Why Six Sigma Ppt PowerPoint Presentation Infographics
This is a why six sigma ppt powerpoint presentation infographics. This is a five stage process. The stages in this process are bottom line, trained individuals, engagement, project by project, customer focused.

Principles Of Change Ppt PowerPoint Presentation Infographics
This is a principles of change ppt powerpoint presentation infographics. This is a seven stage process. The stages in this process are resistance and comfort, authority for change, value systems, incremental vs radical change, the right answer is not enough, change is a process, senders and receivers.
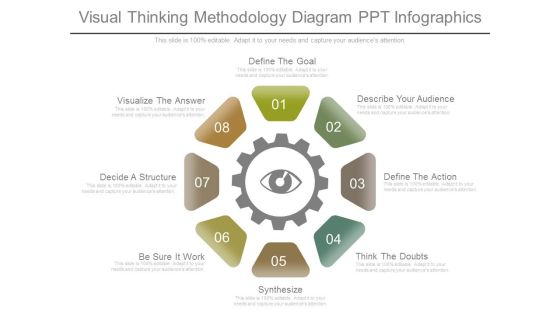
Visual Thinking Methodology Diagram Ppt Infographics
This is a visual thinking methodology diagram ppt infographics. This is a eight stage process. The stages in this process are define the goal, describe your audience, define the action, think the doubts, synthesize, be sure it work, decide a structure, visualize the answer.

Business Goal Strategy Infographics Layout Powerpoint Template
Visually support your presentation with our above template containing graphic of zigzag path towards goal. This diagram slide helps to portray goal achievement process. Etch your views in the brains of your audience with this diagram slide.

Four Petal Infographics On Globe Powerpoint Template
This PowerPoint slide contains design of four petal infographic on globe. This slide helps to global business planning. Illustrate your plans to your listeners with using this PowerPoint template.

Project Planning Process Ppt PowerPoint Presentation Infographics
This is a project planning process ppt powerpoint presentation infographics. This is a seven stage process. The stages in this process are project charter scope, project resource, project quality, project communication, project schedule, project budget and cost, project risk.
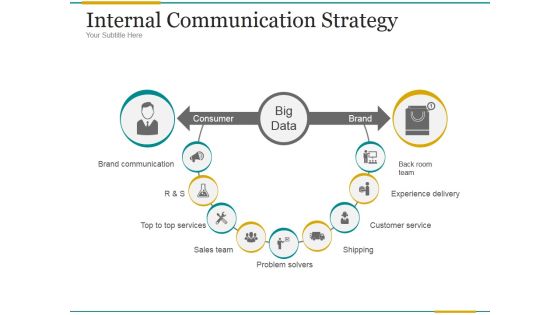
Internal Communication Strategy Ppt PowerPoint Presentation Infographics
This is a internal communication strategy ppt powerpoint presentation infographics. This is a nine stage process. The stages in this process are consumer brand, backroom team, experience delivery, customer service, shipping, problem solvers, sales team, top to top services, brand communication.
Hexagons And Icons For Corporate Marketing Powerpoint Template
This PowerPoint template slide contains circular hexagonal infographic. This PowerPoint diagram is suitable to present corporate marketing steps. Download this business slide to make impressive presentations.

7 Circle Infographics For Business Intelligence Teams Ppt PowerPoint Presentation Infographics Brochure PDF
Persuade your audience using this 7 circle infographics for business intelligence teams ppt powerpoint presentation infographics brochure pdf. This PPT design covers seven stages, thus making it a great tool to use. It also caters to a variety of topics including 7 circle infographics for business intelligence teams. Download this PPT design now to present a convincing pitch that not only emphasizes the topic but also showcases your presentation skills.

BI Sectional Two Interconnected Circles Ppt PowerPoint Presentation Infographics Infographics PDF
Presenting this set of slides with name bi sectional two interconnected circles ppt powerpoint presentation infographics infographics pdf. This is a two stage process. The stages in this process are bi sectional two interconnected circles. This is a completely editable PowerPoint presentation and is available for immediate download. Download now and impress your audience.

Connecting Data Points Vector Icon Ppt PowerPoint Presentation Infographics Infographics PDF
Presenting this set of slides with name connecting data points vector icon ppt powerpoint presentation infographics infographics pdf. This is a three stage process. The stages in this process are connecting data points vector icon. This is a completely editable PowerPoint presentation and is available for immediate download. Download now and impress your audience.
Interactive Voice Response For Customer Care Vector Icon Ppt PowerPoint Presentation Infographics Infographics PDF
Presenting this set of slides with name interactive voice response for customer care vector icon ppt powerpoint presentation infographics infographics pdf. This is a five stage process. The stages in this process are interactive voice response for customer care vector icon. This is a completely editable PowerPoint presentation and is available for immediate download. Download now and impress your audience.

 Home
Home