Indicators

HR Training Quality Performance Management Assurance Indicator Dashboard Structure PDF
Showcasing this set of slides titled HR Training Quality Performance Management Assurance Indicator Dashboard Structure PDF. The topics addressed in these templates are Performance Management, Assurance Indicator Dashboard. All the content presented in this PPT design is completely editable. Download it and make adjustments in color, background, font etc. as per your unique business setting.
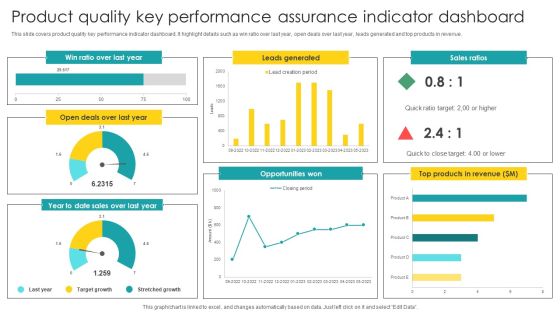
Product Quality Key Performance Assurance Indicator Dashboard Graphics PDF
Showcasing this set of slides titled Product Quality Key Performance Assurance Indicator Dashboard Graphics PDF. The topics addressed in these templates are Key Performance, Assurance Indicator, Dashboard. All the content presented in this PPT design is completely editable. Download it and make adjustments in color, background, font etc. as per your unique business setting.

Project Quality Management Key Performance Assurance Indicator Dashboard Guidelines PDF
Pitch your topic with ease and precision using this Project Quality Management Key Performance Assurance Indicator Dashboard Guidelines PDF. This layout presents information on Management Key, Performance Assurance, Indicator Dashboard. It is also available for immediate download and adjustment. So, changes can be made in the color, design, graphics or any other component to create a unique layout.
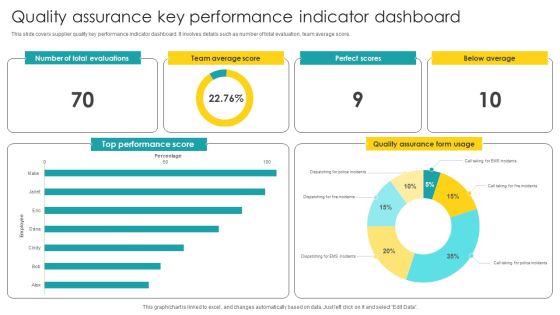
Quality Assurance Key Performance Indicator Dashboard Structure PDF
Showcasing this set of slides titled Quality Assurance Key Performance Indicator Dashboard Structure PDF. The topics addressed in these templates are Key Performance, Indicator Dashboard. All the content presented in this PPT design is completely editable. Download it and make adjustments in color, background, font etc. as per your unique business setting.

Quality Assurance Performance Indicator Dashboard For Insurance Company Brochure PDF
Pitch your topic with ease and precision using this Quality Assurance Performance Indicator Dashboard For Insurance Company Brochure PDF. This layout presents information on Performance Indicator, Dashboard For Insurance Company. It is also available for immediate download and adjustment. So, changes can be made in the color, design, graphics or any other component to create a unique layout.

Quality Key Performance Assurance Indicator Dashboard For Procurement Elements PDF
Pitch your topic with ease and precision using this Quality Key Performance Assurance Indicator Dashboard For Procurement Elements PDF. This layout presents information on Indicator Dashboard, Procurement. It is also available for immediate download and adjustment. So, changes can be made in the color, design, graphics or any other component to create a unique layout.
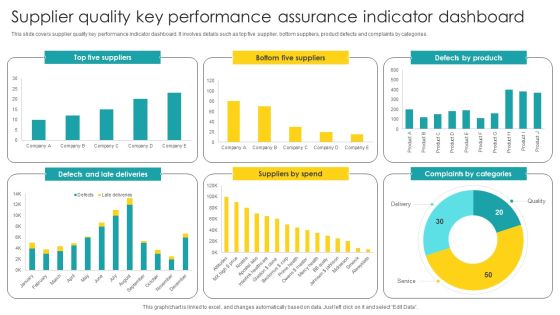
Supplier Quality Key Performance Assurance Indicator Dashboard Diagrams PDF
Showcasing this set of slides titled Supplier Quality Key Performance Assurance Indicator Dashboard Diagrams PDF. The topics addressed in these templates are Supplier Quality, Key Performance, Assurance Indicator. All the content presented in this PPT design is completely editable. Download it and make adjustments in color, background, font etc. as per your unique business setting.

Share Market Icon Indicating Bearish Trend Demonstration PDF
Presenting Share Market Icon Indicating Bearish Trend Demonstration PDF to dispense important information. This template comprises three stages. It also presents valuable insights into the topics including Share Market, Indicating Bearish, Trend. This is a completely customizable PowerPoint theme that can be put to use immediately. So, download it and address the topic impactfully.
Upselling Strategic Plan Icon Indicating Sales Revenue Growth Icons PDF
Persuade your audience using this Upselling Strategic Plan Icon Indicating Sales Revenue Growth Icons PDF. This PPT design covers three stages, thus making it a great tool to use. It also caters to a variety of topics including Revenue Growth, Upselling, Indicating. Download this PPT design now to present a convincing pitch that not only emphasizes the topic but also showcases your presentation skills.
Strategic Procurement Icon Indicating Business Growth Infographics PDF
Persuade your audience using this Strategic Procurement Icon Indicating Business Growth Infographics PDF. This PPT design covers three stages, thus making it a great tool to use. It also caters to a variety of topics including Strategic Procurement Icon, Indicating Business Growth. Download this PPT design now to present a convincing pitch that not only emphasizes the topic but also showcases your presentation skills.

Texting Platforms Dashboard Indicating SMS Marketing Metrics Designs PDF
This slide showcase messaging platforms dashboard indicating sms marketing metrics which can be referred by businesses to check the activity of their current texting campaign. It contains information about consumers, plan, send, campaigns, growth, reports, outgoing and incoming.Pitch your topic with ease and precision using this texting platforms dashboard indicating sms marketing metrics designs pdf This layout presents information on texting platforms dashboard indicating sms marketing metrics It is also available for immediate download and adjustment. So, changes can be made in the color, design, graphics or any other component to create a unique layout.
Risk Meter Indicating Extreme Level Ppt PowerPoint Presentation Icon Template
This is a risk meter indicating extreme level ppt powerpoint presentation icon template. This is a five stage process. The stages in this process are risk meter, risk speedometer, hazard meter.

Risk Meter Indicating Medium Risk Ppt PowerPoint Presentation Ideas Graphics
This is a risk meter indicating medium risk ppt powerpoint presentation ideas graphics. This is a three stage process. The stages in this process are risk meter, risk speedometer, hazard meter.
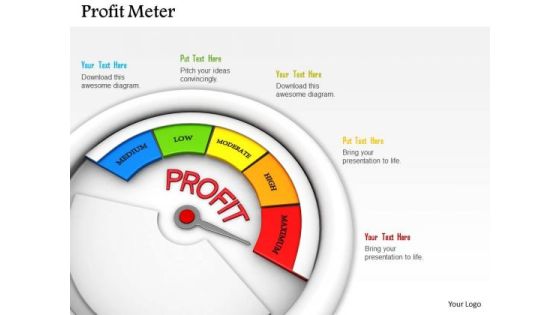
Stock Photo Meter Indicating Maximum Level Of Profit PowerPoint Slide
Display the concept of profit growth with this image. This image has been designed with graphics of meter indicating maximum level of profit. Use this image to make business presentations.

Stock Photo Meter Indicating Maximum Quality Level PowerPoint Slide
This image has been designed with graphics of meter indicating maximum level of quality. Concept of maintaining best quality can be explained with this image. Use this image to make business presentations.
Fuel Indicator Vector Icons Ppt PowerPoint Presentation File Example File
This is a fuel indicator vector icons ppt powerpoint presentation file example file. This is a three stage process. The stages in this process are fuel gauge, gas gauge, fuel containers.

Business Framework How To Measure Key Performance Indicator PowerPoint Presentation
This Power Point diagram slide has been crafted with graphic of flower petal diagram. This PPT slide contains the concept of measuring the key performance and indicate it. Use this PPT slide for your management related presentation.
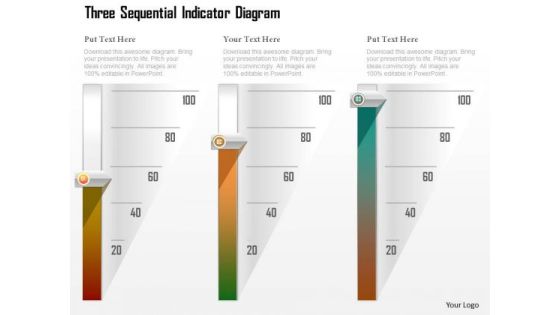
Business Diagram Three Sequential Indicator Diagram Presentation Template
Three staged sequential indicator diagram has been used to craft this power point template slide. This PPT slide contains the concept of sequential and linear process flow. Use this PPT for your business and marketing related presentations.
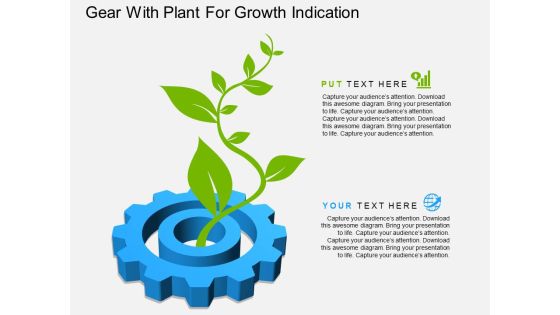
Gear With Plant For Growth Indication Powerpoint Template
This PowerPoint template has been designed with graphics of gear with plant. You may download this diagram slide to indicate growth process. Illustrate your plans to your listeners with this impressive template.
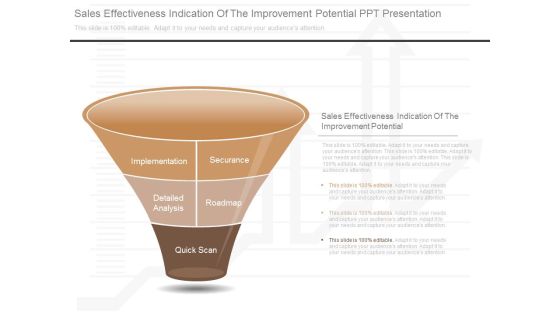
Sales Effectiveness Indication Of The Improvement Potential Ppt Presentation
This is a sales effectiveness indication of the improvement potential ppt presentation. This is a five stage process. The stages in this process are implementation, securance, detailed analysis, roadmap, quick scan.

Key Performance Indicator Dashboard Diagram Example Of Ppt
This is a key performance indicator dashboard diagram example of ppt. This is a five stage process. The stages in this process are relationships, account plans, account strategy, setting tools, reporting.

Media Performance Indicator Evaluation Process Ppt Background Designs
This is a media performance indicator evaluation process ppt background designs. This is a three stage process. The stages in this process are traffic, engagement, conversion, website visitors, high value actions, video views, purchases, installs, sign ups.
Key Performance Indicator Vector Icon Ppt PowerPoint Presentationmodel Brochure
This is a key performance indicator vector icon ppt powerpoint presentationmodel brochure. This is a three stage process. The stages in this process are kpi proposal, kpi plan, kpi scheme.
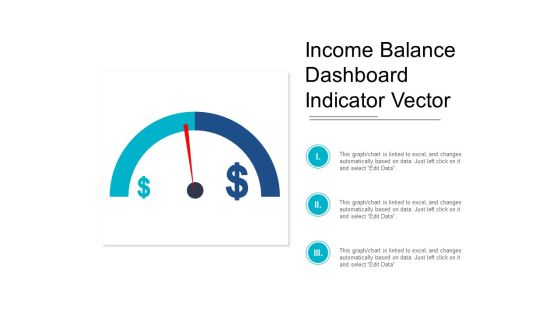
Income Balance Dashboard Indicator Vector Ppt PowerPoint Presentation Professional Diagrams
This is a income balance dashboard indicator vector ppt powerpoint presentation professional diagrams. This is a three stage process. The stages in this process are growth, increase sales, increase revenue.

Waterfall Chart Indicating Sales Performance Ppt PowerPoint Presentation Outline Templates
This is a waterfall chart indicating sales performance ppt powerpoint presentation outline templates. This is a seven stage process. The stages in this process are sales waterfall, waterfall chart, business.

Value Driven Management Process To Identify Performance Indicator Themes PDF
slide defines the phases leading to defining and implementing value drivers and key performance indicators. The purpose of this template is to analyze value based management model. It also includes elements such as analysis, recommendation, etc. Persuade your audience using this Value Driven Management Process To Identify Performance Indicator Themes PDF. This PPT design covers three stages, thus making it a great tool to use. It also caters to a variety of topics including Recommendation, Analytical Phase, Implementation. Download this PPT design now to present a convincing pitch that not only emphasizes the topic but also showcases your presentation skills.

Indicated Probability Ppt PowerPoint Presentation Outline Mockup Cpb Pdf
Presenting this set of slides with name indicated probability ppt powerpoint presentation outline mockup cpb pdf. This is an editable Powerpoint graphic that deals with topics like indicated probability to help convey your message better graphically. This product is a premium product available for immediate download and is 100 percent editable in Powerpoint. Download this now and use it in your presentations to impress your audience.

Calculate Facebook Key Performance Indicator The Engagement Rate Background PDF
Persuade your audience using this calculate facebook key performance indicator the engagement rate background pdf. This PPT design covers four stages, thus making it a great tool to use. It also caters to a variety of topics including calculate facebook key performance indicator the engagement rate. Download this PPT design now to present a convincing pitch that not only emphasizes the topic but also showcases your presentation skills.

HR Dashboard Indicating New Staff Induction Portrait PDF
The following slide exhibits human resource dashboard highlighting new employee onboarding and hiring status. It provides information about offers sent, hired, introduction time, progress, tasks, applications received, etc. Showcasing this set of slides titled HR Dashboard Indicating New Staff Induction Portrait PDF. The topics addressed in these templates are HR Dashboard Indicating New Staff Induction. All the content presented in this PPT design is completely editable. Download it and make adjustments in color, background, font etc. as per your unique business setting.

Client Solution Dashboard Indicating Support Team Performance Graphics PDF
This slide depicts support team performance dashboard indicating customer solutions delivery status. It provides information about requests, service level, revenue, support costs, customer satisfaction, average time to provide solution, etc. Showcasing this set of slides titled Client Solution Dashboard Indicating Support Team Performance Graphics PDF. The topics addressed in these templates are Costs, Revenue, Customer. All the content presented in this PPT design is completely editable. Download it and make adjustments in color, background, font etc. as per your unique business setting.

Product Feedback Survey For Indicating Consumer Opinions Diagrams PDF
This slide covers product survey for indicating consumer opinions which are store location, timings, ambience, quality and value for money.Showcasing this set of slides titled Product Feedback Survey For Indicating Consumer Opinions Diagrams PDF The topics addressed in these templates are Approachable Location, Product Availability, Ambience Appealing All the content presented in this PPT design is completely editable. Download it and make adjustments in color, background, font etc. as per your unique business setting.

Jidoka Strategy Matrix Indicating Lean Performance Measurement Download PDF
This slide showcased jidoka matrix indicating lean performance measurement. It provides information about tasks, scrap, rework, controlling defects, tools, manufacturing, benchmarking, etc.Pitch your topic with ease and precision using this Jidoka Strategy Matrix Indicating Lean Performance Measurement Download PDF. This layout presents information on Smooth Manufacturing, Benchmarking Tasks, Reallocate Procedures. It is also available for immediate download and adjustment. So, changes can be made in the color, design, graphics or any other component to create a unique layout.
Icon Indicating Managers Developing Risk Communication Strategies Plan Rules PDF
Persuade your audience using this Icon Indicating Managers Developing Risk Communication Strategies Plan Rules PDF. This PPT design covers four stages, thus making it a great tool to use. It also caters to a variety of topics including Icon Indicating Managers, Developing Risk Communication, Strategies Plan. Download this PPT design now to present a convincing pitch that not only emphasizes the topic but also showcases your presentation skills.

Icon Indicating Manager Planning For Risk Management Microsoft PDF
Persuade your audience using this Icon Indicating Manager Planning For Risk Management Microsoft PDF. This PPT design covers four stages, thus making it a great tool to use. It also caters to a variety of topics including Icon Indicating Manager Planning, Risk Management. Download this PPT design now to present a convincing pitch that not only emphasizes the topic but also showcases your presentation skills.

Opportunity Analysis Dashboard Indicating Business Performance Information Rules PDF
This slide shows opportunity analysis dashboard indicating market performance which contains opportunity count by size, sales stage, region, revenue and average revenue. Pitch your topic with ease and precision using this Opportunity Analysis Dashboard Indicating Business Performance Information Rules PDF. This layout presents information on Opportunity Count, Revenue, Sales. It is also available for immediate download and adjustment. So, changes can be made in the color, design, graphics or any other component to create a unique layout.
HR Meeting Icon Indicating Strategic OGSM Model Training Professional PDF
Persuade your audience using this HR Meeting Icon Indicating Strategic OGSM Model Training Professional PDF. This PPT design covers Three stages, thus making it a great tool to use. It also caters to a variety of topics including HR Meeting Icon, Indicating Strategic, OGSM Model Training. Download this PPT design now to present a convincing pitch that not only emphasizes the topic but also showcases your presentation skills.
Icon Indicating Business Corporate Sustainability For Future Diagrams PDF
The following slide showcases techniques to bring sustainability in startups. It provides information about sustainable solutions, eco point, electric vehicles, ozone generator, etc.Pitch your topic with ease and precision using this Icon Indicating Business Corporate Sustainability For Future Diagrams PDF. This layout presents information on Icon Indicating, Business Corporate, Sustainability Future. It is also available for immediate download and adjustment. So, changes can be made in the color, design, graphics or any other component to create a unique layout.

Leadership Methods Grid Indicating Customer Behavior Graphics PDF
This slide covers the leadership matrix indicating the supportive and directive behavior in each of the four quadrants. It includes directing, coaching, supporting and delegating. Presenting Leadership Methods Grid Indicating Customer Behavior Graphics PDF to dispense important information. This template comprises four stages. It also presents valuable insights into the topics including Directing, Supporting, Coaching, Delegating. This is a completely customizable PowerPoint theme that can be put to use immediately. So, download it and address the topic impactfully.

Team Management Dashboard Indicating Contract Details Diagrams PDF
This slide illustrates team management dashboard indicating agreement details which contains annual value, suppliers, types, renewals, categories, etc. Showcasing this set of slides titled Team Management Dashboard Indicating Contract Details Diagrams PDF. The topics addressed in these templates are Suppliers, Agreements, Total Annual Value. All the content presented in this PPT design is completely editable. Download it and make adjustments in color, background, font etc. as per your unique business setting.
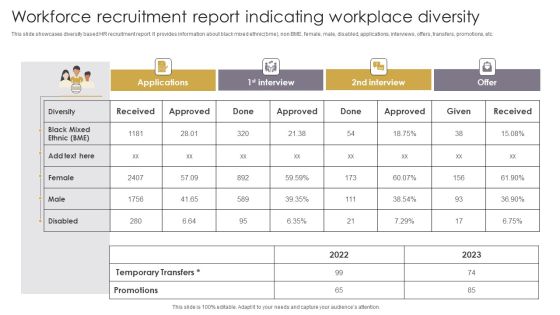
Workforce Recruitment Report Indicating Workplace Diversity Slides PDF
This slide showcases diversity based HR recruitment report. It provides information about black mixed ethnic bme, non BME, female, male, disabled, applications, interviews, offers, transfers, promotions, etc. Showcasing this set of slides titled Workforce Recruitment Report Indicating Workplace Diversity Slides PDF. The topics addressed in these templates are Applications, Workforce Recruitment Report, Indicating Workplace Diversity. All the content presented in this PPT design is completely editable. Download it and make adjustments in color, background, font etc. as per your unique business setting.
Community Development Strategy With Issue And Feasibility Indicator Template PDF
This slide presents community action plan with feasibility indicator, helpful in planning out tasks according to importance and feasibility. It includes collaboration, education, health, infrastructure and agriculture. Present the topic in a bit more detail with this Community Development Strategy With Issue And Feasibility Indicator Template PDF. Use it as a tool for discussion and navigation on Collaboration Coordination, Haman Capacity Building, Education Employment. This template is free to edit as deemed fit for your organization. Therefore download it now.

Dashboard Indicating Online Store Accounts Overview Introduction PDF
The following slide showcases ecommerce accounts management dashboard. It provides information about income, expenses, cash collected, cash spent, tax collected, tax claim, stock sold, invoice, etc. Presenting this PowerPoint presentation, titled Dashboard Indicating Online Store Accounts Overview Introduction PDF, with topics curated by our researchers after extensive research. This editable presentation is available for immediate download and provides attractive features when used. Download now and captivate your audience. Presenting this Dashboard Indicating Online Store Accounts Overview Introduction PDF. Our researchers have carefully researched and created these slides with all aspects taken into consideration. This is a completely customizable Dashboard Indicating Online Store Accounts Overview Introduction PDF that is available for immediate downloading. Download now and make an impact on your audience. Highlight the attractive features available with our PPTs.

Questionnaire Indicating Supplier Risk Assessment Of It Vendor Themes PDF
This slide showcases questionnaire indicating procurement risk assessment of information technology IT vendor. It contains information such as category, question reference, information security, data center security and web application security. Pitch your topic with ease and precision using this questionnaire indicating supplier risk assessment of it vendor themes pdf. This layout presents information on information security, data center security, web application security. It is also available for immediate download and adjustment. So, changes can be made in the color, design, graphics or any other component to create a unique layout.

Statistics Indicating Future Demand For Digital Insurance Technologies Brochure PDF
This slide illustrates data indicating future demand for insurtech digital technology. It provides information about data analytics, cloud technology, internal blockchain application, artificial intelligence, etc. Pitch your topic with ease and precision using this Statistics Indicating Future Demand For Digital Insurance Technologies Brochure PDF. This layout presents information on Data Analytics, Cloud Technology, Internal Blockchain Application. It is also available for immediate download and adjustment. So, changes can be made in the color, design, graphics or any other component to create a unique layout.

Graph Indicating Clinical Trial Phases Probability Of Success Infographics PDF
This slide compares and visually presents the success rate of each stage with preceding one of the clinical research procedures to represent the achievement of the drug efficacy objective of the firm.Deliver and pitch your topic in the best possible manner with this Graph Indicating Clinical Trial Phases Probability Of Success Infographics PDF Use them to share invaluable insights on Graph Indicating Clinical Trial Phases Probability Of Success and impress your audience. This template can be altered and modified as per your expectations. So, grab it now.

Key Statistics Indicating E Commerce Consumer Demand Professional PDF
This slide showcases key statistics indicating e commerce customer requirements which can be referred by them to identify certain issues and fix them with remedial solutions. It includes information about premium quality, cheap price, convenience, brand value, etc. Showcasing this set of slides titled Key Statistics Indicating E Commerce Consumer Demand Professional PDF. The topics addressed in these templates are E Commerce, Purchased, Product. All the content presented in this PPT design is completely editable. Download it and make adjustments in color, background, font etc. as per your unique business setting.

Timeline Indicating Performance Enhancement Plan For Workplace Efficiency Information PDF
This slide represents timeline indicating improvement plan for workplace efficiency which can benefit organizations in increasing productivity and performance yield of workforce. It includes information about improvement goals, current position of company, metrics to measure, feedback process, teamwork, organizing, etc. Showcasing this set of slides titled Timeline Indicating Performance Enhancement Plan For Workplace Efficiency Information PDF. The topics addressed in these templates are Teamwork, Process Development, Organizing Workplace. All the content presented in this PPT design is completely editable. Download it and make adjustments in color, background, font etc. as per your unique business setting.

Business Identity Dashboard Indicating Corporate Marketing Kpis Diagrams PDF
This slide shows business identity dashboard indicating brand marketing performance metrics. It contains details about brand metrics, advertisement metrics and purchase metrics. It also includes details from brand awareness to repeat purchase. Showcasing this set of slides titled Business Identity Dashboard Indicating Corporate Marketing Kpis Diagrams PDF. The topics addressed in these templates are Purchase, Engagement, Market Share. All the content presented in this PPT design is completely editable. Download it and make adjustments in color, background, font etc. as per your unique business setting.
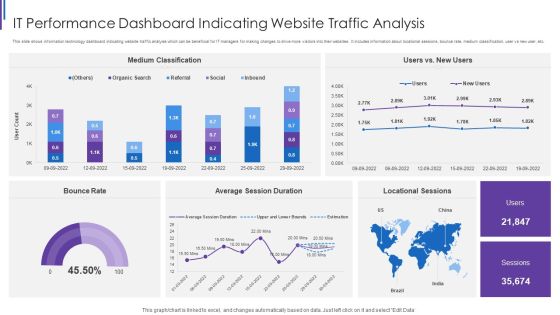
IT Performance Dashboard Indicating Website Traffic Analysis Background PDF
This slide shows information technology dashboard indicating website traffic analysis which can be beneficial for IT managers for making changes to drive more visitors into their websites. It includes information about locational sessions, bounce rate, medium classification, user vs new user, etc. Pitch your topic with ease and precision using this IT Performance Dashboard Indicating Website Traffic Analysis Background PDF. This layout presents information on Medium Classification Rate, Average Session Duration, Locational Sessions Bounce. It is also available for immediate download and adjustment. So, changes can be made in the color, design, graphics or any other component to create a unique layout.

TCM For Technical Analysis Dashboard Indicating Intervention Time Background PDF
This Slide shows technology change management dashboard indicating Change and Release Management which can be referred by It managers for effective handling of technical change. It includes information about operational, unassigned, overhead, hold, conflicts and rejected change. Showcasing this set of slides titled TCM For Technical Analysis Dashboard Indicating Intervention Time Background PDF. The topics addressed in these templates are Operational Change, Unassigned Changes, Change Overhead. All the content presented in this PPT design is completely editable. Download it and make adjustments in color, background, font etc. as per your unique business setting.

Key Performance Indicator Dashboard For Transportation Management Formats PDF
The following slide highlights key performance indicator dashboard for transportation management illustrating transportation cost, effectiveness, utilization and quality for last month and current month in America, Europe and Asia, it considers delivery and return cost, packing productivity and time, packing material cost and equipment utilization. Showcasing this set of slides titled Key Performance Indicator Dashboard For Transportation Management Formats PDF. The topics addressed in these templates are Transportation Cost, Effectiveness, Utilization, Quality. All the content presented in this PPT design is completely editable. Download it and make adjustments in color, background, font etc. as per your unique business setting.
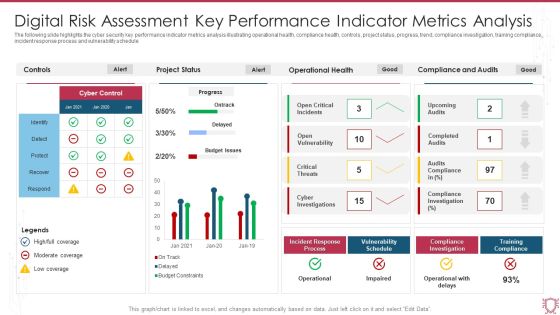
Digital Risk Assessment Key Performance Indicator Metrics Analysis Infographics PDF
The following slide highlights the cyber security key performance indicator metrics analysis illustrating operational health, compliance health, controls, project status, progress, trend, compliance investigation, training compliance, incident response process and vulnerability schedule. Showcasing this set of slides titled Digital Risk Assessment Key Performance Indicator Metrics Analysis Infographics PDF. The topics addressed in these templates are Project Status, Operational Health, Compliance And Audits. All the content presented in this PPT design is completely editable. Download it and make adjustments in color, background, font etc. as per your unique business setting.

Freelance Content Marketing Key Performance Indicator Metrics Slides PDF
The following slide highlights the freelance content marketing key performance indicator metrics. It shows kpi metrics including total sales, leads, conversion rate, membership, recommendation, retention, marketing roi, bounce rate and total visits to measure performance compared to benchmark. Pitch your topic with ease and precision using this Freelance Content Marketing Key Performance Indicator Metrics Slides PDF. This layout presents information on Total Sales, Conversion Rate, Bounce Rate. It is also available for immediate download and adjustment. So, changes can be made in the color, design, graphics or any other component to create a unique layout.

Potential Risk Factors Indicating Company Bankruptcy Brochure PDF
The following slide showcases the factors indicating towards firms insolvency. The factors covered are continued losses, inability to get funds from bank, unable to pay taxes, creditors demanding COD and legal problems. Persuade your audience using this Potential Risk Factors Indicating Company Bankruptcy Brochure PDF. This PPT design covers five stages, thus making it a great tool to use. It also caters to a variety of topics including Continued Losses, Creditors Demanding Cod, Legal Problems. Download this PPT design now to present a convincing pitch that not only emphasizes the topic but also showcases your presentation skills.
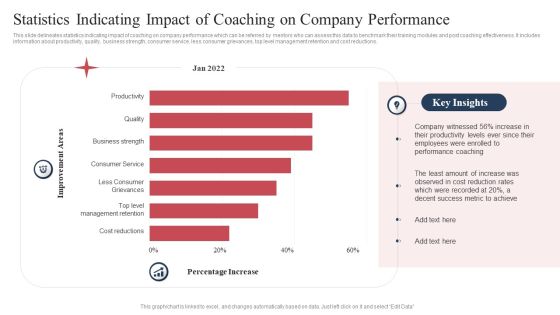
Statistics Indicating Impact Of Coaching On Company Performance Formats PDF
This slide delineates statistics indicating impact of coaching on company performance which can be referred by mentors who can assess this data to benchmark their training modules and post coaching effectiveness. It includes information about productivity, quality, business strength, consumer service, less consumer grievances, top level management retention and cost reductions. Pitch your topic with ease and precision using this Statistics Indicating Impact Of Coaching On Company Performance Formats PDF. This layout presents information on Productivity, Quality, Business Strength. It is also available for immediate download and adjustment. So, changes can be made in the color, design, graphics or any other component to create a unique layout.
Financial Procedure Dashboard Indicating Yearly Revenue Analysis Icons PDF
This slide illustrates finance process dashboard indicating yearly revenue analysis which contains gross profit margin, operating profit ratio, net profit, revenue and cost of goods sold cogs operating expenses, etc. It can be referred by company owners who can compare it with previous years performance and make related decisions for future. Showcasing this set of slides titled Financial Procedure Dashboard Indicating Yearly Revenue Analysis Icons PDF. The topics addressed in these templates are Operating Profit Percentage, Net Profit Percentage, Operating Profit Ratio. All the content presented in this PPT design is completely editable. Download it and make adjustments in color, background, font etc. as per your unique business setting.
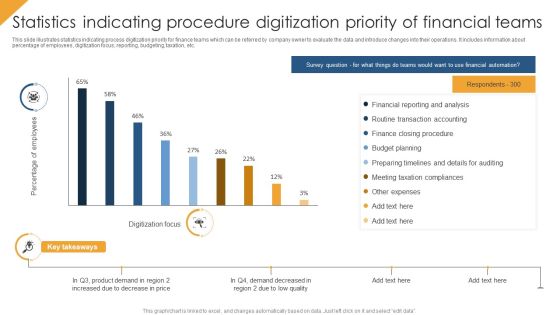
Statistics Indicating Procedure Digitization Priority Of Financial Teams Themes PDF
This slide illustrates statistics indicating process digitization priority for finance teams which can be referred by company owner to evaluate the data and introduce changes into their operations. It includes information about percentage of employees, digitization focus, reporting, budgeting, taxation, etc. Showcasing this set of slides titled Statistics Indicating Procedure Digitization Priority Of Financial Teams Themes PDF. The topics addressed in these templates are Budget Planning, Financial Reporting And Analysis, Other Expenses. All the content presented in this PPT design is completely editable. Download it and make adjustments in color, background, font etc. as per your unique business setting.

Evaluation Indicator Of Proposed Product Enhancement Strategy Guidelines PDF
This slide shows evaluation indicator of proposed product improvement plan. This involves details such as production, quality and safety levels along with volume of sales and net promoter score. It can help organizations in determining the effectiveness and overall profitability of alternatives decided to boost product sales. Showcasing this set of slides titled Evaluation Indicator Of Proposed Product Enhancement Strategy Guidelines PDF. The topics addressed in these templates are Production Level, Volume Of Sales, Net Promoter Score. All the content presented in this PPT design is completely editable. Download it and make adjustments in color, background, font etc. as per your unique business setting.

Data Mining Flowchart Indicating Customer Profiling Ppt Gallery Styles PDF
This slide showcase flowchart indicating customer profiling by using data mining which can assist companies in gathering reliable data to streamline the process of profiling. It contains details about individual data, regulations, professional, verification, mechanist, cancelled, approved and so on. Presenting Data Mining Flowchart Indicating Customer Profiling Ppt Gallery Styles PDF to dispense important information. This template comprises two stages. It also presents valuable insights into the topics including Cancelled Regulations, All Regulations, Approved Regulations. This is a completely customizable PowerPoint theme that can be put to use immediately. So, download it and address the topic impactfully.

Framework Indicating Unit Automated Testing Pyramid Ppt Styles Portfolio PDF
This slide shows framework indicating unit test automation pyramid which can be referred by IT firms which want to improve their services for developing user experiences. It contains information about graphical user interface GUI, approval tests, unit tests, element tests, frameworks, business and development oriented aspects. Presenting Framework Indicating Unit Automated Testing Pyramid Ppt Styles Portfolio PDF to dispense important information. This template comprises three stages. It also presents valuable insights into the topics including Business Oriented Aspects, Development Oriented Aspects, Test Automation Pyramid. This is a completely customizable PowerPoint theme that can be put to use immediately. So, download it and address the topic impactfully.
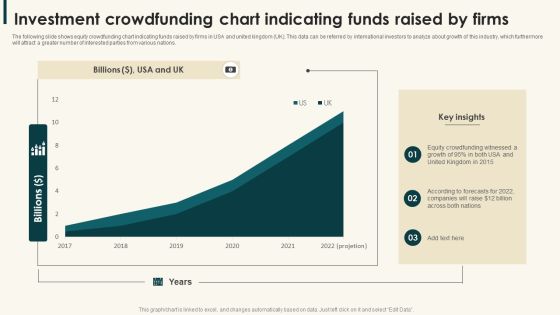
Investment Crowdfunding Chart Indicating Funds Raised By Firms Demonstration PDF
The following slide shows equity crowdfunding chart indicating funds raised by firms in USA and united kingdom UK. This data can be referred by international investors to analyze about growth of this industry, which furthermore will attract a greater number of interested parties from various nations.Showcasing this set of slides titled Investment Crowdfunding Chart Indicating Funds Raised By Firms Demonstration PDF. The topics addressed in these templates are Crowdfunding Witnessed, United Kingdom, Companies Raise. All the content presented in this PPT design is completely editable. Download it and make adjustments in color, background, font etc. as per your unique business setting.

Share Portfolio Tracking Sheet To Analyze Market Indices Themes PDF
Following slide showcases portfolio tracking sheet to analyze stock market performance. This slide provides information about total number of shares purchased, price at which share bought, total cost, current market value of share, etc. Pitch your topic with ease and precision using this Share Portfolio Tracking Sheet To Analyze Market Indices Themes PDF. This layout presents information on Share Portfolio, Tracking Sheet, Market Indices. It is also available for immediate download and adjustment. So, changes can be made in the color, design, graphics or any other component to create a unique layout.

Signs Indicating Tail End Cost In Business Demonstration PDF
This slide presents signs that indicate presence of tail spends in business helpful in identifying barriers to cost efficiency and providing solutions for same. It includes mismatch of ERP, sourcing data hidden in email, too much stock holding that should be treated on priority basis. Persuade your audience using this Signs Indicating Tail End Cost In Business Demonstration PDF. This PPT design covers three stages, thus making it a great tool to use. It also caters to a variety of topics including Stocks, Resource, Supplier. Download this PPT design now to present a convincing pitch that not only emphasizes the topic but also showcases your presentation skills.
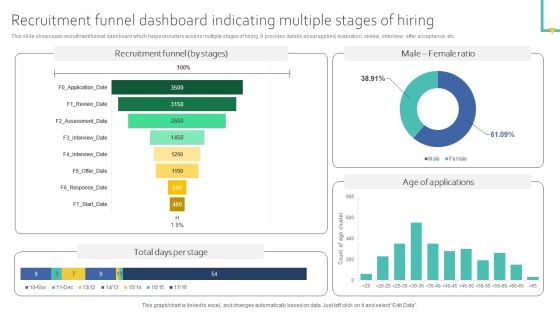
Recruitment Funnel Dashboard Indicating Multiple Stages Of Hiring Ideas PDF
This slide showcases recruitment funnel dashboard which helps recruiters access multiple stages of hiring. It provides details about applied, evaluation, review, interview, offer acceptance, etc. Get a simple yet stunning designed Recruitment Funnel Dashboard Indicating Multiple Stages Of Hiring Ideas PDF. It is the best one to establish the tone in your meetings. It is an excellent way to make your presentations highly effective. So, download this PPT today from Slidegeeks and see the positive impacts. Our easy to edit Recruitment Funnel Dashboard Indicating Multiple Stages Of Hiring Ideas PDF can be your go to option for all upcoming conferences and meetings. So, what are you waiting for Grab this template today.
Sales By Lead Source Performance Indicator Ppt Icon Images PDF
Explore a selection of the finest Sales By Lead Source Performance Indicator Ppt Icon Images PDF here. With a plethora of professionally designed and pre made slide templates, you can quickly and easily find the right one for your upcoming presentation. You can use our Sales By Lead Source Performance Indicator Ppt Icon Images PDF to effectively convey your message to a wider audience. Slidegeeks has done a lot of research before preparing these presentation templates. The content can be personalized and the slides are highly editable. Grab templates today from Slidegeeks.

Customer Lifetime Value Indication Bar Chart Ppt Samples
This is a customer lifetime value indication bar chart ppt samples. This is a three stage process. The stages in this process are inactive nonprofit able customer, active profitable customers, very active very profitable customers, lifetime value, average order value, number of repeat sales, average retention time.
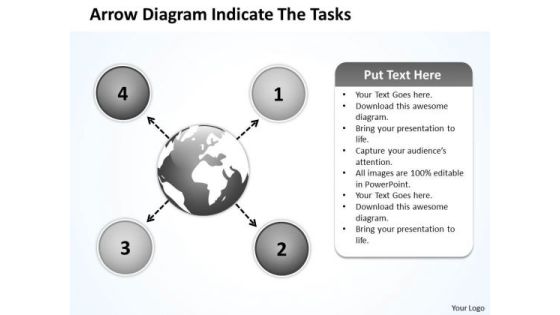
Arrow Diagram Indicate The Tasks Ppt Charts And PowerPoint Templates
We present our arrow diagram indicate the tasks ppt Charts and PowerPoint templates.Use our Process and Flows PowerPoint Templates because a lot of hard work has gone in and you are almost there. Download our Arrows PowerPoint Templates because you have the ideas, you have got a brainwave. Use our Business PowerPoint Templates because your thoughts are pointed and sharp as arrows. Download our Circle Charts PowerPoint Templates because you can Show them how you can save the day. Present our Flow Charts PowerPoint Templates because you have some excellent plans to spread some more of it across your community.Use these PowerPoint slides for presentations relating to Arrows, choice, connect, design, direction, flows, four, info graph, instruction, layout, manual, marketing, modern, one, option, order, page, paper, pointing, process, product, promotion, sequence, simple, special, step, symbol. The prominent colors used in the PowerPoint template are Black, White, Gray. Presenters tell us our arrow diagram indicate the tasks ppt Charts and PowerPoint templates will help them to explain complicated concepts. Professionals tell us our flows PowerPoint templates and PPT Slides are Enchanting. PowerPoint presentation experts tell us our arrow diagram indicate the tasks ppt Charts and PowerPoint templates are effectively colour coded to prioritise your plans They automatically highlight the sequence of events you desire. The feedback we get is that our four PowerPoint templates and PPT Slides are Beautiful. Use our arrow diagram indicate the tasks ppt Charts and PowerPoint templates are Efficient. Use our connect PowerPoint templates and PPT Slides are Ultra.
Drug Indicator Extension In A Pharmaceuticals Company Location Formats PDF
This is a drug indicator extension in a pharmaceuticals company location formats pdf template with various stages. Focus and dispense information on five stages using this creative set, that comes with editable features. It contains large content boxes to add your information on topics like location. You can also showcase facts, figures, and other relevant content using this PPT layout. Grab it now.
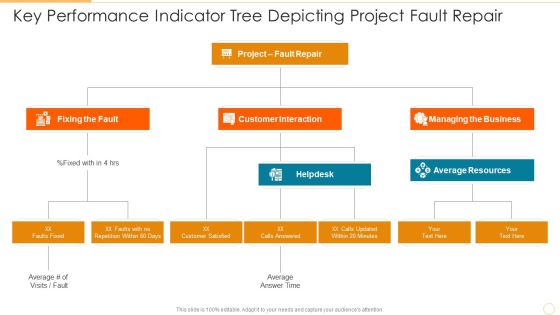
Key Performance Indicator Tree Depicting Project Fault Repair Diagrams PDF
Presenting key performance indicator tree depicting project fault repair diagrams pdf to dispense important information. This template comprises three stages. It also presents valuable insights into the topics including customer interaction, managing the business, fixing the fault. This is a completely customizable PowerPoint theme that can be put to use immediately. So, download it and address the topic impactfully.
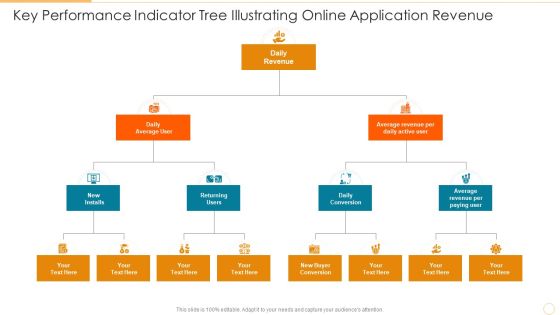
Key Performance Indicator Tree Illustrating Online Application Revenue Download PDF
Presenting key performance indicator tree illustrating online application revenue download pdf to dispense important information. This template comprises three stages. It also presents valuable insights into the topics including daily conversion, returning users, daily revenue. This is a completely customizable PowerPoint theme that can be put to use immediately. So, download it and address the topic impactfully.

Financial Statement Indicating Company Book Value Mockup PDF
Showcasing this set of slides titled financial statement indicating company book value mockup pdf. The topics addressed in these templates are book value statement, assets, liabilities. All the content presented in this PPT design is completely editable. Download it and make adjustments in color, background, font etc. as per your unique business setting.

Corporate Identity Icon Indicating Business Card And Letterhead Diagrams PDF
Presenting Corporate Identity Icon Indicating Business Card And Letterhead Diagrams PDF to dispense important information. This template comprises four stages. It also presents valuable insights into the topics including Business, Letterhead, Corporate. This is a completely customizable PowerPoint theme that can be put to use immediately. So, download it and address the topic impactfully.

Analysis Architecture Indicating Business Impact On Economic Development Background PDF
Pitch your topic with ease and precision using this Analysis Architecture Indicating Business Impact On Economic Development Background PDF. This layout presents information on Profitability Increases, Economy Witnesses, Existing Businesses. It is also available for immediate download and adjustment. So, changes can be made in the color, design, graphics or any other component to create a unique layout.

2023 Business Calendar Indicating Business Meeting Agenda Download PDF
Presenting 2023 Business Calendar Indicating Business Meeting Agenda Download PDF to dispense important information. This template comprises tweleve stages. It also presents valuable insights into the topics including Marketing Meeting, Market Opportunities, Check Goal Status. This is a completely customizable PowerPoint theme that can be put to use immediately. So, download it and address the topic impactfully.

2023 Business Calendar Indicating Project Management Planning Brochure PDF
Presenting 2023 Business Calendar Indicating Project Management Planning Brochure PDF to dispense important information. This template comprises one stages. It also presents valuable insights into the topics including Design Specifications, Finalize Budget Report, Develop Cost. This is a completely customizable PowerPoint theme that can be put to use immediately. So, download it and address the topic impactfully.
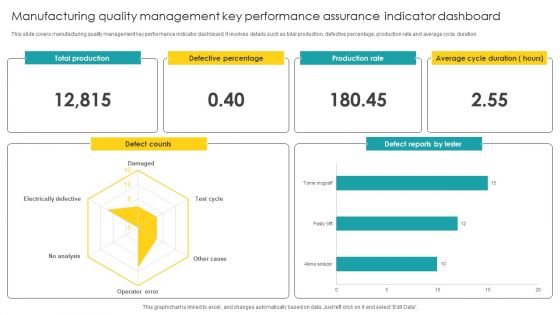
Manufacturing Quality Management Key Performance Assurance Indicator Dashboard Microsoft PDF
Pitch your topic with ease and precision using this Manufacturing Quality Management Key Performance Assurance Indicator Dashboard Microsoft PDF. This layout presents information on Quality Management, Key Performance Assurance. It is also available for immediate download and adjustment. So, changes can be made in the color, design, graphics or any other component to create a unique layout.

Asset Assessment Dashboard Indicating Revenue And Productivity Infographics PDF
This slide showcases asset valuation dashboard highlighting company revenue and productivity index. It provides information about geographical evaluation, development cost, commercial cost, etc.Pitch your topic with ease and precision using this Asset Assessment Dashboard Indicating Revenue And Productivity Infographics PDF. This layout presents information on Projected Development, Productivity Index, Geographical Evaluation. It is also available for immediate download and adjustment. So, changes can be made in the color, design, graphics or any other component to create a unique layout.

Framework Indicating Bdd Automated Testing Design Ppt Gallery Ideas PDF
This slide showcase framework indicating BDD test automation design which can be referred by analysts who want to streamline the process of making changes in the system through advanced methods. It includes information about product owners, business analysts, self service catalogue, database, files, mainframe, developers, etc. Persuade your audience using this Framework Indicating Bdd Automated Testing Design Ppt Gallery Ideas PDF. This PPT design covers four stages, thus making it a great tool to use. It also caters to a variety of topics including Example Data, Data Table, Product Owners, Business Analysts. Download this PPT design now to present a convincing pitch that not only emphasizes the topic but also showcases your presentation skills.

Vehicle Maintenance Dashboard Indicating Trips And Compliances Structure PDF
This slide showcases dashboard which can help fleet managers in carefully monitoring their vehicle status. It provides details about vehicle conditions, free vehicles, moving vehicles, insurance, permit, license validity, trip alerts, etc. Here you can discover an assortment of the finest PowerPoint and Google Slides templates. With these templates, you can create presentations for a variety of purposes while simultaneously providing your audience with an eye-catching visual experience. Download Vehicle Maintenance Dashboard Indicating Trips And Compliances Structure PDF to deliver an impeccable presentation. These templates will make your job of preparing presentations much quicker, yet still, maintain a high level of quality. Slidegeeks has experienced researchers who prepare these templates and write high-quality content for you. Later on, you can personalize the content by editing the Vehicle Maintenance Dashboard Indicating Trips And Compliances Structure PDF.
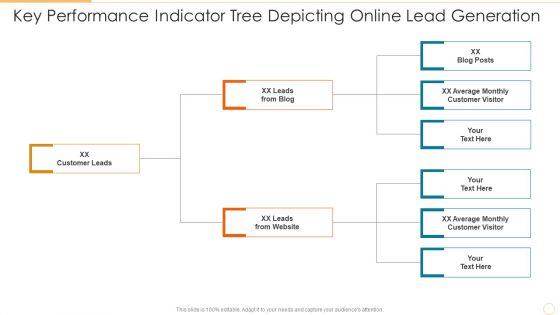
Key Performance Indicator Tree Depicting Online Lead Generation Information PDF
Persuade your audience using this key performance indicator tree depicting online lead generation information pdf. This PPT design covers three stages, thus making it a great tool to use. It also caters to a variety of topics including customer leads, leads from blog, leads from website. Download this PPT design now to present a convincing pitch that not only emphasizes the topic but also showcases your presentation skills.

Key Performance Indicator Tree For Application Performance Management Background PDF
Persuade your audience using this key performance indicator tree for application performance management background pdf. This PPT design covers six stages, thus making it a great tool to use. It also caters to a variety of topics including collaboration platforms, competency development, knowledge management programmers. Download this PPT design now to present a convincing pitch that not only emphasizes the topic but also showcases your presentation skills.
Project Key Performance Indicator Tree Illustrating Customer Satisfaction Icons PDF
Persuade your audience using this project key performance indicator tree illustrating customer satisfaction icons pdf. This PPT design covers four stages, thus making it a great tool to use. It also caters to a variety of topics including total customer complaints, total customer notifications, customer satisfaction project. Download this PPT design now to present a convincing pitch that not only emphasizes the topic but also showcases your presentation skills.

Digital Dashboard Indicating Insurance Agent Sales Performance Portrait PDF
This slide illustrates insurance agent sales performance digital dashboard. It provides information about total proposals, policies, accident, claims, sales revenue, rewards, etc. Pitch your topic with ease and precision using this Digital Dashboard Indicating Insurance Agent Sales Performance Portrait PDF. This layout presents information on Sales Revenue, Reward And Recognition. It is also available for immediate download and adjustment. So, changes can be made in the color, design, graphics or any other component to create a unique layout.
HR Dashboard Indicating Weekly Professional Counselling Kpis Icons PDF
This slide illustrates HR career counselling dashboard. It provides information about hours of consultation, satisfaction rate, per consultant rate, popular counselors, etc. Showcasing this set of slides titled HR Dashboard Indicating Weekly Professional Counselling Kpis Icons PDF. The topics addressed in these templates are Specialization, Hours Of Consultation, Popular Counselors. All the content presented in this PPT design is completely editable. Download it and make adjustments in color, background, font etc. as per your unique business setting.

Finance Metrics Dashboard Indicating Portfolio Performance Microsoft PDF
This graph or chart is linked to excel, and changes automatically based on data. Just left click on it and select edit data. Pitch your topic with ease and precision using this Finance Metrics Dashboard Indicating Portfolio Performance Microsoft PDF. This layout presents information on Portfolio Performance Portfolio, Asset Management Manager, Top 10 Assets. It is also available for immediate download and adjustment. So, changes can be made in the color, design, graphics or any other component to create a unique layout.
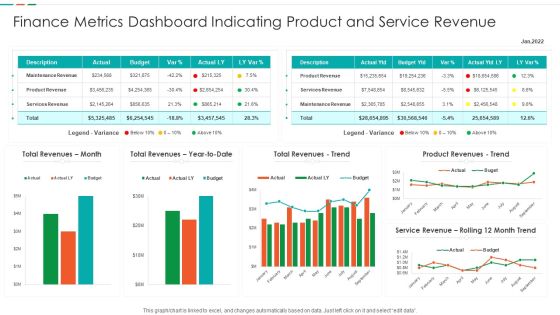
Finance Metrics Dashboard Indicating Product And Service Revenue Designs PDF
This graph or chart is linked to excel, and changes automatically based on data. Just left click on it and select edit data. Showcasing this set of slides titled Finance Metrics Dashboard Indicating Product And Service Revenue Designs PDF. The topics addressed in these templates are Maintenance Revenue Product, Revenue Product Revenues, Service Revenue Rolling. All the content presented in this PPT design is completely editable. Download it and make adjustments in color, background, font etc. as per your unique business setting.

Finance Metrics Dashboard Indicating Short Term Assets Download PDF
This graph or chart is linked to excel, and changes automatically based on data. Just left click on it and select edit data. Pitch your topic with ease and precision using this Finance Metrics Dashboard Indicating Short Term Assets Download PDF. This layout presents information on Short Term Assets, Global Financial Performance, Revenue YTD 2022. It is also available for immediate download and adjustment. So, changes can be made in the color, design, graphics or any other component to create a unique layout.
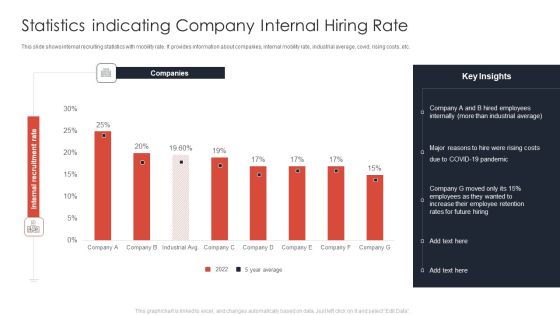
Statistics Indicating Company Internal Hiring Rate Ppt Ideas Templates PDF
This slide shows internal recruiting statistics with mobility rate. It provides information about companies, internal mobility rate, industrial average, covid, rising costs, etc. Showcasing this set of slides titled Statistics Indicating Company Internal Hiring Rate Ppt Ideas Templates PDF. The topics addressed in these templates are Companies, Employees Internally, COVID 19 Pandemic. All the content presented in this PPT design is completely editable. Download it and make adjustments in color, background, font etc. as per your unique business setting.
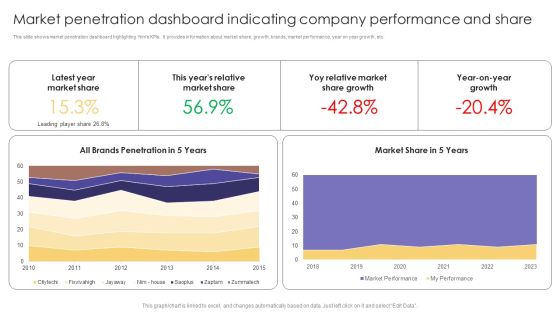
Market Penetration Dashboard Indicating Company Performance And Share Formats PDF
This slide shows market penetration dashboard highlighting firms KPIs. It provides information about market share, growth, brands, market performance, year on year growth, etc. Showcasing this set of slides titled Market Penetration Dashboard Indicating Company Performance And Share Formats PDF. The topics addressed in these templates are Latest Year, Market Share, Market Share Growth. All the content presented in this PPT design is completely editable. Download it and make adjustments in color, background, font etc. as per your unique business setting.
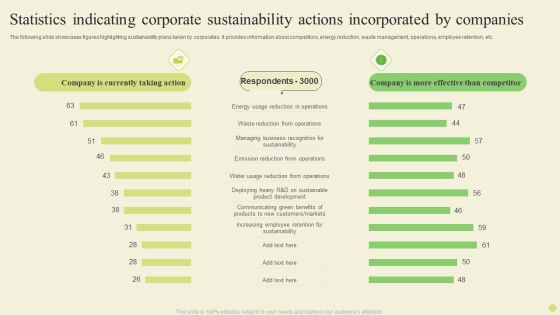
Statistics Indicating Corporate Sustainability Actions Incorporated By Companies Diagrams PDF
The following slide showcases figures highlighting sustainability plans taken by corporates. It provides information about competitors, energy reduction, waste management, operations, employee retention, etc.Pitch your topic with ease and precision using this Statistics Indicating Corporate Sustainability Actions Incorporated By Companies Diagrams PDF. This layout presents information on Energy Reduction, Emission Reduction, Increasing Employee. It is also available for immediate download and adjustment. So, changes can be made in the color, design, graphics or any other component to create a unique layout.

Leadership Effectiveness Framework Indicating Employee Behaviors Elements PDF
This slide showcases the framework containing key leadership behaviors for getting growth in the business. It includes organize, innovate, connect, enjoy and voice. Presenting Leadership Effectiveness Framework Indicating Employee Behaviors Elements PDF to dispense important information. This template comprises five stages. It also presents valuable insights into the topics including Organize, Innovate, Connect, Enjoy, Voice. This is a completely customizable PowerPoint theme that can be put to use immediately. So, download it and address the topic impactfully.
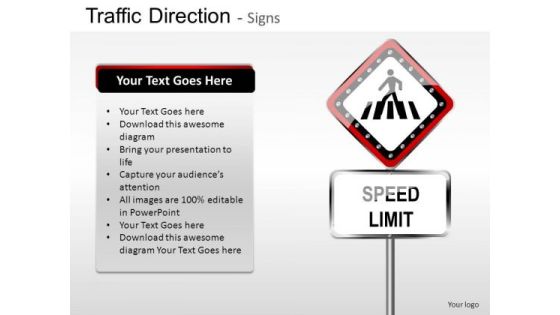
Indication Traffic Direction PowerPoint Slides And Ppt Diagram Templates
Indication Traffic Direction PowerPoint Slides And PPT Diagram Templates-These high quality powerpoint pre-designed slides and powerpoint templates have been carefully created by our professional team to help you impress your audience. All slides have been created and are 100% editable in powerpoint. Each and every property of any graphic - color, size, orientation, shading, outline etc. can be modified to help you build an effective powerpoint presentation. Any text can be entered at any point in the powerpoint template or slide. Simply DOWNLOAD, TYPE and PRESENT!
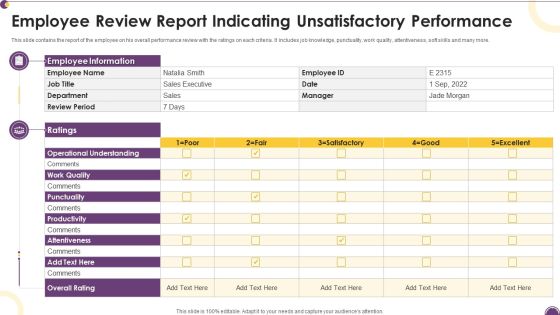
Employee Review Report Indicating Unsatisfactory Performance Themes PDF
This slide contains the report of the employee on his overall performance review with the ratings on each criteria. It includes job knowledge, punctuality, work quality, attentiveness, soft skills and many more.Pitch your topic with ease and precision using this Employee Review Report Indicating Unsatisfactory Performance Themes PDF. This layout presents information on Operational Understanding, Employee Information, Punctuality. It is also available for immediate download and adjustment. So, changes can be made in the color, design, graphics or any other component to create a unique layout.

Yearly Sales Assessment With Key Performance Indicator Matrix Introduction PDF
This slide covers quarterly product units sold through out a financial year in an organization with growth in revenue, profit and number of customer from previous years sales. It includes product sold and growth rate. Presenting Yearly Sales Assessment With Key Performance Indicator Matrix Introduction PDF to dispense important information. This template comprises four stages. It also presents valuable insights into the topics including Sold Growth Rate, Customers, Growth In Profit. This is a completely customizable PowerPoint theme that can be put to use immediately. So, download it and address the topic impactfully.

Business Expansion Geography Indicating Market Size Inspiration PDF
The slide demonstrates market size geography to identify potential areas to expand business. The slides includes a geographical map representing areas of market expansion. Persuade your audience using this Business Expansion Geography Indicating Market Size Inspiration PDF. This PPT design covers four stages, thus making it a great tool to use. It also caters to a variety of topics including Potential Markets, Business Expansion, Growth Opportunities. Download this PPT design now to present a convincing pitch that not only emphasizes the topic but also showcases your presentation skills.

B2C Content Marketing Statistics Indicating Usage Of Techniques Sample PDF
This slide showcases business to consumer B2C content marketing figures highlighting usage of key strategies. It provides information about targeting, editorial calendar, promotion, website UI, social media, service development, etc. Pitch your topic with ease and precision using this B2C Content Marketing Statistics Indicating Usage Of Techniques Sample PDF. This layout presents information on Strategies, Marketers, Content Team. It is also available for immediate download and adjustment. So, changes can be made in the color, design, graphics or any other component to create a unique layout.
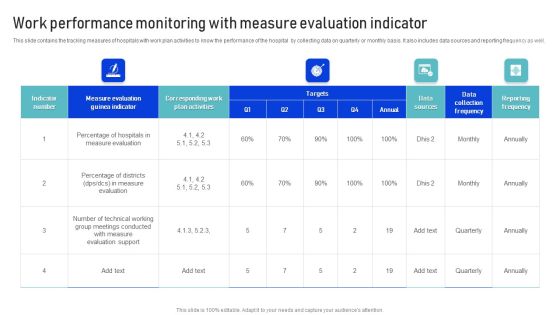
Work Performance Monitoring With Measure Evaluation Indicator Download PDF
This slide contains the tracking measures of hospitals with work plan activities to know the performance of the hospital by collecting data on quarterly or monthly basis. It also includes data sources and reporting frequency as well. Pitch your topic with ease and precision using this Work Performance Monitoring With Measure Evaluation Indicator Download PDF. This layout presents information on Measure Evaluation, Targets, Work Performance Monitoring. It is also available for immediate download and adjustment. So, changes can be made in the color, design, graphics or any other component to create a unique layout.
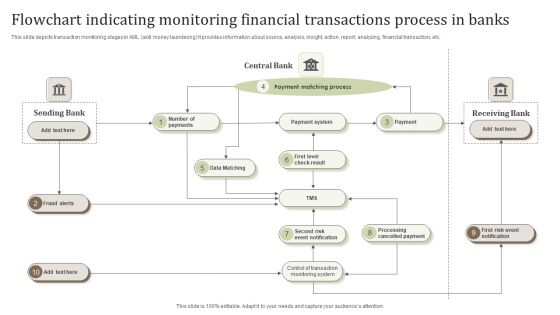
Flowchart Indicating Monitoring Financial Transactions Process In Banks Pictures PDF
This slide depicts transaction monitoring stages in AML anti money laundering It provides information about source, analysis, insight, action, report, analyzing, financial transaction, etc.Persuade your audience using this Flowchart Indicating Monitoring Financial Transactions Process In Banks Pictures PDF. This PPT design covers one stage, thus making it a great tool to use. It also caters to a variety of topics including Payment Matching Process, Cancelled Payment, Cancelled Payment. Download this PPT design now to present a convincing pitch that not only emphasizes the topic but also showcases your presentation skills.
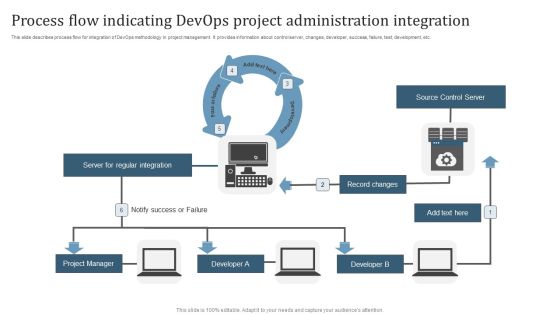
Process Flow Indicating Devops Project Administration Integration Microsoft PDF
This slide describes process flow for integration of DevOps methodology in project management. It provides information about control server, changes, developer, success, failure, test, development, etc. Presenting Process Flow Indicating Devops Project Administration Integration Microsoft PDF to dispense important information. This template comprises three stages. It also presents valuable insights into the topics including Server For Regular Integration, Source Control Server, Record Changes. This is a completely customizable PowerPoint theme that can be put to use immediately. So, download it and address the topic impactfully.

Share Market Dashboard Indicating Candlestick Time Series Formats PDF
Following slide showcase stock market KPI dashboard which will assist company to understand stock performance. It provides information about open, close, highest and lowest price of stock on particular day, candlestick time series etc. Pitch your topic with ease and precision using this Share Market Dashboard Indicating Candlestick Time Series Formats PDF. This layout presents information on Candlestick Time Series, Stock Change, US Sector. It is also available for immediate download and adjustment. So, changes can be made in the color, design, graphics or any other component to create a unique layout.
Sales By Lead Source Performance Indicator Icons PDF
Are you in need of a template that can accommodate all of your creative concepts This one is crafted professionally and can be altered to fit any style. Use it with Google Slides or PowerPoint. Include striking photographs, symbols, depictions, and other visuals. Fill, move around, or remove text boxes as desired. Test out color palettes and font mixtures. Edit and save your work, or work with colleagues. Download Sales By Lead Source Performance Indicator Icons PDF and observe how to make your presentation outstanding. Give an impeccable presentation to your group and make your presentation unforgettable.

Stoplight Traffic Signal Go Indication Ppt PowerPoint Presentation Complete Deck
This stoplight traffic signal go indication ppt powerpoint presentation complete deck acts as backup support for your ideas, vision, thoughts, etc. Use it to present a thorough understanding of the topic. This PPT slideshow can be utilized for both in-house and outside presentations depending upon your needs and business demands. Entailing twelve slides with a consistent design and theme, this template will make a solid use case. As it is intuitively designed, it suits every business vertical and industry. All you have to do is make a few tweaks in the content or any other component to design unique presentations. The biggest advantage of this complete deck is that it can be personalized multiple times once downloaded. The color, design, shapes, and other elements are free to modify to add personal touches. You can also insert your logo design in this PPT layout. Therefore a well-thought and crafted presentation can be delivered with ease and precision by downloading this stoplight traffic signal go indication ppt powerpoint presentation complete deck PPT slideshow.

Progress Indicator Ring Ppt PowerPoint Presentation Complete Deck With Slides
This progress indicator ring ppt powerpoint presentation complete deck with slides acts as backup support for your ideas, vision, thoughts, etc. Use it to present a thorough understanding of the topic. This PPT slideshow can be utilized for both in-house and outside presentations depending upon your needs and business demands. Entailing twelve slides with a consistent design and theme, this template will make a solid use case. As it is intuitively designed, it suits every business vertical and industry. All you have to do is make a few tweaks in the content or any other component to design unique presentations. The biggest advantage of this complete deck is that it can be personalized multiple times once downloaded. The color, design, shapes, and other elements are free to modify to add personal touches. You can also insert your logo design in this PPT layout. Therefore a well-thought and crafted presentation can be delivered with ease and precision by downloading this progress indicator ring ppt powerpoint presentation complete deck with slides PPT slideshow.
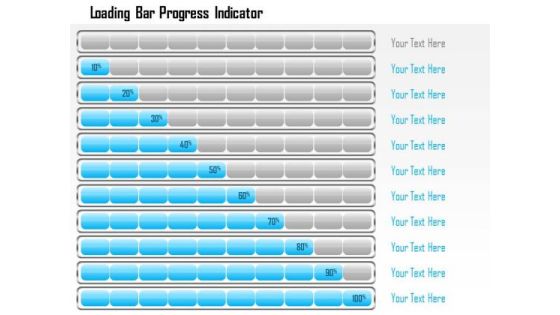
Business Framework Loading Bar Progress Indicator PowerPoint Presentation
This business diagram displays bar progress indicators. This business slide contains the concept of business growth shown in multiple levels. Use this diagram to present and compare data in an impressive manner.

Dashboard With Low High Medium Indication Powerpoint Slides
This innovative, stunningly beautiful dashboard has been designed for data visualization. It contains dashboard with low, high and medium indication. This PowerPoint template helps to display your information in a useful, simple and orderly way.

Business Diagram Pie Chart With Key Performance Indicator Presentation Template
This power point template slide has been crafted with graphic of pie chart and magnifier. This PPT contains the concept of performance indication. Use this PPT for data technology and business related presentations.

Stock Photo Arrow Indicating Solution Path Of Maze Pwerpoint Slide
This conceptual image is designed with graphic of maze and arrow. In this image maze shows the concept of problem while arrow is reflecting the idea of solution. Build a innovative presentation for displaying the complexity of problem solving topic. Use this image for business, sales and marketing related presentations.

Business Diagram Multiple Cells For Charging Indication Diagram Presentation Template
Graphic of multiple cells is used to decorate this power point template slide. This PPt slide contains the concept of charging and power consumption. Use this PPT slide and explain these topics in a graphical manner.

Business Diagram Danger Warning Symbol For Safety Indication Presentation Template
This Power Point template has been designed with graphic of danger board. This diagram contains the concept of safety warning for danger area. Use this diagram for your warning and safety related presentation.
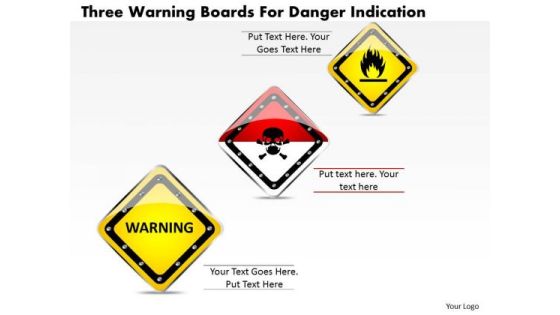
Business Diagram Three Warning Boards For Danger Indication Presentation Template
This Power Point image template has been designed with graphic of three different sign boards. These signs are designed to identify dangerous places. Use this diagram for safety and prevention related topics.

Business Diagram Human Hand Indicating On Multiple Apps PowerPoint Template
Graphic of human hand with multiple apps has been used to craft this PPT. This PPT diagram contains the concept of app usage. Use this PPT for your technology and data related topics in any presentation.

Business Diagram Thermometer Graphics Indicating Progress Presentation Template
This power point template diagram has been designed with graphic of thermometer and bar graph. This PPT contains the concept of growth analysis. Use this PPT for business and marketing related presentations.
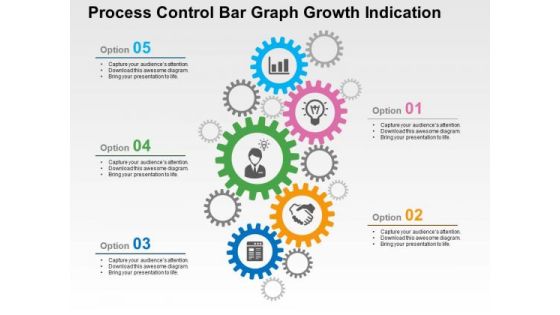
Process Control Bar Graph Growth Indication PowerPoint Template
Download our business slide with gear graphics to convincingly convey your important ideas in presentations. It also contains graphics of business icons. Create captivating presentations using this template

Eight Tags For Business Process Indication Powerpoint Template
Our above PPT slide contains graphics of eight text tags with icons. This PowerPoint template may be used to display business process steps. Use this diagram to impart more clarity to data and to create more sound impact on viewers.
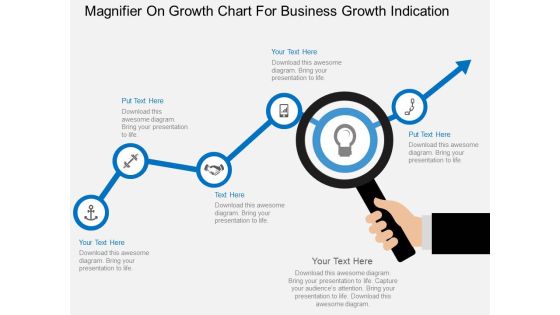
Magnifier On Growth Chart For Business Growth Indication Powerpoint Template
This business slide contains graphics of magnifier on growth chart. This PowerPoint template helps to display business planning and analysis. Use this diagram to impart more clarity to concept and to create more sound impact on viewers.

Plant With Bulb Education Growth Indication Powerpoint Template
This PowerPoint slide has been designed with graphics of plant and bulb. This diagram is designed to display education and growth. This professional slide helps in making an instant impact on viewers.

Three Arrows For Business Process Indication Powerpoint Template
This business slide displays diagram of three arrows with icons. Download this diagram to display information in visual manner. Visual effect of this diagram helps in maintaining the flow of the discussion and provides more clarity to the subject.

Aviation Fuel Biofuel Impact Indicator Matrix For Environmental Sustainability Graphics PDF
This slide covers impact matrix to show direct effect of sustainable aviation fuel on several environment indicators. It includes indicators such as energy usage, greenhouse gases, air quality index, biodiversity, use of land, water quality, etc. Showcasing this set of slides titled Aviation Fuel Biofuel Impact Indicator Matrix For Environmental Sustainability Graphics PDF. The topics addressed in these templates are Energy Usage, Greenhouse Gases, Air Quality Index. All the content presented in this PPT design is completely editable. Download it and make adjustments in color, background, font etc. as per your unique business setting.
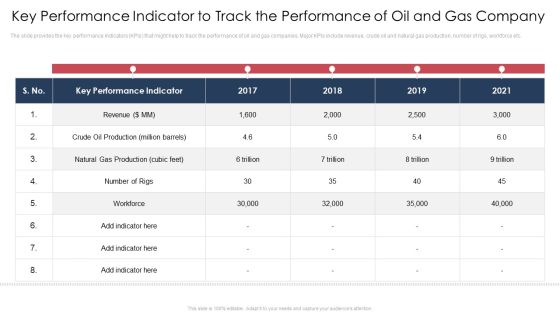
Key Performance Indicator To Track The Performance Of Oil And Gas Company Slides PDF
The slide provides the key performance indicators KPIs that might help to track the performance of oil and gas companies. Major KPIs include revenue, crude oil and natural gas production, number of rigs, workforce etc.Deliver and pitch your topic in the best possible manner with this key performance indicator to track the performance of oil and gas company slides pdf. Use them to share invaluable insights on revenue, crude oil production, natural gas production and impress your audience. This template can be altered and modified as per your expectations. So, grab it now.

Cyber Risk Report With Risk Indicator And Affected Systems Brochure PDF
This slide highlights the cyber threat risk indicator which include risk level, risk indication, likelihood, impacts and potential affected system. Pitch your topic with ease and precision using this cyber risk report with risk indicator and affected systems brochure pdf. This layout presents information on risk indication, risk level, key risk indicator. It is also available for immediate download and adjustment. So, changes can be made in the color, design, graphics or any other component to create a unique layout.
 Home
Home