Indicators

Sales By Lead Source Performance Indicator Ppt Pictures Graphics Template PDF
Explore a selection of the finest Sales By Lead Source Performance Indicator Ppt Pictures Graphics Template PDF here. With a plethora of professionally designed and pre made slide templates, you can quickly and easily find the right one for your upcoming presentation. You can use our Sales By Lead Source Performance Indicator Ppt Pictures Graphics Template PDF to effectively convey your message to a wider audience. Slidegeeks has done a lot of research before preparing these presentation templates. The content can be personalized and the slides are highly editable. Grab templates today from Slidegeeks.

Availability Key Performance Indicator Inventory Turnover Ratio Ppt PowerPoint Presentation Icon Themes
Presenting this set of slides with name availability key performance indicator inventory turnover ratio ppt powerpoint presentation icon themes. The topics discussed in these slides are availability kpi, availability dashboard, availability metrics. This is a completely editable PowerPoint presentation and is available for immediate download. Download now and impress your audience.
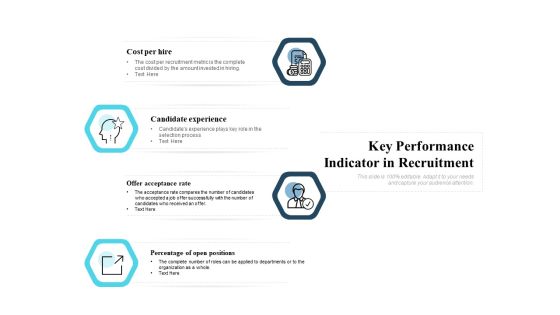
Key Performance Indicator In Recruitment Ppt PowerPoint Presentation Show Graphic Tips
Presenting this set of slides with name key performance indicator in recruitment ppt powerpoint presentation show graphic tips. This is a four stage process. The stages in this process are cost per hire, candidate experience, offer acceptance rate, percentage of open positions. This is a completely editable PowerPoint presentation and is available for immediate download. Download now and impress your audience.

Business Growth Matrix Indicating Monthly Summary Ppt PowerPoint Presentation Summary Structure PDF
Presenting this set of slides with name business growth matrix indicating monthly summary ppt powerpoint presentation summary structure pdf. The topics discussed in these slides are sales rep, new opportunity prospecting, won, closed lost. This is a completely editable PowerPoint presentation and is available for immediate download. Download now and impress your audience.

Chart Indicating Actual Vs Forecasted Gap Analysis Ppt PowerPoint Presentation Gallery Slides PDF
Presenting this set of slides with name chart indicating actual vs forecasted gap analysis ppt powerpoint presentation gallery slides pdf. The topics discussed in these slides are sales, target, revenue. This is a completely editable PowerPoint presentation and is available for immediate download. Download now and impress your audience.

Chart Indicating Business Cost Of Sales And Revenue Ppt PowerPoint Presentation File Gridlines PDF
Presenting this set of slides with name chart indicating business cost of sales and revenue ppt powerpoint presentation file gridlines pdf. The topics discussed in these slides are revenue, operating, assets. This is a completely editable PowerPoint presentation and is available for immediate download. Download now and impress your audience.
Statistics Chart Indicating RD Expenditure Ppt PowerPoint Presentation Icon Example PDF
Presenting this set of slides with name statistics chart indicating rd expenditure ppt powerpoint presentation icon example pdf. The topics discussed in these slides are revenue, expenditure, competitor. This is a completely editable PowerPoint presentation and is available for immediate download. Download now and impress your audience.

TCM Balanced Scorecard Indicator Vision Goal And Strategy Ppt Infographic Template Ideas PDF
Presenting this set of slides with name tcm balanced scorecard indicator vision goal and strategy ppt infographic template ideas pdf. The topics discussed in these slides are financial, target, growth, process. This is a completely editable PowerPoint presentation and is available for immediate download. Download now and impress your audience.
Expenditure Administration Balanced Scorecard Indicator Vision Goal And Strategy Ppt Icon Background PDF
Presenting this set of slides with name expenditure administration balanced scorecard indicator vision goal and strategy ppt icon background pdf. The topics discussed in these slides are financial, target, growth, process. This is a completely editable PowerPoint presentation and is available for immediate download. Download now and impress your audience.

Chart Indicating Vendors Product Price Comparison Ppt PowerPoint Presentation Portfolio Infographics PDF
Showcasing this set of slides titled chart indicating vendors product price comparison ppt powerpoint presentation portfolio infographics pdf. The topics addressed in these templates are product, fgh product, units in usd, price, supplier. All the content presented in this PPT design is completely editable. Download it and make adjustments in color, background, font etc. as per your unique business setting.

Downturn Graph Indicating Business Share Value Decline Ppt PowerPoint Presentation Professional Elements PDF
Showcasing this set of slides titled downturn graph indicating business share value decline ppt powerpoint presentation professional elements pdf. The topics addressed in these templates are per share value, 2016 to 2020. All the content presented in this PPT design is completely editable. Download it and make adjustments in color, background, font etc. as per your unique business setting.

Downturn Graph Indicating Reduction In Carbon Omission Ppt PowerPoint Presentation Outline Inspiration PDF
Showcasing this set of slides titled downturn graph indicating reduction in carbon omission ppt powerpoint presentation outline inspiration pdf. The topics addressed in these templates are carbon omission, year, 2015 to 2020. All the content presented in this PPT design is completely editable. Download it and make adjustments in color, background, font etc. as per your unique business setting.
Product Cost Management PCM Balanced Scorecard Indicator Vision Goal And Strategy Ppt Icon Show PDF
Deliver and pitch your topic in the best possible manner with this product cost management pcm balanced scorecard indicator vision goal and strategy ppt icon show pdf. Use them to share invaluable insights on financial, target, growth, process and impress your audience. This template can be altered and modified as per your expectations. So, grab it now.
Indicator Of Electronic Gadgets Quarterly Of Market Competitiveness Ppt PowerPoint Presentation Icon Background Images PDF
Showcasing this set of slides titled indicator of electronic gadgets quarterly of market competitiveness ppt powerpoint presentation icon background images pdf. The topics addressed in these templates are gadget, market share, quarterly. All the content presented in this PPT design is completely editable. Download it and make adjustments in color, background, font etc. as per your unique business setting.

Business Chart Indicating Major Outsourcing Advantages Ppt PowerPoint Presentation File Template PDF
Showcasing this set of slides titled business chart indicating major outsourcing advantages ppt powerpoint presentation file template pdf. The topics addressed in these templates are cost, business, service. All the content presented in this PPT design is completely editable. Download it and make adjustments in color, background, font etc. as per your unique business setting.
Drug Indicator Extension In A Pharmaceuticals Company Case Competition Icons Slide Portrait PDF
Introducing our well designed drug indicator extension in a pharmaceuticals company case competition icons slide portrait pdf set of slides. The slide displays editable icons to enhance your visual presentation. The icons can be edited easily. So customize according to your business to achieve a creative edge. Download and share it with your audience.

Drug Indicator Extension In A Pharmaceuticals Company Table Of Content Analysis Ideas PDF
Deliver and pitch your topic in the best possible manner with this drug indicator extension in a pharmaceuticals company table of content analysis ideas pdf. Use them to share invaluable insights on development, strategy, analysis, financial, implementing and impress your audience. This template can be altered and modified as per your expectations. So, grab it now.
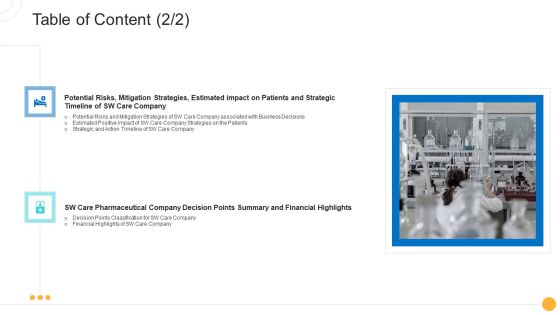
Drug Indicator Extension In A Pharmaceuticals Company Table Of Content Decision Rules PDF
Deliver an awe inspiring pitch with this creative drug indicator extension in a pharmaceuticals company table of content decision rules pdf bundle. Topics like potential risks, mitigation, strategies, financial can be discussed with this completely editable template. It is available for immediate download depending on the needs and requirements of the user.

Service Level Agreement Management Dashboard Indicating Customer Satisfaction Status Designs PDF
Pitch your topic with ease and precision using this service level agreement management dashboard indicating customer satisfaction status designs pdf. This layout presents information on customer satisfaction, service level management, contracts by manufacturer. It is also available for immediate download and adjustment. So, changes can be made in the color, design, graphics or any other component to create a unique layout.
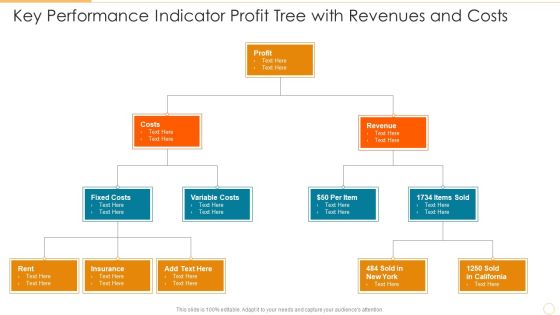
Key Performance Indicator Profit Tree With Revenues And Costs Template PDF
Presenting key performance indicator profit tree with revenues and costs template pdf to dispense important information. This template comprises three stages. It also presents valuable insights into the topics including costs, profit, revenue. This is a completely customizable PowerPoint theme that can be put to use immediately. So, download it and address the topic impactfully.

Organizational Key Performance Indicator Tree Depicting Market And Company Revenue Graphics PDF
Presenting organizational key performance indicator tree depicting market and company revenue graphics pdf to dispense important information. This template comprises three stages. It also presents valuable insights into the topics including total market revenue, company revenue, increase market share. This is a completely customizable PowerPoint theme that can be put to use immediately. So, download it and address the topic impactfully.

Supplier Scorecard Assessment Scorecard Indicating Chargeback From Multiple Supplier Background PDF
Deliver an awe inspiring pitch with this creative supplier scorecard assessment scorecard indicating chargeback from multiple supplier background pdf bundle. Topics like supplier, quantity, amount, routing authorization can be discussed with this completely editable template. It is available for immediate download depending on the needs and requirements of the user.
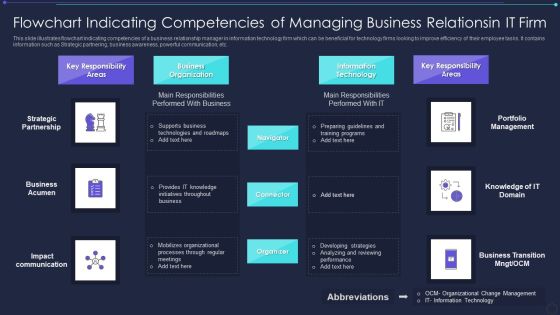
Flowchart Indicating Competencies Of Managing Business Relationsin It Firm Designs PDF
Showcasing this set of slides titled flowchart indicating competencies of managing business relationsin it firm designs pdf. The topics addressed in these templates are strategic partnership, business acumen, impact communication. All the content presented in this PPT design is completely editable. Download it and make adjustments in color, background, font etc. as per your unique business setting.

Business Analysis Architecture Indicating Marketing Impact On Consumer Behavior Structure PDF
Showcasing this set of slides titled Business Analysis Architecture Indicating Marketing Impact On Consumer Behavior Structure PDF. The topics addressed in these templates are Business Promotion, Showed In Marketing, Business Marketing. All the content presented in this PPT design is completely editable. Download it and make adjustments in color, background, font etc. as per your unique business setting.

2023 Business Calendar Indicating Business Milestones Of February Month Topics PDF
Presenting 2023 Business Calendar Indicating Business Milestones Of February Month Topics PDF to dispense important information. This template comprises one stages. It also presents valuable insights into the topics including Develop Strong Business Model, Target Customer Dimensions. This is a completely customizable PowerPoint theme that can be put to use immediately. So, download it and address the topic impactfully.

2023 Business Calendar Indicating Monthly Meetings And Employee Goals Template PDF
Presenting 2023 Business Calendar Indicating Monthly Meetings And Employee Goals Template PDF to dispense important information. This template comprises tweleve stages. It also presents valuable insights into the topics including Design Team, Employee Goals, Marketing Plan. This is a completely customizable PowerPoint theme that can be put to use immediately. So, download it and address the topic impactfully.

Customer NPS Metric Image Indicating Customer Giving Experience Rating On Device Icons PDF
Presenting Customer NPS Metric Image Indicating Customer Giving Experience Rating On Device Icons PDF to dispense important information. This template comprises five stages. It also presents valuable insights into the topics including Customers Retention, Enhance Customer Experience, Business Assessment. This is a completely customizable PowerPoint theme that can be put to use immediately. So, download it and address the topic impactfully.
Drug Indicator Extension In A Pharmaceuticals Company Post It Notes Introduction PDF
This is a drug indicator extension in a pharmaceuticals company post it notes introduction pdf template with various stages. Focus and dispense information on three stages using this creative set, that comes with editable features. It contains large content boxes to add your information on topics like post it notes. You can also showcase facts, figures, and other relevant content using this PPT layout. Grab it now.
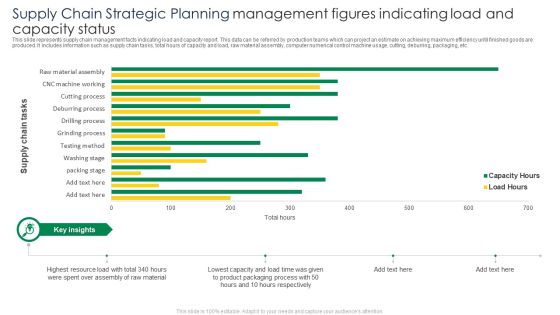
Supply Chain Strategic Planning Management Figures Indicating Load And Capacity Status Elements PDF
This slide represents supply chain management facts indicating load and capacity report. This data can be referred by production teams which can project an estimate on achieving maximum efficiency until finished goods are produced. It includes information such as supply chain tasks, total hours of capacity and load, raw material assembly, computer numerical control machine usage, cutting, deburring, packaging, etc. Showcasing this set of slides titled Supply Chain Strategic Planning Management Figures Indicating Load And Capacity Status Elements PDF. The topics addressed in these templates are Highest Resource Load, Raw Material, Lowest Capacity. All the content presented in this PPT design is completely editable. Download it and make adjustments in color, background, font etc. as per your unique business setting.
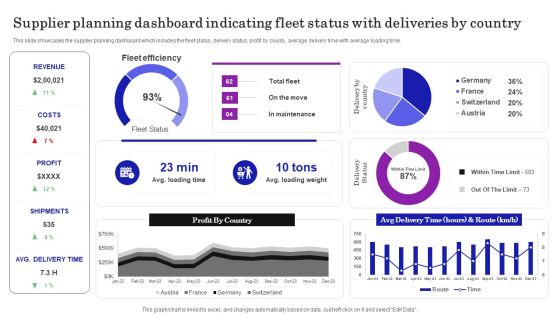
Supplier Planning Dashboard Indicating Fleet Status With Deliveries By Country Ideas PDF
This slide showcases the supplier planning dashboard which includes the fleet status, delivery status, profit by county, average delivery time with average loading time. Here you can discover an assortment of the finest PowerPoint and Google Slides templates. With these templates, you can create presentations for a variety of purposes while simultaneously providing your audience with an eye catching visual experience. Download Supplier Planning Dashboard Indicating Fleet Status With Deliveries By Country Ideas PDF to deliver an impeccable presentation. These templates will make your job of preparing presentations much quicker, yet still, maintain a high level of quality. Slidegeeks has experienced researchers who prepare these templates and write high quality content for you. Later on, you can personalize the content by editing the Supplier Planning Dashboard Indicating Fleet Status With Deliveries By Country Ideas PDF.

Statistics Indicating Usage Of AI Tools Across Marketing Tasks Ppt Infographics Clipart Images PDF
This slide showcases statistic which indicate usage of multiple artificial intelligence AI tools across marketing ecosystem. It provides details about Jasper.ai, ChatGPT, Copy.ai, Frase.io, high quality content, social media content, etc. Retrieve professionally designed Statistics Indicating Usage Of AI Tools Across Marketing Tasks Ppt Infographics Clipart Images PDF to effectively convey your message and captivate your listeners. Save time by selecting pre-made slideshows that are appropriate for various topics, from business to educational purposes. These themes come in many different styles, from creative to corporate, and all of them are easily adjustable and can be edited quickly. Access them as PowerPoint templates or as Google Slides themes. You do not have to go on a hunt for the perfect presentation because Slidegeeks got you covered from everywhere.
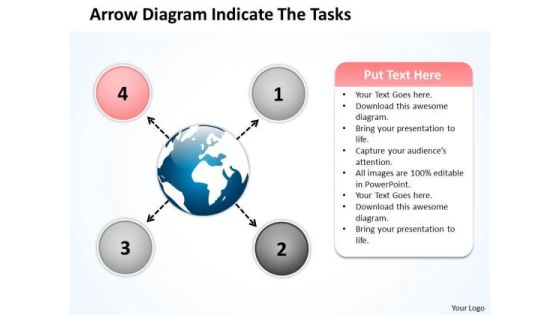
Arrow Diagram Indicate The Tasks Circle Circular Flow Layout Process PowerPoint Slides
We present our arrow diagram indicate the tasks circle Circular Flow Layout Process PowerPoint Slides.Download our Business PowerPoint Templates because this diagram helps you to show goal also clearly etched in your mind. Use our Ring Charts PowerPoint Templates because you have the ideas to develop the teams vision of where they need to be in the future. Download our Marketing PowerPoint Templates because networking is an imperative in todays world. You need to access the views of others. Similarly you need to give access to them of your abilities. Download and present our Shapes PowerPoint Templates because this slide shows each path to the smallest detail. Download our Process and Flows PowerPoint Templates because this Layout helps you to expand your plans to overcome obstacles and reassure the team that they shall continue to roll along merrily.Use these PowerPoint slides for presentations relating to Arrows, choice, connect, design, direction, flows, four, info graph, instruction, layout, manual, marketing, modern, one, option, order, page, paper, pointing, process, product, promotion, sequence, simple, special, step, symbol. The prominent colors used in the PowerPoint template are Pink, Blue, White. Presenters tell us our arrow diagram indicate the tasks circle Circular Flow Layout Process PowerPoint Slides will help you be quick off the draw. Just enter your specific text and see your points hit home. Professionals tell us our info PowerPoint templates and PPT Slides provide you with a vast range of viable options. Select the appropriate ones and just fill in your text. PowerPoint presentation experts tell us our arrow diagram indicate the tasks circle Circular Flow Layout Process PowerPoint Slides are Dazzling. The feedback we get is that our connect PowerPoint templates and PPT Slides will make you look like a winner. Use our arrow diagram indicate the tasks circle Circular Flow Layout Process PowerPoint Slides are Detailed. Use our four PowerPoint templates and PPT Slides are Spectacular.

Arrow Diagram Indicate The Tasks Circular Flow Layout Process PowerPoint Slides
We present our arrow diagram indicate the tasks Circular Flow Layout Process PowerPoint Slides.Download and present our Business PowerPoint Templates because your thoughts are pointed and sharp as arrows. Present our Ring Charts PowerPoint Templates because it Draws the universal impact to highlight the similarities with your organizational structure and plans. Download our Marketing PowerPoint Templates because networking is an imperative in todays world. You need to access the views of others. Similarly you need to give access to them of your abilities. Use our Shapes PowerPoint Templates because different people with differing ideas and priorities perform together to score. Download our Process and Flows PowerPoint Templates because you have a great plan to put the pieces together, getting all the various contributors to gel for a successful completion.Use these PowerPoint slides for presentations relating to Arrows, choice, connect, design, direction, flows, four, info graph, instruction, layout, manual, marketing, modern, one, option, order, page, paper, pointing, process, product, promotion, sequence, simple, special, step, symbol. The prominent colors used in the PowerPoint template are Purple, Blue, Black. Presenters tell us our arrow diagram indicate the tasks Circular Flow Layout Process PowerPoint Slides are Majestic. Professionals tell us our info PowerPoint templates and PPT Slides are Breathtaking. PowerPoint presentation experts tell us our arrow diagram indicate the tasks Circular Flow Layout Process PowerPoint Slides are Clever. The feedback we get is that our info PowerPoint templates and PPT Slides are Nifty. Use our arrow diagram indicate the tasks Circular Flow Layout Process PowerPoint Slides are One-of-a-kind. Use our four PowerPoint templates and PPT Slides are readymade to fit into any presentation structure.
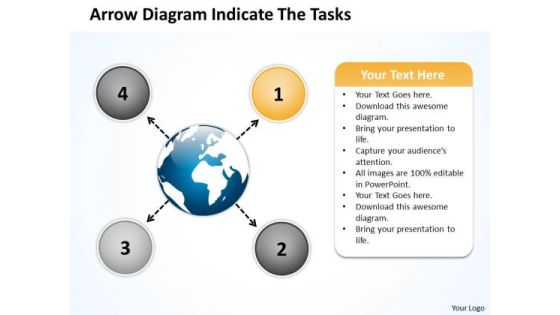
Arrow Diagram Indicate The Tasks Ppt Circular Flow Layout Process PowerPoint Slide
We present our arrow diagram indicate the tasks ppt Circular Flow Layout Process PowerPoint Slide.Download our Process and Flows PowerPoint Templates because the vision of being the market leader is clear to you. Download our Arrows PowerPoint Templates because this is a good example of the strength of teamwork. Use our Business PowerPoint Templates because this template helps you to delve on these thoughts and brief your team on the value of your depth of understanding of the subject. Download and present our Circle Charts PowerPoint Templates because the mind is always whirring with new ideas. Present our Flow Charts PowerPoint Templates because you know your business and have a vision for it.Use these PowerPoint slides for presentations relating to Arrows, choice, connect, design, direction, flows, four, info graph, instruction, layout, manual, marketing, modern, one, option, order, page, paper, pointing, process, product, promotion, sequence, simple, special, step, symbol. The prominent colors used in the PowerPoint template are Orange, Gray, Black. Presenters tell us our arrow diagram indicate the tasks ppt Circular Flow Layout Process PowerPoint Slide will help you be quick off the draw. Just enter your specific text and see your points hit home. Professionals tell us our design PowerPoint templates and PPT Slides are specially created by a professional team with vast experience. They diligently strive to come up with the right vehicle for your brilliant Ideas. PowerPoint presentation experts tell us our arrow diagram indicate the tasks ppt Circular Flow Layout Process PowerPoint Slide are Reminiscent. The feedback we get is that our direction PowerPoint templates and PPT Slides are effectively colour coded to prioritise your plans They automatically highlight the sequence of events you desire. Use our arrow diagram indicate the tasks ppt Circular Flow Layout Process PowerPoint Slide are Clever. Use our info PowerPoint templates and PPT Slides are Colorful.
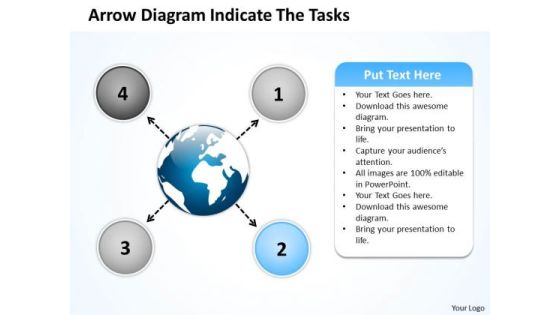
Arrow Diagram Indicate The Tasks Circular Flow Layout Process PowerPoint Slide
We present our arrow diagram indicate the tasks Circular Flow Layout Process PowerPoint Slide.Use our Process and Flows PowerPoint Templates because the atmosphere in the worplace is electric. Download and present our Arrows PowerPoint Templates because you know that the core of any organisation is the people who work for it. Use our Business PowerPoint Templates because the majestic tiger lord of all it surveys.It exudes power even when it is in repose. Download and present our Circle Charts PowerPoint Templates because you have a handle on all the targets, a master of the game, the experienced and consummate juggler. Download our Flow Charts PowerPoint Templates because this Layout can explain the relevance of the different layers and stages in getting down to your core competence, ability and desired result.Use these PowerPoint slides for presentations relating to Arrows, choice, connect, design, direction, flows, four, info graph, instruction, layout, manual, marketing, modern, one, option, order, page, paper, pointing, process, product, promotion, sequence, simple, special, step, symbol. The prominent colors used in the PowerPoint template are Blue light, Blue, Black. Presenters tell us our arrow diagram indicate the tasks Circular Flow Layout Process PowerPoint Slide are Stylish. Professionals tell us our info PowerPoint templates and PPT Slides are Fashionable. PowerPoint presentation experts tell us our arrow diagram indicate the tasks Circular Flow Layout Process PowerPoint Slide will make the presenter look like a pro even if they are not computer savvy. The feedback we get is that our connect PowerPoint templates and PPT Slides are Fashionable. Use our arrow diagram indicate the tasks Circular Flow Layout Process PowerPoint Slide are Zippy. Use our four PowerPoint templates and PPT Slides are Royal.
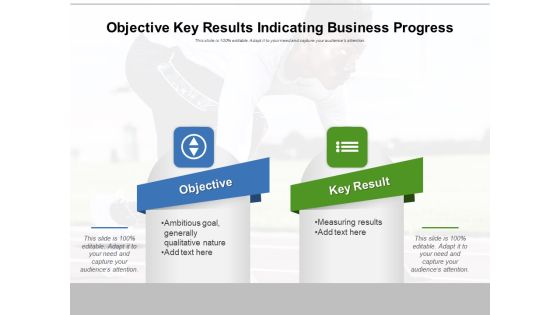
Objective Key Results Indicating Business Progress Ppt PowerPoint Presentation Gallery Shapes PDF
Persuade your audience using this objective key results indicating business progress ppt powerpoint presentation gallery shapes pdf. This PPT design covers two stages, thus making it a great tool to use. It also caters to a variety of topics including objective, key result. Download this PPT design now to present a convincing pitch that not only emphasizes the topic but also showcases your presentation skills.

Drug Indicator Extension In A Pharmaceuticals Company Pricing Strategy Of SW Care Company Designs PDF
This slide shows the pricing strategy options available with SW Care Company for KEMICARE expansion along with the benefits of Pricing Strategy. Deliver and pitch your topic in the best possible manner with this drug indicator extension in a pharmaceuticals company pricing strategy of sw care company designs pdf. Use them to share invaluable insights on pricing strategies, competitive edge, maintained, awareness and impress your audience. This template can be altered and modified as per your expectations. So, grab it now.
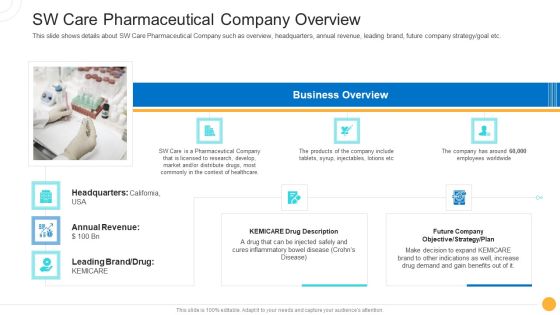
Drug Indicator Extension In A Pharmaceuticals Company SW Care Pharmaceutical Company Overview Information PDF
This slide shows details about SW Care Pharmaceutical Company such as overview, headquarters, annual revenue, leading brand, future company strategy or goal etc. Deliver an awe inspiring pitch with this creative drug indicator extension in a pharmaceuticals company sw care pharmaceutical company overview information pdf bundle. Topics like revenue, headquarters, objective, strategy, plan can be discussed with this completely editable template. It is available for immediate download depending on the needs and requirements of the user.
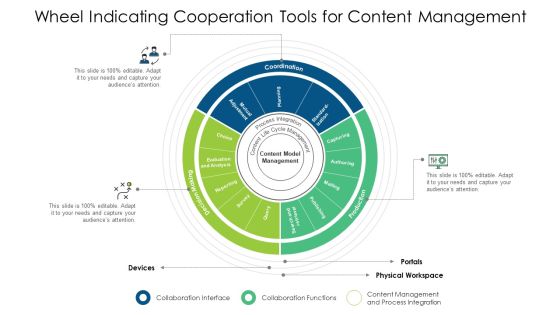
Wheel Indicating Cooperation Tools For Content Management Ppt PowerPoint Presentation File Grid PDF
Persuade your audience using this wheel indicating cooperation tools for content management ppt powerpoint presentation file grid pdf. This PPT design covers three stages, thus making it a great tool to use. It also caters to a variety of topics including coordination, production, decision making. Download this PPT design now to present a convincing pitch that not only emphasizes the topic but also showcases your presentation skills.
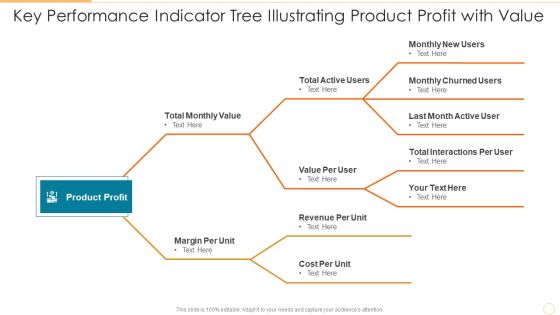
Key Performance Indicator Tree Illustrating Product Profit With Value Brochure PDF
Persuade your audience using this key performance indicator tree illustrating product profit with value brochure pdf. This PPT design covers three stages, thus making it a great tool to use. It also caters to a variety of topics including value per user, revenue per unit, cost per unit. Download this PPT design now to present a convincing pitch that not only emphasizes the topic but also showcases your presentation skills.
Five Different Types Of Calculate Facebook Key Performance Indicator Results Icons PDF
Pitch your topic with ease and precision using this five different types of calculate facebook key performance indicator results icons pdf. This layout presents information on reach kpis, traffic kpis, engagement kpis, conversions kpis, brand awareness kpis. It is also available for immediate download and adjustment. So, changes can be made in the color, design, graphics or any other component to create a unique layout.

Timeline Indicating Insider Threat In Cyber Security User Activities Microsoft PDF
This slide shows timeline depicting insider threat user logs. It contains information about archived activities, user event, policy violation trigger, capture continuation, etc. Pitch your topic with ease and precision using this Timeline Indicating Insider Threat In Cyber Security User Activities Microsoft PDF. This layout presents information on User Event, Policy Violation Trigger, Archived Logs. It is also available for immediate download and adjustment. So, changes can be made in the color, design, graphics or any other component to create a unique layout.

SLA KPL Dashboard Indicating Compliance Priority With KPI Ppt File Format PDF
This graph or chart is linked to excel, and changes automatically based on data. Just left click on it and select Edit Data. Showcasing this set of slides titled SLA KPL Dashboard Indicating Compliance Priority With KPI Ppt File Format PDF. The topics addressed in these templates are KPI Graph, Insights Here, SLA Compliance Priority. All the content presented in this PPT design is completely editable. Download it and make adjustments in color, background, font etc. as per your unique business setting.
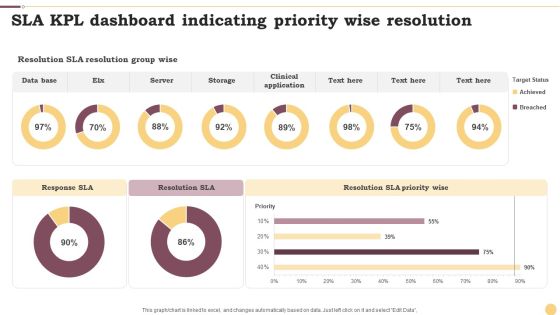
SLA KPL Dashboard Indicating Priority Wise Resolution Ppt Infographics Example File PDF
This graph or chart is linked to excel, and changes automatically based on data. Just left click on it and select Edit Data. Pitch your topic with ease and precision using this SLA KPL Dashboard Indicating Priority Wise Resolution Ppt Infographics Example File PDF. This layout presents information on Data Base, Server, Storage. It is also available for immediate download and adjustment. So, changes can be made in the color, design, graphics or any other component to create a unique layout.

SLA KPL Dashboard Indicating Top Week Performers Ppt Infographics Examples PDF
This graph or chart is linked to excel, and changes automatically based on data. Just left click on it and select Edit Data. Showcasing this set of slides titled SLA KPL Dashboard Indicating Top Week Performers Ppt Infographics Examples PDF. The topics addressed in these templates are Active Slas Risk, Active Slas Breached, Active Slas. All the content presented in this PPT design is completely editable. Download it and make adjustments in color, background, font etc. as per your unique business setting.
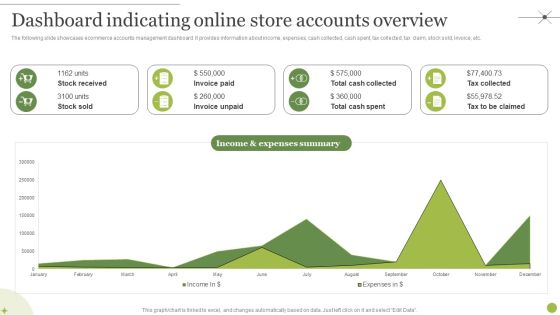
Managing E Commerce Business Accounting Dashboard Indicating Online Store Accounts Overview Inspiration PDF
The following slide showcases ecommerce accounts management dashboard. It provides information about income, expenses, cash collected, cash spent, tax collected, tax claim, stock sold, invoice, etc. There are so many reasons you need a Managing E Commerce Business Accounting Dashboard Indicating Online Store Accounts Overview Inspiration PDF. The first reason is you can not spend time making everything from scratch, Thus, Slidegeeks has made presentation templates for you too. You can easily download these templates from our website easily.

Manufacturing Plant Corporate Sustainability Dashboard Indicating Sourcing And Consumption Infographics PDF
The following slide showcases business sustainability dashboard highlighting multiple sources of technology. It provides information about renewable energy, plant age, solar, wind, biomass, regionality, etc.Pitch your topic with ease and precision using this Manufacturing Plant Corporate Sustainability Dashboard Indicating Sourcing And Consumption Infographics PDF. This layout presents information on Energy Consumption, Freshwater Consumption, Chemical Recovery. It is also available for immediate download and adjustment. So, changes can be made in the color, design, graphics or any other component to create a unique layout.

Indicator Batteries Charging And Discharging 4 PowerPoint Slides And Ppt Diagram Templates
Indicator Batteries Charging And Discharging 4 PowerPoint Slides And PPT Diagram Templates-These high quality powerpoint pre-designed slides and powerpoint templates have been carefully created by our professional team to help you impress your audience. All slides have been created and are 100% editable in powerpoint. Each and every property of any graphic - color, size, orientation, shading, outline etc. can be modified to help you build an effective powerpoint presentation. Any text can be entered at any point in the powerpoint template or slide. Simply DOWNLOAD, TYPE and PRESENT!

Indicator Batteries Charging And Discharging 5 PowerPoint Slides And Ppt Diagram Templates
Indicator Batteries Charging And Discharging 5 PowerPoint Slides And PPT Diagram Templates-These high quality powerpoint pre-designed slides and powerpoint templates have been carefully created by our professional team to help you impress your audience. All slides have been created and are 100% editable in powerpoint. Each and every property of any graphic - color, size, orientation, shading, outline etc. can be modified to help you build an effective powerpoint presentation. Any text can be entered at any point in the powerpoint template or slide. Simply DOWNLOAD, TYPE and PRESENT!
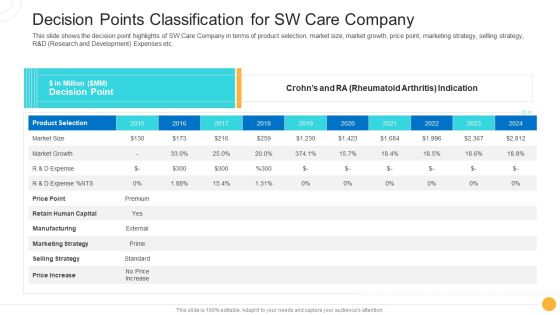
Drug Indicator Extension In A Pharmaceuticals Company Decision Points Classification For SW Care Company Download PDF
This slide shows the decision point highlights of SW Care Company in terms of product selection, market size, market growth, price point, marketing strategy, selling strategy, R and D Research and Development Expenses etc. Deliver and pitch your topic in the best possible manner with this drug indicator extension in a pharmaceuticals company decision points classification for sw care company download pdf. Use them to share invaluable insights on market growth, market size, marketing strategy, manufacturing, price increase and impress your audience. This template can be altered and modified as per your expectations. So, grab it now.

Drug Indicator Extension In A Pharmaceuticals Company Financial Highlights Of SW Care Company Slides PDF
This slide shows the Financial Highlights of SW Care Company such as net trade sales, gross profit, net income, sales and marketing investment, share metrics, value creation metrics, market growth etc. along with decision point summary details. Deliver an awe inspiring pitch with this creative drug indicator extension in a pharmaceuticals company financial highlights of sw care company slides pdf bundle. Topics like decision point summary, financials, market assumptions can be discussed with this completely editable template. It is available for immediate download depending on the needs and requirements of the user.
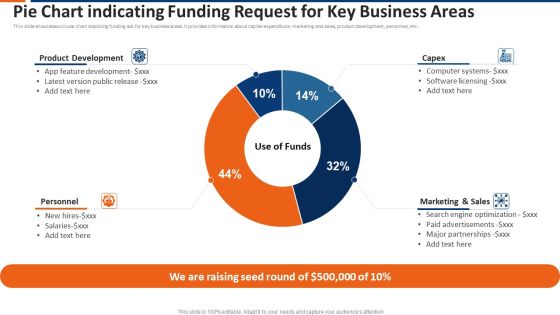
Pie Chart Indicating Funding Request For Key Business Areas Ppt Show Topics PDF
This slide showcases circular chart depicting funding ask for key business areas. It provides information about capital expenditure, marketing and sales, product development, personnel, etc. Pitch your topic with ease and precision using this pie chart indicating funding request for key business areas ppt show topics pdf. This layout presents information on product development, capex, marketing and sales, personnel. It is also available for immediate download and adjustment. So, changes can be made in the color, design, graphics or any other component to create a unique layout.
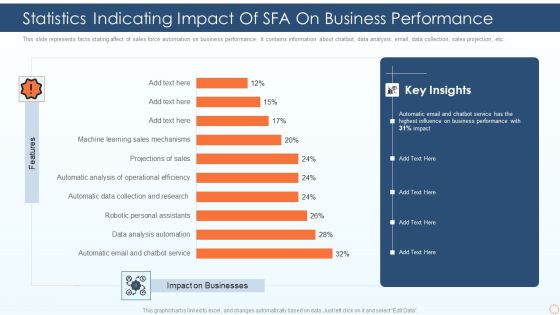
Statistics Indicating Impact Of SFA On Business Performance Ppt PowerPoint Presentation Gallery Outfit PDF
This slide represents facts stating affect of sales force automation on business performance. It contains information about chatbot, data analysis, email, data collection, sales projection, etc. Pitch your topic with ease and precision using this statistics indicating impact of sfa on business performance ppt powerpoint presentation gallery outfit pdf. This layout presents information on automatic email and chatbot service, data analysis automation, robotic personal assistants. It is also available for immediate download and adjustment. So, changes can be made in the color, design, graphics or any other component to create a unique layout.

Flowchart Indicating Legacy Cloud Platform Migration To Cloud Platform Sample PDF
This slide shows steps of legacy application migration to new platform which contains environmental analysis, environment assessment, selecting tactic, final migration and evaluating resources. It can benefit users who are looking to move to more immersive and user-friendly platforms like cloud.Presenting Flowchart Indicating Legacy Cloud Platform Migration To Cloud Platform Sample PDF to dispense important information. This template comprises six stages. It also presents valuable insights into the topics including Plan Phase, Design Phase, Work Products. This is a completely customizable PowerPoint theme that can be put to use immediately. So, download it and address the topic impactfully.

Statistics Indicating Impact Of Employee Appreciation Program On Business Graphics PDF
This slide shows facts and figures of employee recognition program impact on business. It provides information such as revenue per full time equivalent FTE, customer retention and employee retention. Showcasing this set of slides titled Statistics Indicating Impact Of Employee Appreciation Program On Business Graphics PDF. The topics addressed in these templates are Employee Recognition Program, Revenue Per FTE, Customer Retention. All the content presented in this PPT design is completely editable. Download it and make adjustments in color, background, font etc. as per your unique business setting.

Finance Metrics Dashboard Indicating Account Receivable And Account Payable Demonstration PDF
This graph or chart is linked to excel, and changes automatically based on data. Just left click on it and select edit data. Showcasing this set of slides titled Finance Metrics Dashboard Indicating Account Receivable And Account Payable Demonstration PDF. The topics addressed in these templates are Total Accounts Receivable, Total Accounts Payable, Recommended Payment Timeline, Monthly Cash Flow. All the content presented in this PPT design is completely editable. Download it and make adjustments in color, background, font etc. as per your unique business setting.
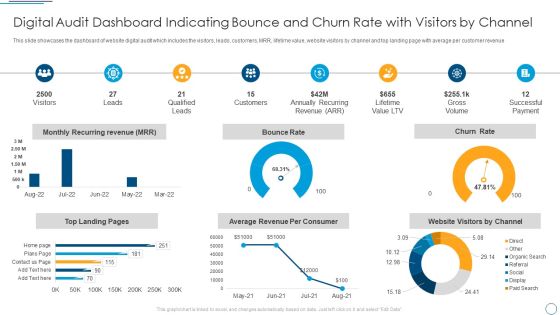
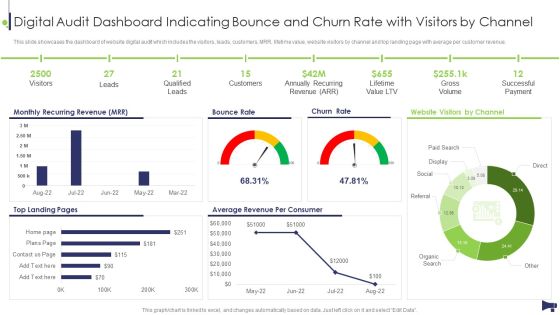
Digital Audit Dashboard Indicating Bounce And Churn Rate With Visitors By Channel Demonstration PDF
This slide showcases the dashboard of website digital audit which includes the visitors, leads, customers, MRR, lifetime value, website visitors by channel and top landing page with average per customer revenue.Deliver and pitch your topic in the best possible manner with this Digital Audit Dashboard Indicating Bounce And Churn Rate With Visitors By Channel Demonstration PDF. Use them to share invaluable insights on Qualified Leads, Annually Recurring, Successful Payment and impress your audience. This template can be altered and modified as per your expectations. So, grab it now.
Website And Social Media Digital Audit Dashboard Indicating Bounce And Churn Rate Template PDF
This slide showcases the dashboard of website digital audit which includes the visitors, leads, customers, MRR, lifetime value, website visitors by channel and top landing page with average per customer revenue. Deliver and pitch your topic in the best possible manner with this Website And Social Media Digital Audit Dashboard Indicating Bounce And Churn Rate Template PDF. Use them to share invaluable insights on Monthly Recurring Revenue, Bounce Rate, Churn Rate and impress your audience. This template can be altered and modified as per your expectations. So, grab it now.

Marketing Strategy For Shipping Business Key Performance Indicator Dashboard Graphics PDF
The following slide depicts the key areas in Marketing Strategy for Shipping Business to monitor and optimize supply chain processes. It includes elements such as fleet and shipment status, country wise revenue, location wise delivery, average shipment time etc.Pitch your topic with ease and precision using this Marketing Strategy For Shipping Business Key Performance Indicator Dashboard Graphics PDF. This layout presents information on Shipment Status, Average Shipment, Wise Revenue. It is also available for immediate download and adjustment. So, changes can be made in the color, design, graphics or any other component to create a unique layout.
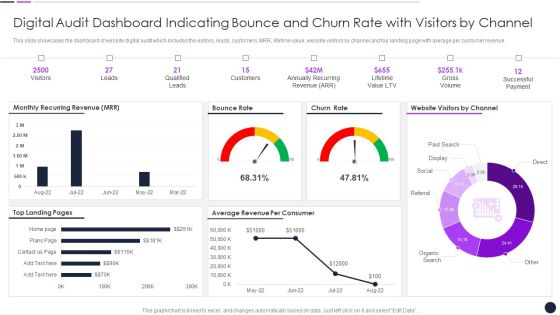
Digital Audit Dashboard Indicating Bounce And Churn Rate With Visitors By Channel Inspiration PDF
This slide showcases the dashboard of website digital audit which includes the visitors, leads, customers, MRR, lifetime value, website visitors by channel and top landing page with average per customer revenue.Deliver and pitch your topic in the best possible manner with this Digital Audit Dashboard Indicating Bounce And Churn Rate With Visitors By Channel Inspiration PDF. Use them to share invaluable insights on Qualified Leads, Annually Recurring, Lifetime Value and impress your audience. This template can be altered and modified as per your expectations. So, grab it now.

Digital Audit Dashboard Indicating Bounce And Churn Rate With Visitors By Channel Information PDF
This slide showcases the dashboard of website digital audit which includes the visitors, leads, customers, MRR, lifetime value, website visitors by channel and top landing page with average per customer revenue. Deliver an awe inspiring pitch with this creative Digital Audit Dashboard Indicating Bounce And Churn Rate With Visitors By Channel Information PDF bundle. Topics like Monthly Recurring Revenue, Bounce Rate, Churn Rate can be discussed with this completely editable template. It is available for immediate download depending on the needs and requirements of the user.

Service Level Agreement KPI Dashboard Indicating Violation Count And Overdue Requests Diagrams PDF
This graph or chart is linked to excel, and changes automatically based on data. Just left click on it and select Edit Data. Showcasing this set of slides titled Service Level Agreement KPI Dashboard Indicating Violation Count And Overdue Requests Diagrams PDF. The topics addressed in these templates are Total Requests Category, Total Requests Status, Urgent Requests. All the content presented in this PPT design is completely editable. Download it and make adjustments in color, background, font etc. as per your unique business setting.

Assessment Matrix Indicating Impact Of Technologies On Insider Threat In Cyber Security Use Cases Themes PDF
This slide shows technologies impact matrix for insider threat use cases. It contains details such as firewalls, data loss prevention, SIEM, user behavior analytics, process control system, etc. Showcasing this set of slides titled Assessment Matrix Indicating Impact Of Technologies On Insider Threat In Cyber Security Use Cases Themes PDF. The topics addressed in these templates are Key Insider, Threat, Use Cases, Key Technologies. All the content presented in this PPT design is completely editable. Download it and make adjustments in color, background, font etc. as per your unique business setting.

Key Performance Indicator For Sales And Marketing Business Plan Review Brochure PDF
The following slide showcases components of various department to track record and make further improvement plans. The key departments covered are marketing, sales and workforce and their status and owner. Pitch your topic with ease and precision using this Key Performance Indicator For Sales And Marketing Business Plan Review Brochure PDF. This layout presents information on Marketing, Sales, Workforce. It is also available for immediate download and adjustment. So, changes can be made in the color, design, graphics or any other component to create a unique layout.

COVID 19 Statistics Indicating Repercussions Imposed On Food And Beverage Industry Demonstration PDF
This slide showcases impact of coronavirus pandemic on food beverage sector. It provides details about food delivery apps, grocery delivery portals, food processing innovation, projected loss, etc. Deliver and pitch your topic in the best possible manner with this COVID 19 Statistics Indicating Repercussions Imposed On Food And Beverage Industry Demonstration PDF. Use them to share invaluable insights on Delivery Services, Beverage Industry, Sustained Food and impress your audience. This template can be altered and modified as per your expectations. So, grab it now.
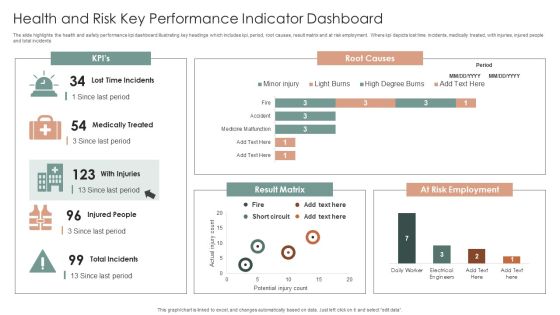
Health And Risk Key Performance Indicator Dashboard Ppt Layouts Graphics Design PDF
The slide highlights the health and safety performance kpi dashboard illustrating key headings which includes kpi, period, root causes, result matrix and at risk employment. Where kpi depicts lost time incidents, medically treated, with injuries, injured people and total incidents. Showcasing this set of slides titled Health And Risk Key Performance Indicator Dashboard Ppt Layouts Graphics Design PDF. The topics addressed in these templates are Root Causes, Result Matrix, At Risk Employment. All the content presented in this PPT design is completely editable. Download it and make adjustments in color, background, font etc. as per your unique business setting.
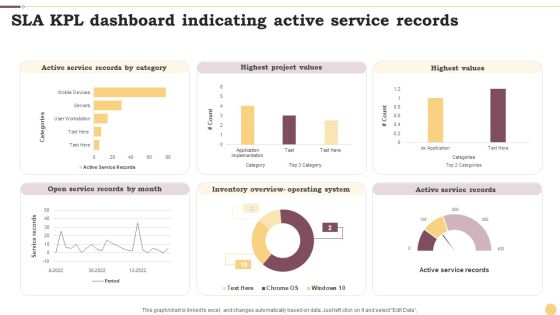
SLA KPL Dashboard Indicating Active Service Records Ppt Professional Graphics Example PDF
This graph or chart is linked to excel, and changes automatically based on data. Just left click on it and select Edit Data. Pitch your topic with ease and precision using this SLA KPL Dashboard Indicating Active Service Records Ppt Professional Graphics Example PDF. This layout presents information on Active Service Records, Highest Project Values, Highest Values. It is also available for immediate download and adjustment. So, changes can be made in the color, design, graphics or any other component to create a unique layout.
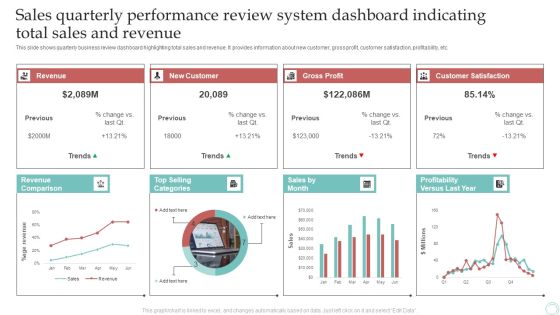
Sales Quarterly Performance Review System Dashboard Indicating Total Sales And Revenue Download PDF
This slide shows quarterly business review dashboard highlighting total sales and revenue. It provides information about new customer, gross profit, customer satisfaction, profitability, etc. Pitch your topic with ease and precision using this Sales Quarterly Performance Review System Dashboard Indicating Total Sales And Revenue Download PDF. This layout presents information on Revenue, New Customer, Gross Profit. It is also available for immediate download and adjustment. So, changes can be made in the color, design, graphics or any other component to create a unique layout.
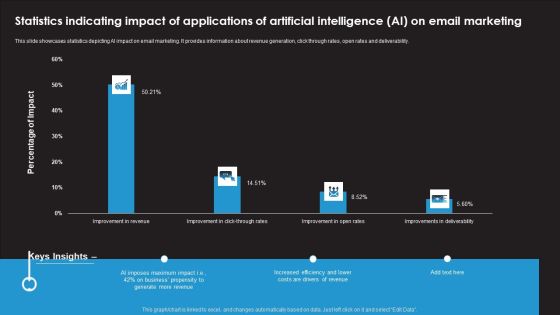
Statistics Indicating Impact Of Applications Of Artificial Intelligence AI On Email Marketing Inspiration PDF
This slide showcases statistics depicting AI impact on email marketing. It provides information about revenue generation, click through rates, open rates and deliverability. Showcasing this set of slides titled Statistics Indicating Impact Of Applications Of Artificial Intelligence AI On Email Marketing Inspiration PDF. The topics addressed in these templates are AI Imposes Maximum Impact, Business Propensity, Increased Efficiency. All the content presented in this PPT design is completely editable. Download it and make adjustments in color, background, font etc. as per your unique business setting.

Commercial Model Indicating Sales And Marketing Techniques Ppt File Maker PDF
This slide showcases commercial framework which can be ideal for sales and marketing techniques to comply their current resources with new techniques. It includes information about customer, market approach, work, staff, deployment, etc. Persuade your audience using this Commercial Model Indicating Sales And Marketing Techniques Ppt File Maker PDF. This PPT design covers five stages, thus making it a great tool to use. It also caters to a variety of topics including Customers, Approach Market, Market Strategy . Download this PPT design now to present a convincing pitch that not only emphasizes the topic but also showcases your presentation skills.

Model Indicating Commercial Practices Of Key Business Departments Ppt File Graphics Design PDF
This slide represents commercial assessment framework covering key business areas which contains commercial life cycle, defining, purchase, management, marketable risk mitigation, etc. This can help companies in increasing value of services offered by employees to their customers. Showcasing this set of slides titled Model Indicating Commercial Practices Of Key Business Departments Ppt File Graphics Design PDF. The topics addressed in these templates are Commercial Tactics, Authority And Planning, Management. All the content presented in this PPT design is completely editable. Download it and make adjustments in color, background, font etc. as per your unique business setting.

Project Controlling Dashboard Indicating Stages And Deliverables Ppt Styles Guide PDF
This slide shows dashboard for controlling multiple phases and deliverables of project. It provides information such as total revenue, cost, margin, task by status, risk, planned end date, owner, etc. Pitch your topic with ease and precision using this Project Controlling Dashboard Indicating Stages And Deliverables Ppt Styles Guide PDF. This layout presents information on Total Revenue, Total Margin, Total Cost. It is also available for immediate download and adjustment. So, changes can be made in the color, design, graphics or any other component to create a unique layout.
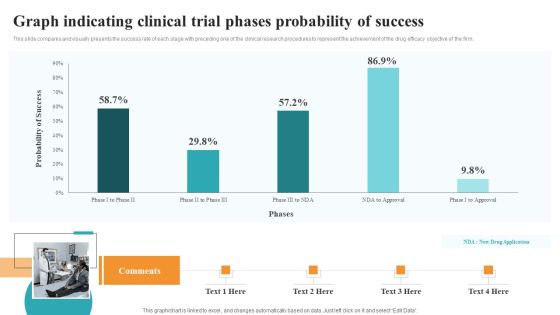
Graph Indicating Clinical Trial Phases Probability Of Success Medical Research Phases For Clinical Tests Graphics PDF
This slide compares and visually presents the success rate of each stage with preceding one of the clinical research procedures to represent the achievement of the drug efficacy objective of the firm. There are so many reasons you need a Graph Indicating Clinical Trial Phases Probability Of Success Medical Research Phases For Clinical Tests Graphics PDF. The first reason is you can not spend time making everything from scratch, Thus, Slidegeeks has made presentation templates for you too. You can easily download these templates from our website easily.

Dashboard Indicating Online Store Accounts Overview Financial Management Strategies Clipart PDF
The following slide showcases ecommerce accounts management dashboard. It provides information about income, expenses, cash collected, cash spent, tax collected, tax claim, stock sold, invoice, etc.From laying roadmaps to briefing everything in detail, our templates are perfect for you. You can set the stage with your presentation slides. All you have to do is download these easy-to-edit and customizable templates. Dashboard Indicating Online Store Accounts Overview Financial Management Strategies Clipart PDF will help you deliver an outstanding performance that everyone would remember and praise you for. Do download this presentation today.

Comprehensive Guide To Ecommerce Supplier Planning Dashboard Indicating Fleet Status Mockup PDF
This slide showcases the supplier planning dashboard which includes the fleet status, delivery status, profit by county, average delivery time with average loading time. Want to ace your presentation in front of a live audience Our Comprehensive Guide To Ecommerce Supplier Planning Dashboard Indicating Fleet Status Mockup PDF can help you do that by engaging all the users towards you.. Slidegeeks experts have put their efforts and expertise into creating these impeccable powerpoint presentations so that you can communicate your ideas clearly. Moreover, all the templates are customizable, and easy-to-edit and downloadable. Use these for both personal and commercial use.

Graph Indicating Clinical Trial Phases Probability Of Success New Clinical Drug Trial Process Information PDF
This slide compares and visually presents the success rate of each stage with preceding one of the clinical research procedures to represent the achievement of the drug efficacy objective of the firm. If your project calls for a presentation, then Slidegeeks is your go-to partner because we have professionally designed, easy-to-edit templates that are perfect for any presentation. After downloading, you can easily edit Graph Indicating Clinical Trial Phases Probability Of Success New Clinical Drug Trial Process Information PDF and make the changes accordingly. You can rearrange slides or fill them with different images. Check out all the handy templates

Comprehensive Guide For Launch Sales By Lead Source Performance Indicator Inspiration PDF
This graph or chart is linked to excel, and changes automatically based on data. Just left click on it and select Edit Data. The Comprehensive Guide For Launch Sales By Lead Source Performance Indicator Inspiration PDF is a compilation of the most recent design trends as a series of slides. It is suitable for any subject or industry presentation, containing attractive visuals and photo spots for businesses to clearly express their messages. This template contains a variety of slides for the user to input data, such as structures to contrast two elements, bullet points, and slides for written information. Slidegeeks is prepared to create an impression.
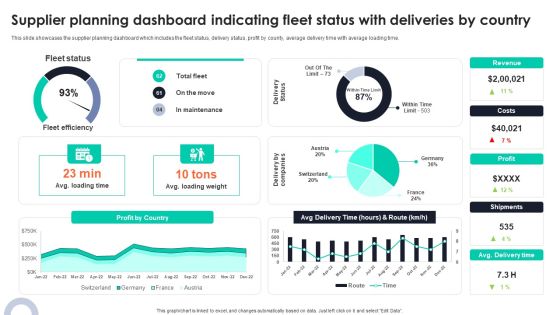
Supplier Planning Dashboard Indicating Fleet Status With Deliveries By Country Graphics PDF
Present like a pro with Supplier Planning Dashboard Indicating Fleet Status With Deliveries By Country Graphics PDF Create beautiful presentations together with your team, using our easy to use presentation slides. Share your ideas in real time and make changes on the fly by downloading our templates. So whether you are in the office, on the go, or in a remote location, you can stay in sync with your team and present your ideas with confidence. With Slidegeeks presentation got a whole lot easier. Grab these presentations today.

Key Performance Indicator Tree Variable Revenue Ppt PowerPoint Presentation Complete Deck With Slides
This key performance indicator tree variable revenue ppt powerpoint presentation complete deck with slides acts as backup support for your ideas, vision, thoughts, etc. Use it to present a thorough understanding of the topic. This PPT slideshow can be utilized for both in-house and outside presentations depending upon your needs and business demands. Entailing twelve slides with a consistent design and theme, this template will make a solid use case. As it is intuitively designed, it suits every business vertical and industry. All you have to do is make a few tweaks in the content or any other component to design unique presentations. The biggest advantage of this complete deck is that it can be personalized multiple times once downloaded. The color, design, shapes, and other elements are free to modify to add personal touches. You can also insert your logo design in this PPT layout. Therefore a well-thought and crafted presentation can be delivered with ease and precision by downloading this key performance indicator tree variable revenue ppt powerpoint presentation complete deck with slides PPT slideshow.

Electronic Indicator Device Speedometer Ppt PowerPoint Presentation Complete Deck With Slides
If designing a presentation takes a lot of your time and resources and you are looking for a better alternative, then this electronic indicator device speedometer ppt powerpoint presentation complete deck with slides is the right fit for you. This is a prefabricated set that can help you deliver a great presentation on the topic. All the twelve slides included in this sample template can be used to present a birds-eye view of the topic. These slides are also fully editable, giving you enough freedom to add specific details to make this layout more suited to your business setting. Apart from the content, all other elements like color, design, theme are also replaceable and editable. This helps in designing a variety of presentations with a single layout. Not only this, you can use this PPT design in formats like PDF, PNG, and JPG once downloaded. Therefore, without any further ado, download and utilize this sample presentation as per your liking.

Risk Key Performance Indicator Dashboard Ppt PowerPoint Presentation Complete Deck With Slides
Boost your confidence and team morale with this well-structured Risk Key Performance Indicator Dashboard Ppt PowerPoint Presentation Complete Deck With Slides. This prefabricated set gives a voice to your presentation because of its well-researched content and graphics. Our experts have added all the components very carefully, thus helping you deliver great presentations with a single click. Not only that, it contains a set of sixteen slides that are designed using the right visuals, graphics, etc. Various topics can be discussed, and effective brainstorming sessions can be conducted using the wide variety of slides added in this complete deck. Apart from this, our PPT design contains clear instructions to help you restructure your presentations and create multiple variations. The color, format, design anything can be modified as deemed fit by the user. Not only this, it is available for immediate download. So, grab it now.
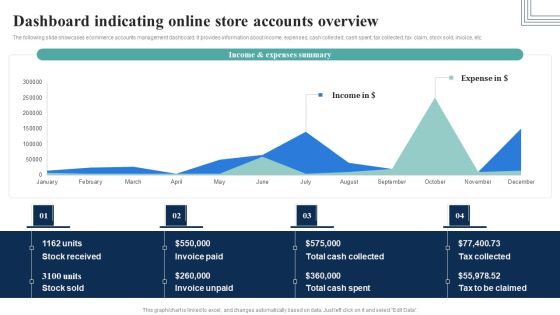
How Electronic Commerce Financial Procedure Can Be Enhanced Dashboard Indicating Online Store Pictures PDF
The following slide showcases ecommerce accounts management dashboard. It provides information about income, expenses, cash collected, cash spent, tax collected, tax claim, stock sold, invoice, etc.Do you know about Slidesgeeks How Electronic Commerce Financial Procedure Can Be Enhanced Dashboard Indicating Online Store Pictures PDF These are perfect for delivering any kind od presentation. Using it, create PowerPoint presentations that communicate your ideas and engage audiences. Save time and effort by using our pre-designed presentation templates that are perfect for a wide range of topic. Our vast selection of designs covers a range of styles, from creative to business, and are all highly customizable and easy to edit. Download as a PowerPoint template or use them as Google Slides themes.
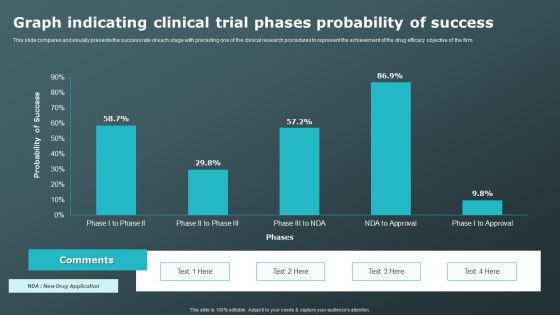
Graph Indicating Clinical Trial Phases Probability Of Success Clinical Research Trial Phases Professional PDF
This slide compares and visually presents the success rate of each stage with preceding one of the clinical research procedures to represent the achievement of the drug efficacy objective of the firm. Slidegeeks has constructed Graph Indicating Clinical Trial Phases Probability Of Success Clinical Research Trial Phases Professional PDF after conducting extensive research and examination. These presentation templates are constantly being generated and modified based on user preferences and critiques from editors. Here, you will find the most attractive templates for a range of purposes while taking into account ratings and remarks from users regarding the content. This is an excellent jumping-off point to explore our content and will give new users an insight into our top-notch PowerPoint Templates.
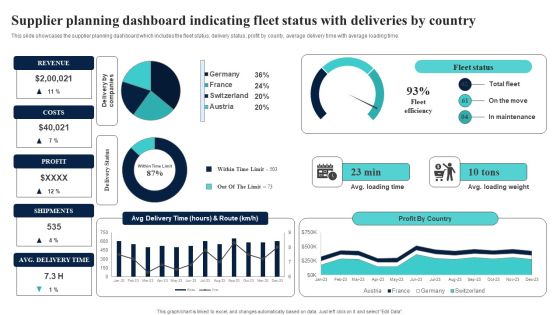
Supplier Planning Dashboard Indicating Fleet Status With Deliveries By Country Microsoft PDF
This slide showcases the supplier planning dashboard which includes the fleet status, delivery status, profit by county, average delivery time with average loading time. This Supplier Planning Dashboard Indicating Fleet Status With Deliveries By Country Microsoft PDF from Slidegeeks makes it easy to present information on your topic with precision. It provides customization options, so you can make changes to the colors, design, graphics, or any other component to create a unique layout. It is also available for immediate download, so you can begin using it right away. Slidegeeks has done good research to ensure that you have everything you need to make your presentation stand out. Make a name out there for a brilliant performance.
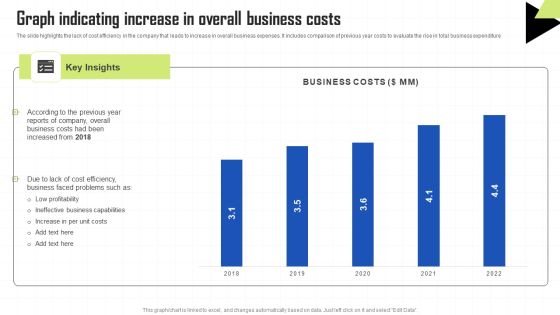
Key Techniques To Enhance Cost Efficiency Graph Indicating Increase In Overall Business Costs Structure PDF
The slide highlights the lack of cost efficiency in the company that leads to increase in overall business expenses. It includes comparison of previous year costs to evaluate the rise in total business expenditure Welcome to our selection of the Key Techniques To Enhance Cost Efficiency Graph Indicating Increase In Overall Business Costs Structure PDF. These are designed to help you showcase your creativity and bring your sphere to life. Planning and Innovation are essential for any business that is just starting out. This collection contains the designs that you need for your everyday presentations. All of our PowerPoints are 100 percent editable, so you can customize them to suit your needs. This multi purpose template can be used in various situations. Grab these presentation templates today.
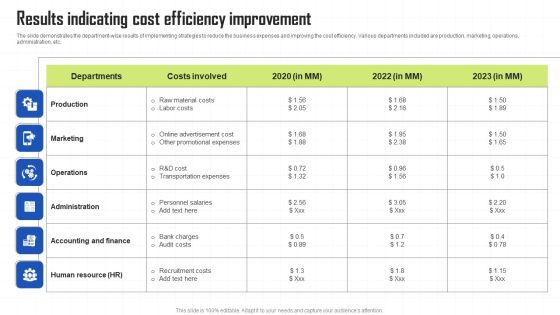
Key Techniques To Enhance Cost Efficiency Results Indicating Cost Efficiency Improvement Sample PDF
The slide demonstrates the department wise results of implementing strategies to reduce the business expenses and improving the cost efficiency. Various departments included are production, marketing, operations, administration, etc. This Key Techniques To Enhance Cost Efficiency Results Indicating Cost Efficiency Improvement Sample PDF from Slidegeeks makes it easy to present information on your topic with precision. It provides customization options, so you can make changes to the colors, design, graphics, or any other component to create a unique layout. It is also available for immediate download, so you can begin using it right away. Slidegeeks has done good research to ensure that you have everything you need to make your presentation stand out. Make a name out there for a brilliant performance.

Quality Assurance Indicator Dashboard Ppt PowerPoint Presentation Complete Deck With Slides
Share a great deal of information on the topic by deploying this Quality Assurance Indicator Dashboard Ppt PowerPoint Presentation Complete Deck With Slides. Support your ideas and thought process with this prefabricated set. It includes a set of Fifteen slides, all fully modifiable and editable. Each slide can be restructured and induced with the information and content of your choice. You can add or remove large content boxes as well, to make this PPT slideshow more personalized. Its high-quality graphics and visuals help in presenting a well-coordinated pitch. This PPT template is also a resourceful tool to take visual cues from and implement the best ideas to help your business grow and expand. The main attraction of this well-formulated deck is that everything is editable, giving you the freedom to adjust it to your liking and choice. Changes can be made in the background and theme as well to deliver an outstanding pitch. Therefore, click on the download button now to gain full access to this multifunctional set.
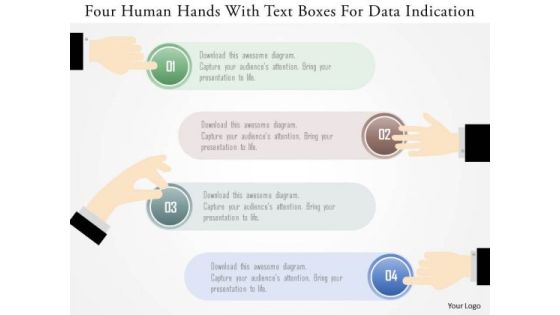
Business Diagram Four Human Hands With Text Boxes For Data Indication Ppt Template
Graphic of four human hands with text boxes are used to design this power point template. This PPT contains the concept of data indication. Use this PPT for your data related topics in any presentation.

Stock Photo Red Arrow Indicating Solution Path Of Maze Pwerpoint Slide
This conceptual image is designed with graphic of maze and arrow. In this image maze shows the concept of problem while arrow is reflecting the idea of solution. Build an innovative presentation for displaying the complexity of problem solving topic. Use this image for business, sales and marketing related presentations.
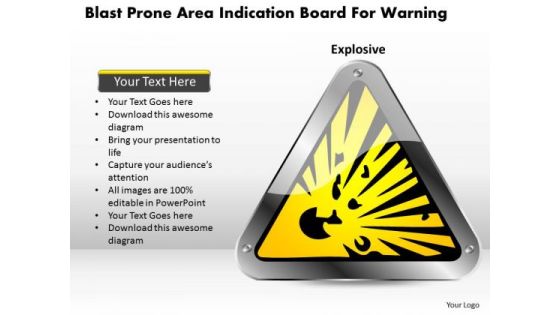
Business Diagram Blast Prone Area Indication Board For Warning Presentation Template
This Power Point template has been designed with graphic of warning symbol. This diagram contains the concept of warning sign for blast prone area. Use this diagram for warning and safety related topics.

Drug Indicator Extension In A Pharmaceuticals Company Case Competition Ppt PowerPoint Presentation Complete Deck With Slides
This complete presentation has PPT slides on wide range of topics highlighting the core areas of your business needs. It has professionally designed templates with relevant visuals and subject driven content. This presentation deck has total of fourty three slides. Get access to the customizable templates. Our designers have created editable templates for your convenience. You can edit the colour, text and font size as per your need. You can add or delete the content if required. You are just a click to away to have this ready made presentation. Click the download button now.

Calculate Facebook Key Performance Indicator Ppt PowerPoint Presentation Complete Deck With Slides
This complete deck acts as a great communication tool. It helps you in conveying your business message with personalized sets of graphics, icons etc. Comprising a set of eleven slides, this complete deck can help you persuade your audience. It also induces strategic thinking as it has been thoroughly researched and put together by our experts. Not only is it easily downloadable but also editable. The color, graphics, theme any component can be altered to fit your individual needs. So grab it now.

Case Competition Petroleum Sector Issues Key Performance Indicator To Track The Performance Of Oil And Gas Company Diagrams PDF
The slide provides the key performance indicators KPIs that might help to track the performance of oil and gas companies. Major KPIs include revenue, crude oil and natural gas production, number of rigs, workforce etc. Deliver and pitch your topic in the best possible manner with this case competition petroleum sector issues key performance indicator to track the performance of oil and gas company diagrams pdf. Use them to share invaluable insights on key performance indicator, revenue, 2017 to 2021 and impress your audience. This template can be altered and modified as per your expectations. So, grab it now.

Key Performance Indicator To Track The Performance Of Oil And Gas Company Ppt Ideas Graphics Design PDF
The slide provides the key performance indicators KPIs that might help to track the performance of oil and gas companies. Major KPIs include revenue, crude oil and natural gas production, number of rigs, workforce etc. Deliver an awe inspiring pitch with this creative key performance indicator to track the performance of oil and gas company ppt ideas graphics design pdf bundle. Topics like key performance indicator to track the performance of oil and gas company can be discussed with this completely editable template. It is available for immediate download depending on the needs and requirements of the user.

Drug Indicator Extension In A Pharmaceuticals Company Competitive Analysis Of SW Care Pharmaceutical Company 2021 Ideas PDF
This slide shows the competitive analysis of SW Care Pharmaceutical Company with other competitors, based on various parameters such as revenue, Treatment Type, Injection Frequency, RA Indication Launch, Drug Effectiveness etc. Deliver an awe inspiring pitch with this creative drug indicator extension in a pharmaceuticals company competitive analysis of sw care pharmaceutical company 2021 ideas pdf bundle. Topics like drug effectiveness, injection frequency, pharmaceutical companies, revenue can be discussed with this completely editable template. It is available for immediate download depending on the needs and requirements of the user.

Drug Indicator Extension In A Pharmaceuticals Company Current Issue For SW Care Pharmaceutical Company With Solution Slides PDF
This slide shows the current issue and problem of SW Care Pharmaceutical Company related to drug indication and its relative solution. This is a drug indicator extension in a pharmaceuticals company current issue for sw care pharmaceutical company with solution slides pdf template with various stages. Focus and dispense information on two stages using this creative set, that comes with editable features. It contains large content boxes to add your information on topics like current issue, solution. You can also showcase facts, figures, and other relevant content using this PPT layout. Grab it now.

Drug Indicator Extension In A Pharmaceuticals Company SWOT Analysis Of SW Care Pharmaceutical Company Opportunity Structure PDF
This slide shows some opportunities of SW Care Pharmaceutical Company that that can lead to growth in future such as expand indications of KEMICARE to redefine treatment, taking benefit of acquisition, new opportunities due to lenient government rules etc. Presenting drug indicator extension in a pharmaceuticals company swot analysis of sw care pharmaceutical company opportunity structure pdf to provide visual cues and insights. Share and navigate important information on one stages that need your due attention. This template can be used to pitch topics like opportunity. In addtion, this PPT design contains high resolution images, graphics, etc, that are easily editable and available for immediate download.

Drug Indicator Extension In A Pharmaceuticals Company SWOT Analysis Of SW Care Pharmaceutical Company Weaknesses Download PDF
This slide shows the weaknesses of SW Care Pharmaceutical Company that it must overcome such as limited drug indication, inefficient financial planning , limited investment in Research and Development, rigid organizational structure etc. This is a drug indicator extension in a pharmaceuticals company swot analysis of sw care pharmaceutical company weaknesses download pdf template with various stages. Focus and dispense information on one stages using this creative set, that comes with editable features. It contains large content boxes to add your information on topics like weakness. You can also showcase facts, figures, and other relevant content using this PPT layout. Grab it now.

Drug Indicator Extension In A Pharmaceuticals Company SWOT Analysis Of SW Care Pharmaceutical Company Threats Slides PDF
This slide shows some threats that may affect the company in future course of time and shrink its profit margins. Some potential threats are Intense Competition from Rivalries , new indications may be subject to government approval, various lawsuits in companys name, new and rigid environmental regulations etc. Presenting drug indicator extension in a pharmaceuticals company swot analysis of sw care pharmaceutical company threats slides pdf to provide visual cues and insights. Share and navigate important information on one stages that need your due attention. This template can be used to pitch topics like threats. In addtion, this PPT design contains high resolution images, graphics, etc, that are easily editable and available for immediate download.

Drug Indicator Extension In A Pharmaceuticals Company Selling Strategy To Be Implemented By SW Care Company Background PDF
This slide shows the Selling Strategy for KEMICARE that is to be implemented by SW Care Company in order to gain competitive edge. Selling Strategies options are Standard, Superior and Integrate Superior. Deliver an awe inspiring pitch with this creative drug indicator extension in a pharmaceuticals company selling strategy to be implemented by sw care company background pdf bundle. Topics like selling strategies, cumulative sales, cumulative selling expenses can be discussed with this completely editable template. It is available for immediate download depending on the needs and requirements of the user.

Drug Indicator Extension In A Pharmaceuticals Company Sensitivity Analysis Of SW Care Company For Selling And Manufacturing Strategies Graphics PDF
This slide shows the Sensitivity Analysis of SW Care Company with respect to Selling and Manufacturing Strategies. This slide provides information about type of Selling and Manufacturing Strategies, cumulative Sales, NPV etc. Deliver and pitch your topic in the best possible manner with this drug indicator extension in a pharmaceuticals company sensitivity analysis of sw care company for selling and manufacturing strategies graphics pdf. Use them to share invaluable insights on manufacturing strategies, net present value, cumulative selling expenses, selling strategies and impress your audience. This template can be altered and modified as per your expectations. So, grab it now.
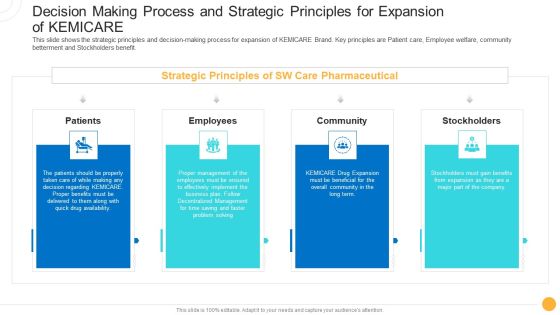
Drug Indicator Extension In A Pharmaceuticals Company Decision Making Process And Strategic Principles For Expansion Of KEMICARE Structure PDF
This slide shows the strategic principles and decision-making process for expansion of KEMICARE Brand. Key principles are Patient care, Employee welfare, community betterment and Stockholders benefit. Presenting drug indicator extension in a pharmaceuticals company decision making process and strategic principles for expansion of kemicare structure pdf to provide visual cues and insights. Share and navigate important information on four stages that need your due attention. This template can be used to pitch topics like patients, employees, community, stockholders. In addtion, this PPT design contains high resolution images, graphics, etc, that are easily editable and available for immediate download.

Drug Indicator Extension In A Pharmaceuticals Company SWOT Analysis Of SW Care Pharmaceutical Company Strengths Elements PDF
This slide shows the strengths of SW Care Pharmaceutical that it has over its competitors such as high Brand Reputation, Acquisitions, Revolutionized Crohns Disease Treatment etc. This is a drug indicator extension in a pharmaceuticals company swot analysis of sw care pharmaceutical company strengths elements pdf template with various stages. Focus and dispense information on one stages using this creative set, that comes with editable features. It contains large content boxes to add your information on topics like strengths. You can also showcase facts, figures, and other relevant content using this PPT layout. Grab it now.
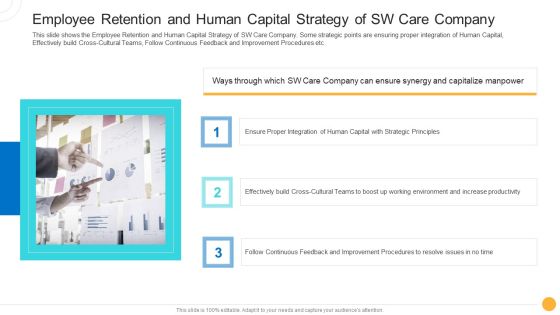
Drug Indicator Extension In A Pharmaceuticals Company Employee Retention And Human Capital Strategy Of SW Care Company Download PDF
This slide shows the Employee Retention and Human Capital Strategy of SW Care Company. Some strategic points are ensuring proper. This is a drug indicator extension in a pharmaceuticals company employee retention and human capital strategy of sw care company download pdf template with various stages. Focus and dispense information on three stages using this creative set, that comes with editable features. It contains large content boxes to add your information on topics like strategic, effectively, continuous, improvement. You can also showcase facts, figures, and other relevant content using this PPT layout. Grab it now.
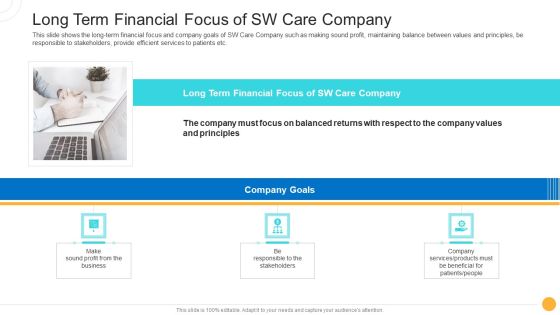
Drug Indicator Extension In A Pharmaceuticals Company Long Term Financial Focus Of SW Care Company Background PDF
This slide shows the long-term financial focus and company goals of SW Care Company such as making sound profit, maintaining balance between values and principles, be responsible to stakeholders, provide efficient services to patients etc. Presenting drug indicator extension in a pharmaceuticals company long term financial focus of sw care company background pdf to provide visual cues and insights. Share and navigate important information on three stages that need your due attention. This template can be used to pitch topics like business, services, values. In addtion, this PPT design contains high resolution images, graphics, etc, that are easily editable and available for immediate download.

Drug Indicator Extension In A Pharmaceuticals Company Estimated Positive Impact Of SW Care Company Strategies On The Patients Elements PDF
This slide shows the future impact of strategies adopted by SW Care Company with respect to patient treated in the coming years along with key takeaways. Deliver an awe inspiring pitch with this creative drug indicator extension in a pharmaceuticals company estimated positive impact of sw care company strategies on the patients elements pdf bundle. Topics like estimated positive impact of sw care company strategies on the patients can be discussed with this completely editable template. It is available for immediate download depending on the needs and requirements of the user.

Drug Indicator Extension In A Pharmaceuticals Company Financial Results Of SW Care Company After Implementing Strategies Designs PDF
This slide shows the Financial Results of SW Care Company after implementing Strategies in terms of increasing Net Income and Revenue over the coming years. Deliver and pitch your topic in the best possible manner with this drug indicator extension in a pharmaceuticals company financial results of sw care company after implementing strategies designs pdf. Use them to share invaluable insights on revenue, net income and impress your audience. This template can be altered and modified as per your expectations. So, grab it now.

Drug Indicator Extension In A Pharmaceuticals Company Marketing And Advertising Strategy Of SW Care Company Themes PDF
This slide shows the Marketing and Advertising Strategy that is to be implemented by SW Care Company i.e. DTC Direct to Consumer Advertising Strategy along with some general statistics and information about physicians and patients priority. Deliver an awe inspiring pitch with this creative drug indicator extension in a pharmaceuticals company marketing and advertising strategy of sw care company themes pdf bundle. Topics like effective, engagement, strategic, implementing, marketing can be discussed with this completely editable template. It is available for immediate download depending on the needs and requirements of the user.
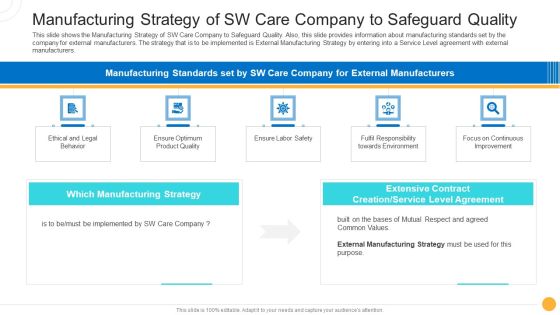
Drug Indicator Extension In A Pharmaceuticals Company Manufacturing Strategy Of SW Care Company To Safeguard Quality Brochure PDF
This slide shows the Manufacturing Strategy of SW Care Company to Safeguard Quality. Also, this slide provides information about manufacturing standards set by the company for external manufacturers. The strategy that is to be implemented is External Manufacturing Strategy by entering into a Service Level agreement with external manufacturers. Presenting drug indicator extension in a pharmaceuticals company manufacturing strategy of sw care company to safeguard quality brochure pdf to provide visual cues and insights. Share and navigate important information on five stages that need your due attention. This template can be used to pitch topics like ethical and legal behavior, optimum product quality, labor safety, responsibility environment, continuous improvement. In addtion, this PPT design contains high resolution images, graphics, etc, that are easily editable and available for immediate download.

Drug Indicator Extension In A Pharmaceuticals Company Product Development Strategy Of SW Care Pharmaceutical Company Guidelines PDF
This slide shows the product development strategy of SW Care Pharmaceutical Company based on 2 diseases that are Crohns Disease and Rheumatoid Arthritis. This slide also provides some information on opportunities that are available with the company to capture more market share for its brand KEMICARE. Presenting drug indicator extension in a pharmaceuticals company product development strategy of sw care pharmaceutical company guidelines pdf to provide visual cues and insights. Share and navigate important information on three stages that need your due attention. This template can be used to pitch topics like crohns disease, rheumatoid arthritis, ulcerative colitis, product development strategy. In addtion, this PPT design contains high resolution images, graphics, etc, that are easily editable and available for immediate download.
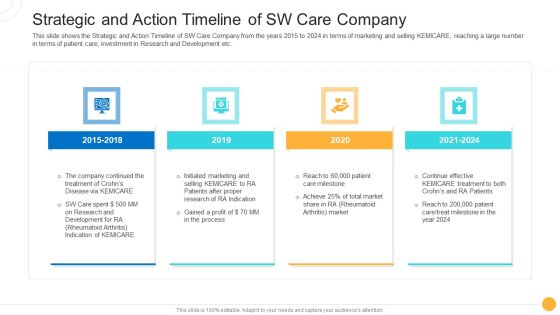
Drug Indicator Extension In A Pharmaceuticals Company Strategic And Action Timeline Of SW Care Company Ideas PDF
This slide shows the Strategic and Action Timeline of SW Care Company from the years 2015 to 2024 in terms of marketing and selling KEMICARE, reaching a large number in terms of patient care, investment in Research and Development etc. This is a drug indicator extension in a pharmaceuticals company strategic and action timeline of sw care company ideas pdf template with various stages. Focus and dispense information on four stages using this creative set, that comes with editable features. It contains large content boxes to add your information on topics like development, process, initiated marketing, continue effective. You can also showcase facts, figures, and other relevant content using this PPT layout. Grab it now.

Key Findings Ppt PowerPoint Presentation Complete Deck With Slides
This is a key findings ppt powerpoint presentation complete deck with slides. This is a one stage process. The stages in this process are key findings, management, planning, business, analysis.
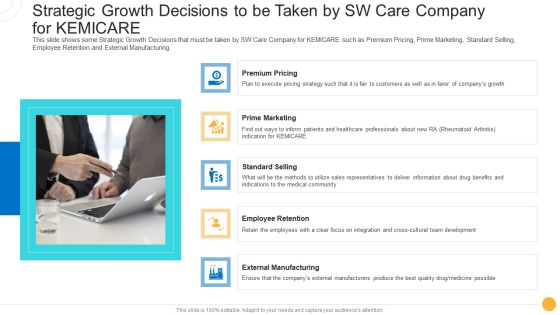
Drug Indicator Extension In A Pharmaceuticals Company Strategic Growth Decisions To Be Taken By SW Care Company For KEMICARE Download PDF
This slide shows some Strategic Growth Decisions that must be taken by SW Care Company for KEMICARE such as Premium Pricing, Prime Marketing, Standard Selling, Employee Retention and External Manufacturing. This is a drug indicator extension in a pharmaceuticals company strategic growth decisions to be taken by sw care company for kemicare download pdf template with various stages. Focus and dispense information on five stages using this creative set, that comes with editable features. It contains large content boxes to add your information on topics like premium pricing, prime marketing, standard selling, employee retention, external manufacturing. You can also showcase facts, figures, and other relevant content using this PPT layout. Grab it now.
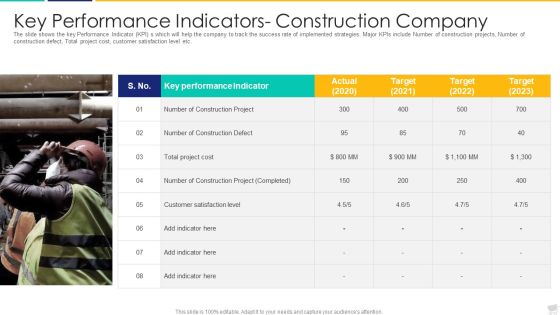
Key Performance Indicators- Construction Company Formats PDF
The slide shows the key Performance Indicator KPI s which will help the company to track the success rate of implemented strategies. Major KPIs include Number of construction projects, Number of construction defect, Total project cost, customer satisfaction level etc.Deliver an awe inspiring pitch with this creative key performance indicators construction company formats pdf bundle. Topics like construction project, customer satisfaction, performance indicator can be discussed with this completely editable template. It is available for immediate download depending on the needs and requirements of the user.
Finance Management Metrics Ppt Slide Templates
This is a finance management metrics ppt slide templates. This is a nine stage process. The stages in this process are business, marketing, management, table.

Key Metrics For Business Leadership Team Ppt Diagrams
This is a key metrics for business leadership team ppt diagrams. This is a five stage process. The stages in this process are kpi.
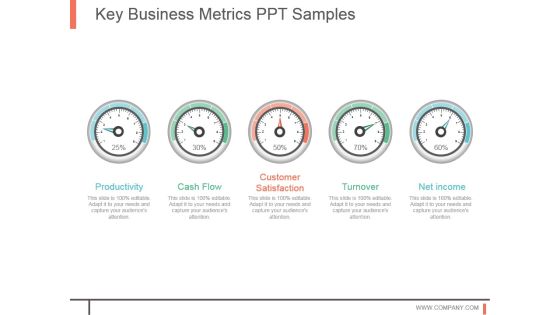
Key Business Metrics Ppt Samples
This is a key business metrics ppt samples. This is a five stage process. The stages in this process are productivity, cash flow, customer satisfaction, turnover, net income.

Balanced Scorecard Kpi S Ppt Slide Examples
This is a balanced scorecard kpi s ppt slide examples. This is a four stage process. The stages in this process are learning and growth, customer, financial, internal business processes.

Customer Satisfaction Framework Ppt Slide
This is a customer satisfaction framework ppt slide. This is a seven stage process. The stages in this process are task items, item.

Business Performance Measures Powerpoint Slide
This is a business performance measures powerpoint slide designs. This is a three stage process. The stages in this process are business, marketing, performance, presentation, management.
 Home
Home