Indicators

Utilizing Neuromarketing Techniques Post Implementation Impact Ppt Styles Example Introduction PDF
This slide represents performance indicators showcasing impact of neuromarketing on brand growth. It covers lead generation, customer traffic, profit margin etc. There are so many reasons you need a Utilizing Neuromarketing Techniques Post Implementation Impact Ppt Styles Example Introduction PDF. The first reason is you cant spend time making everything from scratch, Thus, Slidegeeks has made presentation templates for you too. You can easily download these templates from our website easily.

Creating Transaction Monitoring Transaction Monitoring And Fraud Detection Software Summary PDF
This slide illustrates transaction monitoring and fraud detection software framework. It provides information about command, control, dashboards, key performance indicators KPIs, risk score, real time detection, sanction screening, etc. There are so many reasons you need a Creating Transaction Monitoring Transaction Monitoring And Fraud Detection Software Summary PDF. The first reason is you cant spend time making everything from scratch, Thus, Slidegeeks has made presentation templates for you too. You can easily download these templates from our website easily.

Key Kpis To Measure Sustainability At Organization Icons PDF
This slide highlights various performance indicators to measure sustainability performance at workplace to monitor and track practices. It includes key components such as environmental KPIs, social KPIs and economic KPIs. Presenting Key Kpis To Measure Sustainability At Organization Icons PDF to dispense important information. This template comprises three stages. It also presents valuable insights into the topics including Environmental, Social, Economic. This is a completely customizable PowerPoint theme that can be put to use immediately. So, download it and address the topic impactfully.
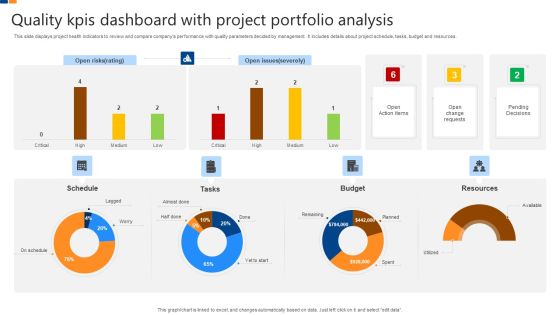
Quality Kpis Dashboard With Project Portfolio Analysis Download PDF
This slide displays project health indicators to review and compare companys performance with quality parameters decided by management. It includes details about project schedule, tasks, budget and resources. Showcasing this set of slides titled Quality Kpis Dashboard With Project Portfolio Analysis Download PDF. The topics addressed in these templates are Schedule, Tasks, Budget, Resources. All the content presented in this PPT design is completely editable. Download it and make adjustments in color, background, font etc. as per your unique business setting.

Content Advertising Campaign Measuring Campaign Results Background PDF
This slide provides an overview of the dashboard depicting performance indicators used to measure success of the campaign. Metrics covered are page views, new visitors, social shares, CTR, blog subscribers, conversion, new blog subscribers, etc. There are so many reasons you need a Content Advertising Campaign Measuring Campaign Results Background PDF. The first reason is you cannot spend time making everything from scratch, Thus, Slidegeeks has made presentation templates for you too. You can easily download these templates from our website easily.
Project Management Tracking Dashboard To Review Decision Download PDF
The below slide depicts the key performing indicators in project decision making. It includes elements such as overall status, progress, progress, time, cost and work volume. Pitch your topic with ease and precision using this Project Management Tracking Dashboard To Review Decision Download PDF. This layout presents information on Progress, Activity Status, Overall Status. It is also available for immediate download and adjustment. So, changes can be made in the color, design, graphics or any other component to create a unique layout.

Managing Hybrid Waterfall Business Approach Project Dashboard Summary PDF
This slide illustrates agile key performance indicators for individual sprints. It includes tasks, story points, bugs, burndown charts, statistics etc. Showcasing this set of slides titled Managing Hybrid Waterfall Business Approach Project Dashboard Summary PDF. The topics addressed in these templates are Tasks, Story Points, Bugs. All the content presented in this PPT design is completely editable. Download it and make adjustments in color, background, font etc. as per your unique business setting.
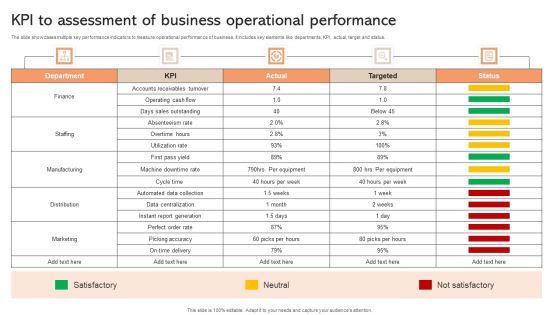
KPI To Assessment Of Business Operational Performance Brochure PDF
The slide showcases multiple key performance indicators to measure operational performance of business. It includes key elements like departments, KPI, actual, target and status. Showcasing this set of slides titled KPI To Assessment Of Business Operational Performance Brochure PDF. The topics addressed in these templates are Satisfactory, Neutral, Not Satisfactory. All the content presented in this PPT design is completely editable. Download it and make adjustments in color, background, font etc. as per your unique business setting.
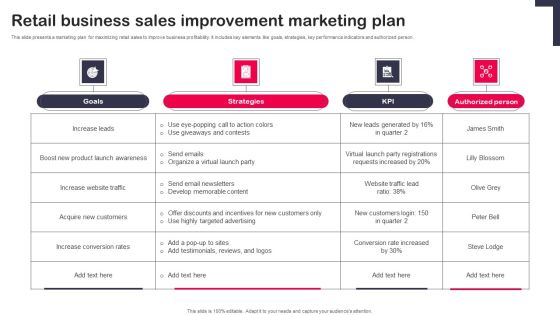
Retail Business Sales Improvement Marketing Plan Guidelines PDF
This slide presents a marketing plan for maximizing retail sales to improve business profitability. It includes key elements like goals, strategies, key performance indicators and authorized person. Pitch your topic with ease and precision using this Retail Business Sales Improvement Marketing Plan Guidelines PDF. This layout presents information on Goals, Strategies, Authorized Person. It is also available for immediate download and adjustment. So, changes can be made in the color, design, graphics or any other component to create a unique layout.
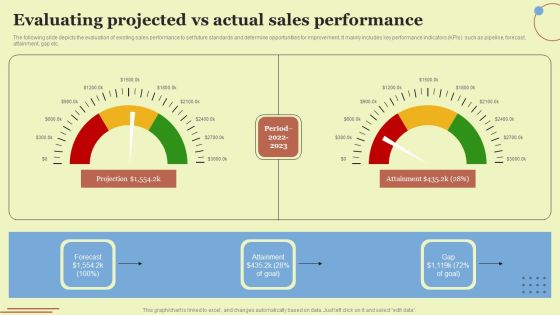
Evaluating Projected Vs Actual Sales Performance Diagrams PDF
The following slide depicts the evaluation of existing sales performance to set future standards and determine opportunities for improvement. It mainly includes key performance indicators KPIs such as pipeline, forecast, attainment, gap etc. There are so many reasons you need a Evaluating Projected Vs Actual Sales Performance Diagrams PDF. The first reason is you can not spend time making everything from scratch, Thus, Slidegeeks has made presentation templates for you too. You can easily download these templates from our website easily.

Business Sales Optimization Advertisement Campaign Kpis To Track Success Of Email Marketing Campaign Guidelines PDF
This slide showcases improvement in performance indicators post advertising campaign. The metrics covered are email ROI, open, clickthrough, bounce and unsubscribe rate. There are so many reasons you need a Business Sales Optimization Advertisement Campaign Kpis To Track Success Of Email Marketing Campaign Guidelines PDF. The first reason is you cannot spend time making everything from scratch, Thus, Slidegeeks has made presentation templates for you too. You can easily download these templates from our website easily.

Enterprise Cyber Risk Management Dashboard Sample PDF
This slide represents the key metrics dashboard representing details related to management of cyber security incidents by an enterprise. It includes key performance indicators such as risk analysis progress, risk rating breakdown etc. There are so many reasons you need a Enterprise Cyber Risk Management Dashboard Sample PDF. The first reason is you cannot spend time making everything from scratch, Thus, Slidegeeks has made presentation templates for you too. You can easily download these templates from our website easily.
Performance Tracking Kpi Dashboard For Digital Marketing Strategy Ppt Styles Templates PDF
Mentioned slide provides information about the key performance indicators that can be used by managers to measure the success of digital marketing strategy, KPIs covered are status, progress, priority and timeline. There are so many reasons you need a Performance Tracking Kpi Dashboard For Digital Marketing Strategy Ppt Styles Templates PDF. The first reason is you can not spend time making everything from scratch, Thus, Slidegeeks has made presentation templates for you too. You can easily download these templates from our website easily.

Managers Scorecard For Online Business Structure PDF
This slide depicts balanced scorecard used by e businesses for efficient management. It includes objectives and goals needed to be achieved, initiatives taken for the same and indicators to track progress. Showcasing this set of slides titled Managers Scorecard For Online Business Structure PDF. The topics addressed in these templates are Focus Areas, Business, Objectives. All the content presented in this PPT design is completely editable. Download it and make adjustments in color, background, font etc. as per your unique business setting.
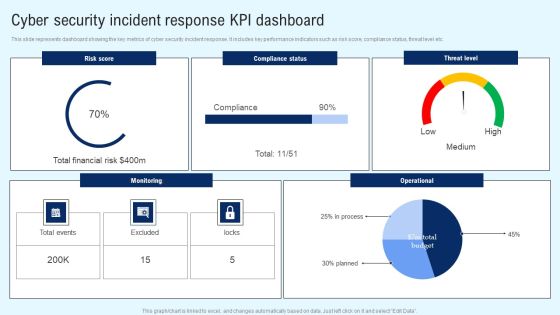
Implementing Cyber Security Incident Cyber Security Incident Response KPI Dashboard Clipart PDF
This slide represents dashboard showing the key metrics of cyber security incident response. It includes key performance indicators such as risk score, compliance status, threat level etc. There are so many reasons you need a Implementing Cyber Security Incident Cyber Security Incident Response KPI Dashboard Clipart PDF. The first reason is you cannot spend time making everything from scratch, Thus, Slidegeeks has made presentation templates for you too. You can easily download these templates from our website easily.
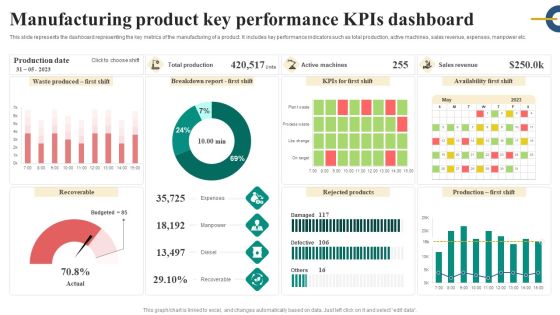
Manufacturing Product Key Performance Kpis Dashboard Inspiration PDF
This slide represents the dashboard representing the key metrics of the manufacturing of a product. It includes key performance indicators such as total production, active machines, sales revenue, expenses, manpower etc. Showcasing this set of slides titled Manufacturing Product Key Performance Kpis Dashboard Inspiration PDF. The topics addressed in these templates are Expenses, Manpower, Diesel, Recoverable. All the content presented in this PPT design is completely editable. Download it and make adjustments in color, background, font etc. as per your unique business setting.
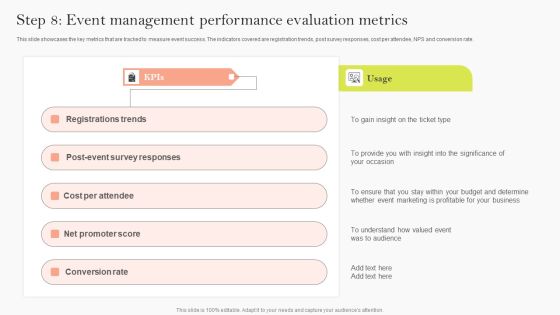
Step 8 Event Management Performance Evaluation Metrics Ppt Gallery Designs Download PDF
This slide showcases the key metrics that are tracked to measure event success. The indicators covered are registration trends, post survey responses, cost per attendee, NPS and conversion rate. There are so many reasons you need a Step 8 Event Management Performance Evaluation Metrics Ppt Gallery Designs Download PDF. The first reason is you can not spend time making everything from scratch, Thus, Slidegeeks has made presentation templates for you too. You can easily download these templates from our website easily.

Step 8 Event Management Performance Evaluation Metrics Inspiration PDF
This slide showcases the key metrics that are tracked to measure event success. The indicators covered are registration trends, post survey responses, cost per attendee, NPS and conversion rate. There are so many reasons you need a Step 8 Event Management Performance Evaluation Metrics Inspiration PDF. The first reason is you can not spend time making everything from scratch, Thus, Slidegeeks has made presentation templates for you too. You can easily download these templates from our website easily.
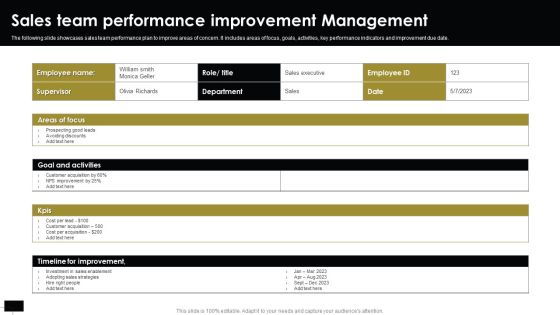
Sales Team Performance Improvement Management Brochure PDF
The following slide showcases sales team performance plan to improve areas of concern. It includes areas of focus, goals, activities, key performance indicators and improvement due date. Showcasing this set of slides titled Sales Team Performance Improvement Management Brochure PDF. The topics addressed in these templates are Customer Acquisition, Goal And Activities, Sales Strategies. All the content presented in this PPT design is completely editable. Download it and make adjustments in color, background, font etc. as per your unique business setting.

Purpose And Scope Of Data Enablement Framework Platform Demonstration PDF
This slide illustrates purpose, key performance indicators and scope of data enablement platform. It includes system reliability, data self service adoption, etc. Presenting Purpose And Scope Of Data Enablement Framework Platform Demonstration PDF to dispense important information. This template comprises three stages. It also presents valuable insights into the topics including Data Enablement Purpose, Data Enablement Kpis, Data Enablement Scope. This is a completely customizable PowerPoint theme that can be put to use immediately. So, download it and address the topic impactfully.

Shiny Bar Graph Business PowerPoint Template 0910
Shiny colorful abstract bar graph indicating growth
Online Risk Management Dashboard For Tracking Threats And Attacks Icons PDF
The purpose of this slide is to represent dashboard to monitor risks and cyber threats for efficient risk management. It includes various types of key performance indicators such as types of risks, severities, sources and risk meter. Showcasing this set of slides titled Online Risk Management Dashboard For Tracking Threats And Attacks Icons PDF. The topics addressed in these templates are Attack, Indication Severities, Sources. All the content presented in this PPT design is completely editable. Download it and make adjustments in color, background, font etc. as per your unique business setting.

Customer Decline Of Sales Analysis Dashboard Rules PDF
The following slide presents a key performance indicating dashboards that can be used by managers in order to analyse customer-lost sales. Major key performance indicators are lost deals rate, lost sales rate, customer data analytics, etc. Pitch your topic with ease and precision using this Customer Decline Of Sales Analysis Dashboard Rules PDF. This layout presents information on Customer Data Analytics. It is also available for immediate download and adjustment. So, changes can be made in the color, design, graphics or any other component to create a unique layout.
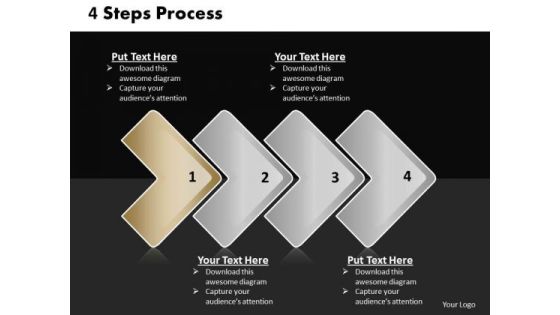
Ppt Direct Description Of 4 PowerPoint Slide Numbers Included A Task Templates
PPT direct description of 4 powerpoint slide numbers included a task Templates-Use above diagram to illustrate a stepwise process or a phase structure. Grab the attention of your team with this eye catching template presenting indicators of the path you have in mind. Use this diagram to enthuse your colleagues-PPT direct description of 4 powerpoint slide numbers included a task Templates-Aim, Arrow, Arrowheads, Badge, Border, Click, Connection, Curve, Design, Direction, Download, Element, Fuchsia, Icon, Illustration, Indicator, Internet, Magenta, Mark, Object, Orientation, Pointer, Shadow, Shape, Sign
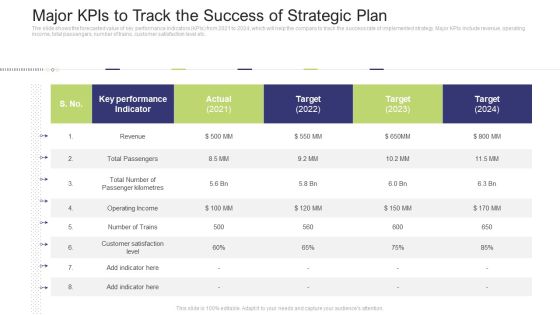
Major Kpis To Track The Success Of Strategic Plan Ideas PDF
The slide shows the forecasted value of key performance indicators KPIs from 2021 to 2024, which will help the company to track the success rate of implemented strategy. Major KPIs include revenue, operating income, total passengers, number of trains, customer satisfaction level etc.Deliver and pitch your topic in the best possible manner with this major kpis to track the success of strategic plan ideas pdf. Use them to share invaluable insights on key performance indicator, actual 2021 and impress your audience. This template can be altered and modified as per your expectations. So, grab it now.
Projection Of Major Kpis Related To Customer Onboarding Ppt Icon Example PDF
This slide provides the projections of key performance indicators KPIs related to customer onboarding. KPIs covered in this slide include number of customers, customer churn rate, customer retention rate etc. Deliver an awe-inspiring pitch with this creative projection of major kpis related to customer onboarding ppt icon example pdf. bundle. Topics like customer churn rate, customer retention rate, indicator, number of customers can be discussed with this completely editable template. It is available for immediate download depending on the needs and requirements of the user.

Projection Of Major Kpis Related To Customer Onboarding Ppt Infographic Template Designs Download PDF
This slide provides the projections of key performance indicators KPIs related to customer onboarding. KPIs covered in this slide include number of customers, customer churn rate, customer retention rate etc. Deliver and pitch your topic in the best possible manner with this projection of major kpis related to customer onboarding ppt infographic template designs download pdf. Use them to share invaluable insights on number of customers, customer churn rate, customer retention rate, indicator and impress your audience. This template can be altered and modified as per your expectations. So, grab it now.
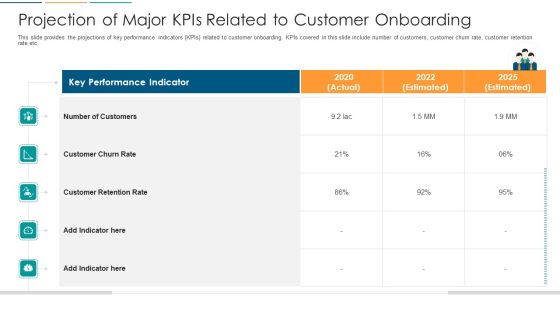
Projection Of Major Kpis Related To Customer Onboarding Ppt File Templates PDF
This slide provides the projections of key performance indicators KPIs related to customer onboarding. KPIs covered in this slide include number of customers, customer churn rate, customer retention rate etc. Deliver an awe-inspiring pitch with this creative projection of major kpis related to customer onboarding ppt file templates pdf. bundle. Topics like customer retention rate, customer churn rate, number of customers, key performance indicator can be discussed with this completely editable template. It is available for immediate download depending on the needs and requirements of the user.

User Onboarding Process Development Projection Of Major Kpis Related To Customer Onboarding Guidelines PDF
This slide provides the projections of key performance indicators KPIs related to customer onboarding. KPIs covered in this slide include number of customers, customer churn rate, customer retention rate etc. Deliver an awe-inspiring pitch with this creative User Onboarding Process Development Projection Of Major Kpis Related To Customer Onboarding Guidelines PDF bundle. Topics like customer churn rate, customer retention rate, key performance indicator can be discussed with this completely editable template. It is available for immediate download depending on the needs and requirements of the user.

Financial Forecast After Process Improvement Develop Organizational Productivity By Enhancing Business Process Brochure PDF
The slide provides the financial forecast of the company after the process improvement. Major KPIs key performance indicators covered in the slide are total revenue, interest income, number of customers, customer churn rate, online banking users, customer satisfaction rate etc. Deliver an awe inspiring pitch with this creative financial forecast after process improvement develop organizational productivity by enhancing business process brochure pdf bundle. Topics like revenue, interest income, performance indicator, actual, target can be discussed with this completely editable template. It is available for immediate download depending on the needs and requirements of the user.
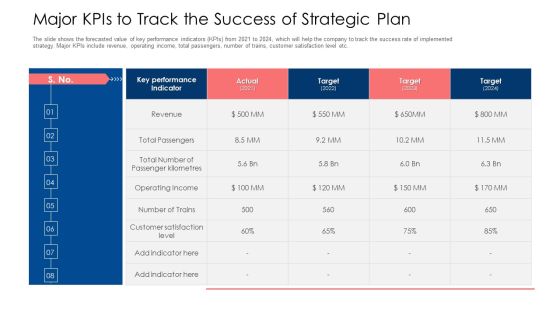
Major Kpis To Track The Success Of Strategic Plan Ppt Summary Influencers PDF
The slide shows the forecasted value of key performance indicators KPIs from 2021 to 2024, which will help the company to track the success rate of implemented strategy. Major KPIs include revenue, operating income, total passengers, number of trains, customer satisfaction level etc. Deliver an awe inspiring pitch with this creative major kpis to track the success of strategic plan ppt summary influencers pdf bundle. Topics like revenue, key performance indicator, target can be discussed with this completely editable template. It is available for immediate download depending on the needs and requirements of the user.
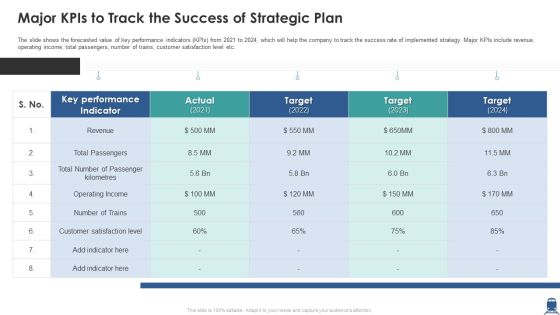
Major Kpis To Track The Success Of Strategic Plan Download PDF
The slide shows the forecasted value of key performance indicators KPIs from 2021 to 2024, which will help the company to track the success rate of implemented strategy. Major KPIs include revenue, operating income, total passengers, number of trains, customer satisfaction level etc. Deliver and pitch your topic in the best possible manner with this major kpis to track the success of strategic plan download pdf. Use them to share invaluable insights on revenue, key performance indicator, customer satisfaction level and impress your audience. This template can be altered and modified as per your expectations. So, grab it now.
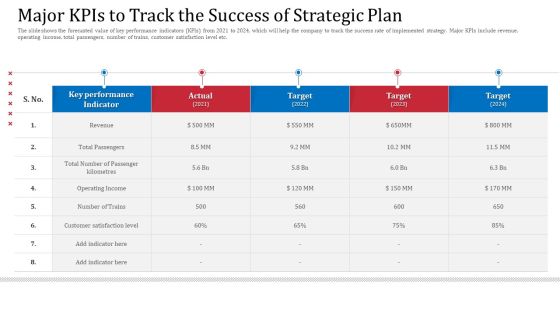
Major Kpis To Track The Success Of Strategic Plan Designs PDF
The slide shows the forecasted value of key performance indicators KPIs from 2021 to 2024, which will help the company to track the success rate of implemented strategy. Major KPIs include revenue, operating income, total passengers, number of trains, customer satisfaction level etc.Deliver an awe inspiring pitch with this creative major kpis to track the success of strategic plan designs pdf bundle. Topics like total passengers, operating income, performance indicator can be discussed with this completely editable template. It is available for immediate download depending on the needs and requirements of the user.
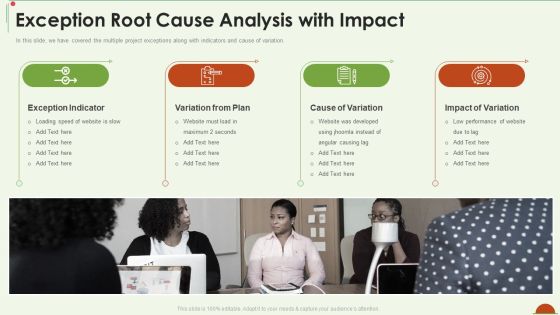
Project Management Under Supervision Exception Root Cause Analysis With Impact Topics PDF
In this slide, we have covered the multiple project exceptions along with indicators and cause of variation. Presenting project management under supervision exception root cause analysis with impact topics pdf to provide visual cues and insights. Share and navigate important information on four stages that need your due attention. This template can be used to pitch topics like exception indicator, variation from plan, cause of variation, impact of variation. In addtion, this PPT design contains high resolution images, graphics, etc, that are easily editable and available for immediate download.

Financial Fundamental Metrics Infrastructure Unit Costs Vs Target Benchmarks Ppt Professional Example PDF
These indicators assist IT leaders in stewarding technology expenditures and investments, and they are essential to managing the IT company. These measures aid in the management of the departments financial health and may indicate levers for cost reduction, improved resource allocation, and enhanced accountability. Deliver and pitch your topic in the best possible manner with this financial fundamental metrics infrastructure unit costs vs target benchmarks ppt professional example pdf. Use them to share invaluable insights on outsourcing, organizations, budget and impress your audience. This template can be altered and modified as per your expectations. So, grab it now.

Communicate Company Value To Your Stakeholders Financial Fundamental Metrics Graphics PDF
These indicators assist IT leaders in stewarding technology expenditures and investments, and they are essential to managing the IT company. These measures aid in the management of the departments financial health and may indicate levers for cost reduction, improved resource allocation, and enhanced accountability. Deliver and pitch your topic in the best possible manner with this communicate company value to your stakeholders financial fundamental metrics graphics pdf. Use them to share invaluable insights on organizations, budget, protect and impress your audience. This template can be altered and modified as per your expectations. So, grab it now.

How To Evaluate And Develop The Organizational Value Of IT Service Financial Fundamental Metrics Slides PDF
These indicators assist IT leaders in stewarding technology expenditures and investments, and they are essential to managing the IT company. These measures aid in the management of the departments financial health and may indicate levers for cost reduction, improved resource allocation, and enhanced accountability. Deliver and pitch your topic in the best possible manner with this how to evaluate and develop the organizational value of it service financial fundamental metrics slides pdf. Use them to share invaluable insights on organizations, budget, business, efficiency and impress your audience. This template can be altered and modified as per your expectations. So, grab it now.
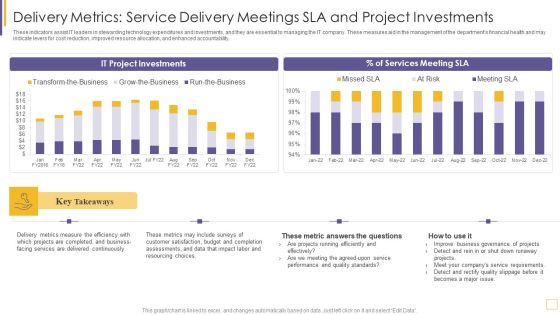
Guidelines For Exhibiting Business Value Of Information And Technology Delivery Metrics Service Portrait PDF
These indicators assist IT leaders in stewarding technology expenditures and investments, and they are essential to managing the IT company. These measures aid in the management of the departments financial health and may indicate levers for cost reduction, improved resource allocation, and enhanced accountability. Deliver and pitch your topic in the best possible manner with this guidelines for exhibiting business value of information and technology delivery metrics service portrait pdf. Use them to share invaluable insights on metrics measure, services, budget, resourcing and impress your audience. This template can be altered and modified as per your expectations. So, grab it now.

Guidelines For Exhibiting Business Value Of Information And Technology Financial Fundamental Metrics IT Spend Mockup PDF
These indicators assist IT leaders in stewarding technology expenditures and investments, and they are essential to managing the IT company. These measures aid in the management of the departments financial health and may indicate levers for cost reduction, improved resource allocation, and enhanced accountability. Deliver an awe inspiring pitch with this creative guidelines for exhibiting business value of information and technology financial fundamental metrics it spend mockup pdf bundle. Topics like metric, organizations, budget, demonstrate can be discussed with this completely editable template. It is available for immediate download depending on the needs and requirements of the user.

IT Value Story Significant To Corporate Leadership Financial Fundamental Metrics Diagrams PDF
These indicators assist IT leaders in stewarding technology expenditures and investments, and they are essential to managing the IT company. These measures aid in the management of the departments financial health and may indicate levers for cost reduction, improved resource allocation, and enhanced accountability. Deliver and pitch your topic in the best possible manner with this it value story significant to corporate leadership financial fundamental metrics diagrams pdf. Use them to share invaluable insights on organizations, budget, metric, cost and impress your audience. This template can be altered and modified as per your expectations. So, grab it now.
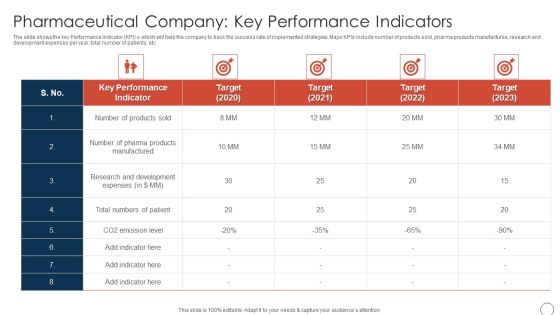
Pharmaceutical Company Key Performance Obtaining Sustainability Growing Pharmaceutical Organization Slides PDF
The slide shows the key Performance Indicator KPI s which will help the company to track the success rate of implemented strategies. Major KPIs include number of products sold, pharma products manufactures, research and development expenses per year, total number of patients, etc Deliver and pitch your topic in the best possible manner with this pharmaceutical company key performance obtaining sustainability growing pharmaceutical organization slides pdf. Use them to share invaluable insights on pharmaceutical company key performance indicators and impress your audience. This template can be altered and modified as per your expectations. So, grab it now.

Corporate Physical Health And Fitness Culture Playbook Health And Fitness Program Overall Portrait PDF
Following slide highlights an employees overall performance summary after completing health and fitness program. Performance indicators covered in the slide are physical activity, sleep, stress management, water intake and emotions. Deliver an awe inspiring pitch with this creative corporate physical health and fitness culture playbook health and fitness program overall portrait pdf bundle. Topics like tims performance summary indicates, physical activity, nutrition management can be discussed with this completely editable template. It is available for immediate download depending on the needs and requirements of the user.
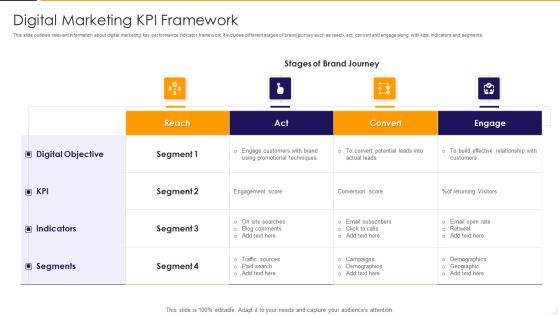
Digital Marketing KPI Framework Ppt PowerPoint Presentation File Slides PDF
This slide outlines relevant information about digital marketing key performance indicator framework. It includes different stages of brand journey such as reach, act, convert and engage along with kips, indicators and segments. Pitch your topic with ease and precision using this digital marketing kpi framework ppt powerpoint presentation file slides pdf This layout presents information on techniques, demographics, customers It is also available for immediate download and adjustment. So, changes can be made in the color, design, graphics or any other component to create a unique layout.

KPI Framework For Fast Moving Consumer Goods Ppt PowerPoint Presentation File Show PDF
The below mentioned slide highlights key performance indicator framework for measuring fast moving consumer goods. This includes indicators like out of stock, supply chain cost, carrying cost of inventory and average time taken to sell the goods to the ultimate consumers. Pitch your topic with ease and precision using this kpi framework for fast moving consumer goods ppt powerpoint presentation file show pdf This layout presents information on average, stock rate, cost It is also available for immediate download and adjustment. So, changes can be made in the color, design, graphics or any other component to create a unique layout.
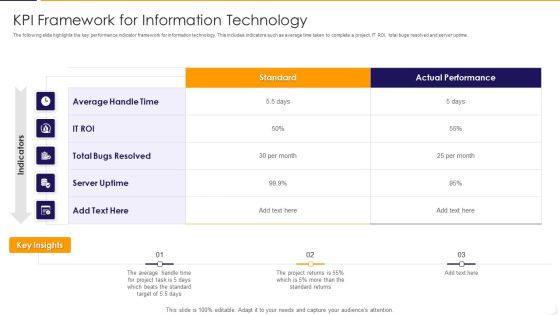
KPI Framework For Information Technology Ppt PowerPoint Presentation Gallery Clipart Images PDF
The following slide highlights the key performance indicator framework for information technology. This includes indicators such as average time taken to complete a project, IT ROI, total bugs resolved and server uptime. Showcasing this set of slides titled kpi framework for information technology ppt powerpoint presentation gallery clipart images pdf The topics addressed in these templates are average, target, performance All the content presented in this PPT design is completely editable. Download it and make adjustments in color, background, font etc. as per your unique business setting.
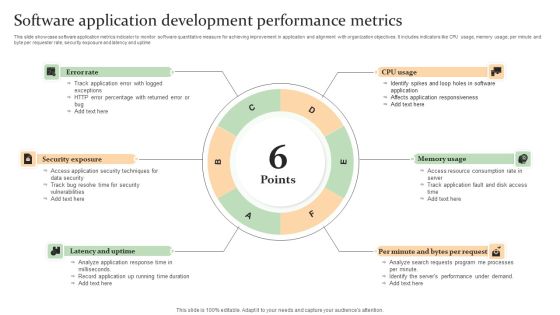
Software Application Development Performance Metrics Mockup PDF
This slide showcase software application metrics indicator to monitor software quantitative measure for achieving improvement in application and alignment with organization objectives. It includes indicators like CPU usage, memory usage, per minute and byte per requester rate, security exposure and latency and uptime Persuade your audience using this Software Application Development Performance Metrics Mockup PDF. This PPT design covers Six stages, thus making it a great tool to use. It also caters to a variety of topics including Latency And Uptime, Memory Usage, Security Exposure . Download this PPT design now to present a convincing pitch that not only emphasizes the topic but also showcases your presentation skills.

Inventory Stock Out And Decline Of Sales Analysis Dashboard Inspiration PDF
Following slide presents a key performance indicating dashboard that can be used by businesses to track Inventory stock out and lost sales. Major key performance indicators are percentage stockouts, amount of sales, lost sales accountability, etc. Pitch your topic with ease and precision using this Inventory Stock Out And Decline Of Sales Analysis Dashboard Inspiration PDF. This layout presents information on Lost Sales Summary, Stock Out Details It is also available for immediate download and adjustment. So, changes can be made in the color, design, graphics or any other component to create a unique layout.

Key Customer Satisfaction Index Strategy For Experience Upgradation In Automotive Industry Download PDF
Following slide provides information regarding customer satisfaction index improvement employed by automotive organizations for business upliftment and value creation. Essential approaches, action steps, key performing indicators and outcome are the elements demonstrated in this slide. Showcasing this set of slides titled Key Customer Satisfaction Index Strategy For Experience Upgradation In Automotive Industry Download PDF. The topics addressed in these templates are Understand Buyer Journey, Prioritize Customers. All the content presented in this PPT design is completely editable. Download it and make adjustments in color, background, font etc. as per your unique business setting.
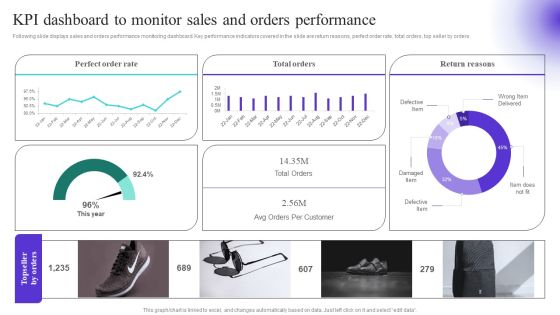
KPI Dashboard To Monitor Sales And Orders Performance Diagrams PDF
Following slide displays sales and orders performance monitoring dashboard. Key performance indicators covered in the slide are return reasons, perfect order rate, total orders, top seller by orders. Create an editable KPI Dashboard To Monitor Sales And Orders Performance Diagrams PDF that communicates your idea and engages your audience. Whether you are presenting a business or an educational presentation, pre designed presentation templates help save time. KPI Dashboard To Monitor Sales And Orders Performance Diagrams PDF is highly customizable and very easy to edit, covering many different styles from creative to business presentations. Slidegeeks has creative team members who have crafted amazing templates. So, go and get them without any delay.

Automated Dashboard To Track Status Of Order Request Themes PDF
The following slide highlights automated dashboard which can be used to track the status of pleased orders, and manage the inventory across various outlets. The key performance indicators are order, summary, inventory, summary, cost of goods sold, financial statement. Showcasing this set of slides titled Automated Dashboard To Track Status Of Order Request Themes PDF. The topics addressed in these templates are Inventory Value, Inventory Summary, Cost. All the content presented in this PPT design is completely editable. Download it and make adjustments in color, background, font etc. as per your unique business setting.

Tactical Brand Extension Launching Kpi Dashboard To Monitor Sales And Orders Formats PDF
Following slide displays sales and orders performance monitoring dashboard. Key performance indicators covered in the slide are return reasons, perfect order rate, total orders, top seller by orders. From laying roadmaps to briefing everything in detail, our templates are perfect for you. You can set the stage with your presentation slides. All you have to do is download these easy-to-edit and customizable templates. Tactical Brand Extension Launching Kpi Dashboard To Monitor Sales And Orders Formats PDF will help you deliver an outstanding performance that everyone would remember and praise you for. Do download this presentation today.
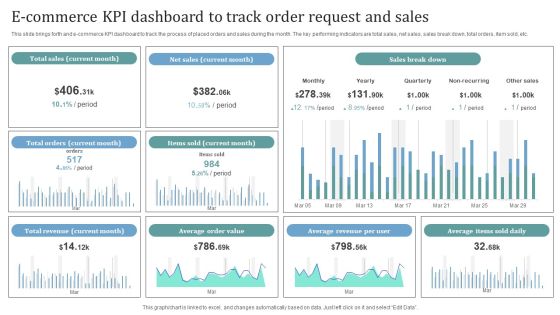
E Commerce KPI Dashboard To Track Order Request And Sales Introduction PDF
This slide brings forth and e commerce KPI dashboard to track the process of placed orders and sales during the month. The key performing indicators are total sales, net sales, sales break down, total orders, item sold, etc. Showcasing this set of slides titled E Commerce KPI Dashboard To Track Order Request And Sales Introduction PDF. The topics addressed in these templates are Total Sales, Net Sales, Sales Break Down. All the content presented in this PPT design is completely editable. Download it and make adjustments in color, background, font etc. as per your unique business setting.

Business Unit Valuation And Development Dashboard Ppt Professional Graphic Tips PDF
This slide shows key performance indicators dashboard which represents number of assets along with their stages of development. It also includes estimated development cost and production index comparison. Pitch your topic with ease and precision using this Business Unit Valuation And Development Dashboard Ppt Professional Graphic Tips PDF. This layout presents information on Estimated Development Cost, Production Index, Development Stage. It is also available for immediate download and adjustment. So, changes can be made in the color, design, graphics or any other component to create a unique layout.

Automation Project Status Dashboard Of Consulting Firm Report Background PDF
This slide showcases project status dashboard that provides a concise visual of key indicators progress and allow to compare actual performance with pre-built objectives. Key metrics covered are cost performance, time v or s project phase, timeline v or s resource capacity. Showcasing this set of slides titled Automation Project Status Dashboard Of Consulting Firm Report Background PDF. The topics addressed in these templates are Project Phase, Planned Value, Cost Performance Index. All the content presented in this PPT design is completely editable. Download it and make adjustments in color, background, font etc. as per your unique business setting.

Consumer Partition Dashboard For Email Campaigns Infographics PDF
The following slide depicts a dashboard which can be used by marketers for sending targeted mails to customers and enhance customer retention. The key performing indicators are number of customers, average value or orders, number of orders, top ten percent customers etc. Showcasing this set of slides titled Consumer Partition Dashboard For Email Campaigns Infographics PDF. The topics addressed in these templates are Average Life Time Value, Average Value Of Orders, Returns, Average Number Of Orders. All the content presented in this PPT design is completely editable. Download it and make adjustments in color, background, font etc. as per your unique business setting.

Event Logistic Plan Kpis With Expected Outcome Infographics PDF
This slide showcases important key performance indicators of supply chain also essential for event planning. It includes order management, supply, inventory and distribution.Persuade your audience using this Event Logistic Plan Kpis With Expected Outcome Infographics PDF This PPT design covers four stages, thus making it a great tool to use. It also caters to a variety of topics including Order Management, Inventory Turnover, Distribution Download this PPT design now to present a convincing pitch that not only emphasizes the topic but also showcases your presentation skills.

Supply Chain Management Analyzing Impact Of Iot On Major Logistics Kpis Information PDF
The following slide showcases impact analysis of IoT on major logistics key performance indicators KPIs. It provides information about shipping time, order accuracy, average customer satisfaction rate, lead time, capacity utilization, etc. Deliver and pitch your topic in the best possible manner with this Supply Chain Management Analyzing Impact Of Iot On Major Logistics Kpis Information PDF. Use them to share invaluable insights on Shipping Time, Order Accuracy, Lead Time and impress your audience. This template can be altered and modified as per your expectations. So, grab it now.

Supply Chain Strategic Planning Dashboard Showing Shipping Status Structure PDF
This slide showcase supply chain planning dashboard showing shipping status which includes orders, present data, worldwide financial levels, monthly key performance indicators KPIs, etc. This can be beneficial for order management department for efficient delivery of products. Showcasing this set of slides titled Supply Chain Strategic Planning Dashboard Showing Shipping Status Structure PDF. The topics addressed in these templates are Worldwide Financial Levels, Present Data, Customer. All the content presented in this PPT design is completely editable. Download it and make adjustments in color, background, font etc. as per your unique business setting.

Decreased Shipping And Logistics Management Performance Efficiency Slides PDF
This slide covers the reasons why company wants to implement automation in business as current shipping and Logistics Management System Efficiency is decreasing compared for 3 years. Some indicators are order accuracy rate, on time delivery, average cycle time , inventory accuracy, perfect order rate, overall integrated logistics efficiency etc. Deliver an awe inspiring pitch with this creative Decreased Shipping And Logistics Management Performance Efficiency Slides PDF bundle. Topics like Accuracy Rate, Inventory, Average can be discussed with this completely editable template. It is available for immediate download depending on the needs and requirements of the user.
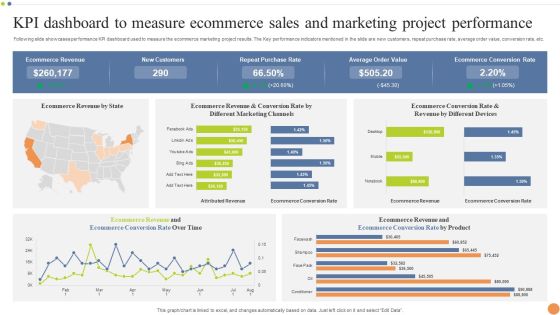
KPI Dashboard To Measure Ecommerce Sales And Marketing Project Performance Portrait PDF
Following slide showcases performance KPI dashboard used to measure the ecommerce marketing project results. The Key performance indicators mentioned in the slide are new customers, repeat purchase rate, average order value, conversion rate, etc. Pitch your topic with ease and precision using this KPI Dashboard To Measure Ecommerce Sales And Marketing Project Performance Portrait PDF. This layout presents information on Purchase Rate, Average Order Value, Ecommerce Conversion Rate. It is also available for immediate download and adjustment. So, changes can be made in the color, design, graphics or any other component to create a unique layout.
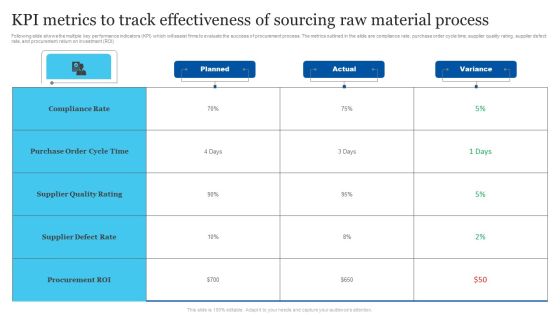
KPI Metrics To Track Effectiveness Of Sourcing Raw Material Process Portrait PDF
Following slide shows the multiple key performance indicators KPI which will assist firms to evaluate the success of procurement process. The metrics outlined in the slide are compliance rate, purchase order cycle time, supplier quality rating, supplier defect rate, and procurement return on investment ROI. Pitch your topic with ease and precision using this KPI Metrics To Track Effectiveness Of Sourcing Raw Material Process Portrait PDF. This layout presents information on Purchase Order Cycle Time, Supplier Defect Rate, Procurement Roi. It is also available for immediate download and adjustment. So, changes can be made in the color, design, graphics or any other component to create a unique layout.

Cross Border Integration In Multinational Corporation Global Coordination Dashboard Costs Topics PDF
This slide provides information regarding the dashboard that contains indicators to determine the coordination activities in various dispersed facilities in different regions across the globe. Deliver and pitch your topic in the best possible manner with this cross border integration in multinational corporation global coordination dashboard costs topics pdf. Use them to share invaluable insights on perfect order rate, on time shipments, total shipments country, warehouse operating costs distribution, warehouse operating costs and impress your audience. This template can be altered and modified as per your expectations. So, grab it now.

Tools For Improving Sales Plan Effectiveness Strategic Action Timeline For Implementing Sales Strategies Structure PDF
This slide shows a Strategic Action Timeline of the company for successfully implementing sales strategy, in order to increase both online and offline sales via Direct Referrals and Facebook Ads, respectively. This slide also provides information on each strategys products, costing, projected sales, proposed deadline, key performance indicators etc. Deliver an awe inspiring pitch with this creative tools for improving sales plan effectiveness strategic action timeline for implementing sales strategies structure pdf bundle. Topics like products and services, budgeted costs, projected sales, distribution strategy, proposed deadline can be discussed with this completely editable template. It is available for immediate download depending on the needs and requirements of the user.
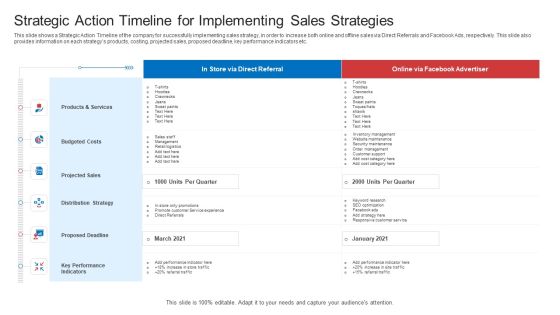
Strategic Plan To Increase Sales Volume And Revenue Strategic Action Timeline For Implementing Sales Strategies Introduction PDF
This slide shows a Strategic Action Timeline of the company for successfully implementing sales strategy, in order to increase both online and offline sales via Direct Referrals and Facebook Ads, respectively. This slide also provides information on each strategys products, costing, projected sales, proposed deadline, key performance indicators etc. Deliver an awe inspiring pitch with this creative strategic plan to increase sales volume and revenue strategic action timeline for implementing sales strategies introduction pdf bundle. Topics like products and services, budgeted costs, projected sales, distribution strategy, proposed deadline can be discussed with this completely editable template. It is available for immediate download depending on the needs and requirements of the user.
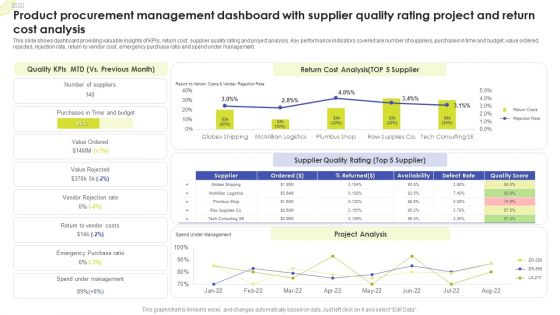
Product Procurement Management Dashboard With Supplier Quality Rating Project And Return Cost Analysis Sample PDF
This slide shows dashboard providing valuable insights of KPIs, return cost, supplier quality rating and project analysis. Key performance indicators covered are number of suppliers, purchases in time and budget, value ordered, rejected, rejection rate, return to vendor cost, emergency purchase ratio and spend under management. Pitch your topic with ease and precision using this Product Procurement Management Dashboard With Supplier Quality Rating Project And Return Cost Analysis Sample PDF. This layout presents information on Quality KPIs, Return Cost Analysis, Supplier Quality Rating. It is also available for immediate download and adjustment. So, changes can be made in the color, design, graphics or any other component to create a unique layout.

Analyzing Impact Of Iot On Major Logistics Kpis Structure PDF
The following slide showcases impact analysis of IoT on major logistics key performance indicators KPIs. It provides information about shipping time, order accuracy, average customer satisfaction rate, lead time, capacity utilization, etc. Deliver and pitch your topic in the best possible manner with this Analyzing Impact Of Iot On Major Logistics Kpis Structure PDF. Use them to share invaluable insights on Capacity Utilization, Organizations, Management and impress your audience. This template can be altered and modified as per your expectations. So, grab it now.

Analyzing Impact Of Iot On Major Logistics Kpis Themes PDF
The following slide showcases impact analysis of IoT on major logistics key performance indicators KPIs. It provides information about shipping time, order accuracy, average customer satisfaction rate, lead time, capacity utilization, etc. Deliver and pitch your topic in the best possible manner with this Analyzing Impact Of Iot On Major Logistics Kpis Themes PDF. Use them to share invaluable insights on Inventory Turnover Ratio, Capacity Utilization, Freight Cost and impress your audience. This template can be altered and modified as per your expectations. So, grab it now.
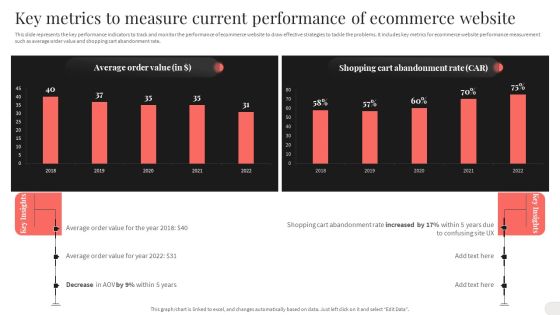
Key Metrics To Measure Current Performance Of Ecommerce Website Structure PDF
This slide represents the key performance indicators to track and monitor the performance of ecommerce website to draw effective strategies to tackle the problems. It includes key metrics for ecommerce website performance measurement such as average order value and shopping cart abandonment rate. There are so many reasons you need a Key Metrics To Measure Current Performance Of Ecommerce Website Structure PDF. The first reason is you can not spend time making everything from scratch, Thus, Slidegeeks has made presentation templates for you too. You can easily download these templates from our website easily.

Analyzing And Deploying Effective CMS Impact Of Ecommerce Management System Post Implementation Icons PDF
This slide represents the key performance indicators to measure the impact of ecommerce management system on ecommerce business operations. It includes KPIs to such as average order value, gross profit, conversion rate, shopping cart abandonment rate, shopping cart conversion rate etc. Make sure to capture your audiences attention in your business displays with our gratis customizable Analyzing And Deploying Effective CMS Impact Of Ecommerce Management System Post Implementation Icons PDF. These are great for business strategies, office conferences, capital raising or task suggestions. If you desire to acquire more customers for your tech business and ensure they stay satisfied, create your own sales presentation with these plain slides.

Dashboard To Track Inventory Status In Sales To Cash Process Themes PDF
This slide depicts a dashboard for business managers to keep the track of inventory in order to cash process for easy understanding and decision making. The major key performing indicators are inventory status, surplus stock, dead inventory, sales by product grades etc. Showcasing this set of slides titled Dashboard To Track Inventory Status In Sales To Cash Process Themes PDF. The topics addressed in these templates are Inventory Status, Surplus Stock, Dead Inventory. All the content presented in this PPT design is completely editable. Download it and make adjustments in color, background, font etc. as per your unique business setting.
Performance Tracking Metrics Of Marketing Return On Investment Graphics PDF
This slide shows various key performance indicators to measure performance of marketing ROI. It includes metrics such as unique monthly visitors, cost per lead, return on ad spend, average order value, etc. Showcasing this set of slides titled Performance Tracking Metrics Of Marketing Return On Investment Graphics PDF. The topics addressed in these templates are Cost Per Lead, Customer Lifetime Value, Unique Monthly Visitors. All the content presented in this PPT design is completely editable. Download it and make adjustments in color, background, font etc. as per your unique business setting.
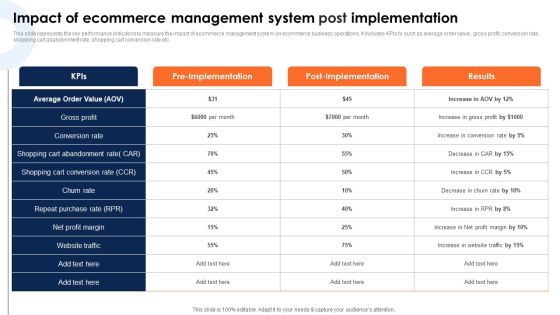
Impact Of Ecommerce Management System Post Implementation Guidelines PDF
This slide represents the key performance indicators to measure the impact of ecommerce management system on ecommerce business operations. It includes KPIs to such as average order value, gross profit, conversion rate, shopping cart abandonment rate, shopping cart conversion rate etc.Make sure to capture your audiences attention in your business displays with our gratis customizable Impact Of Ecommerce Management System Post Implementation Guidelines PDF. These are great for business strategies, office conferences, capital raising or task suggestions. If you desire to acquire more customers for your tech business and ensure they stay satisfied, create your own sales presentation with these plain slides.

Key Metrics To Measure Current Performance Of Ecommerce Website Clipart PDF
This slide represents the key performance indicators to track and monitor the performance of ecommerce website to draw effective strategies to tackle the problems. It includes key metrics for ecommerce website performance measurement such as average order value and shopping cart abandonment rate.The best PPT templates are a great way to save time, energy, and resources. Slidegeeks have 100precent editable powerpoint slides making them incredibly versatile. With these quality presentation templates, you can create a captivating and memorable presentation by combining visually appealing slides and effectively communicating your message. Download Key Metrics To Measure Current Performance Of Ecommerce Website Clipart PDF from Slidegeeks and deliver a wonderful presentation.

Kpis To Track Before Raising Capital Portrait PDF
This slide presents various key performance metrics which a company should track in order to raise capital for equity. The major key performance indicators are revenue growth, gross margin, customer acquisition costs, net promoter score and burn rate. Pitch your topic with ease and precision using this Kpis To Track Before Raising Capital Portrait PDF. This layout presents information on Net Promoter Score, Customer Acquisition Costs, Gross Margin. It is also available for immediate download and adjustment. So, changes can be made in the color, design, graphics or any other component to create a unique layout.
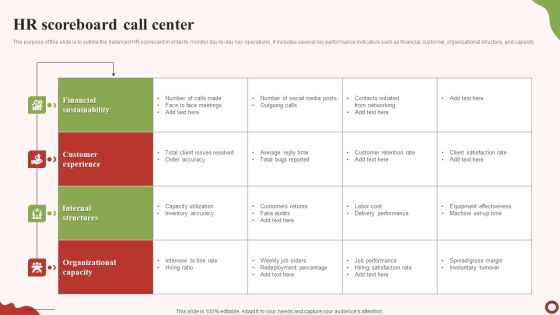
HR Scoreboard Call Center Template PDF
The purpose of this slide is to outline the balanced HR scorecard in order to monitor day-to-day key operations. It includes several key performance indicators such as financial, customer, organizational structure, and capacity. Showcasing this set of slides titled HR Scoreboard Call Center Template PDF. The topics addressed in these templates are Financial Sustainability, Customer Experience, Internal Structures. All the content presented in this PPT design is completely editable. Download it and make adjustments in color, background, font etc. as per your unique business setting.

HR Scoreboard Manager Performance Inspiration PDF
The purpose of this slide is to showcase certain key performance indicators of human resource managers in order to measure their performance based on specific criteria. It includes key areas, metrics, targets, achieved, and performance rating. Showcasing this set of slides titled HR Scoreboard Manager Performance Inspiration PDF. The topics addressed in these templates are Target, Achieved, Performance Rating. All the content presented in this PPT design is completely editable. Download it and make adjustments in color, background, font etc. as per your unique business setting.
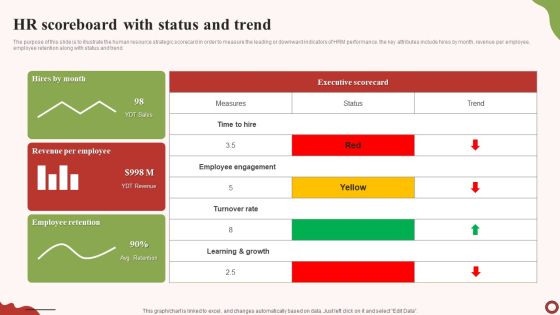
HR Scoreboard With Status And Trend Mockup PDF
The purpose of this slide is to illustrate the human resource strategic scorecard in order to measure the leading or downward indicators of HRM performance. the key attributes include hires by month, revenue per employee, employee retention along with status and trend. Showcasing this set of slides titled HR Scoreboard With Status And Trend Mockup PDF. The topics addressed in these templates are Revenue Per Employee, Employee Retention, Executive Scorecard. All the content presented in this PPT design is completely editable. Download it and make adjustments in color, background, font etc. as per your unique business setting.
Strategies For Successful Customer Base Development In B2b M Commerce B2b Sales Performance Tracking Dashboard Demonstration PDF
This slide represents metric dashboard to track sales performance on e-commerce website. It cover performance indicators such as sales breakdown, order breakdown, recurring sales etc. Make sure to capture your audiences attention in your business displays with our gratis customizable Strategies For Successful Customer Base Development In B2b M Commerce B2b Sales Performance Tracking Dashboard Demonstration PDF. These are great for business strategies, office conferences, capital raising or task suggestions. If you desire to acquire more customers for your tech business and ensure they stay satisfied, create your own sales presentation with these plain slides.
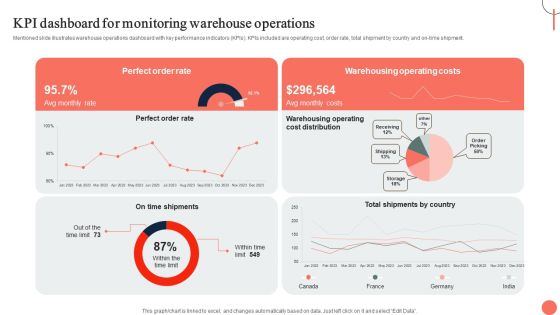
Strategies For Dynamic Supply Chain Agility KPI Dashboard For Monitoring Warehouse Operations Download PDF
Mentioned slide illustrates warehouse operations dashboard with key performance indicators KPIs. KPIs included are operating cost, order rate, total shipment by country and on-time shipment. Slidegeeks is one of the best resources for PowerPoint templates. You can download easily and regulate Strategies For Dynamic Supply Chain Agility KPI Dashboard For Monitoring Warehouse Operations Download PDF for your personal presentations from our wonderful collection. A few clicks is all it takes to discover and get the most relevant and appropriate templates. Use our Templates to add a unique zing and appeal to your presentation and meetings. All the slides are easy to edit and you can use them even for advertisement purposes.

Strategic Ecommerce Plan For B2B Enterprises B2b Sales Performance Tracking Dashboard Demonstration PDF
This slide represents metric dashboard to track sales performance on e-commerce website. It cover performance indicators such as sales breakdown, order breakdown, recurring sales etc. Slidegeeks has constructed Strategic Ecommerce Plan For B2B Enterprises B2b Sales Performance Tracking Dashboard Demonstration PDF after conducting extensive research and examination. These presentation templates are constantly being generated and modified based on user preferences and critiques from editors. Here, you will find the most attractive templates for a range of purposes while taking into account ratings and remarks from users regarding the content. This is an excellent jumping-off point to explore our content and will give new users an insight into our top-notch PowerPoint Templates.

Business To Business Digital Channel Management B2B Sales Performance Tracking Dashboard Template PDF
This slide represents metric dashboard to track sales performance on e-commerce website. It cover performance indicators such as sales breakdown, order breakdown, recurring sales etc. Take your projects to the next level with our ultimate collection of Business To Business Digital Channel Management B2B Sales Performance Tracking Dashboard Template PDF. Slidegeeks has designed a range of layouts that are perfect for representing task or activity duration, keeping track of all your deadlines at a glance. Tailor these designs to your exact needs and give them a truly corporate look with your own brand colors they will make your projects stand out from the rest.
E Commerce Operations In B2b B2b Sales Performance Tracking Dashboard Icons PDF
This slide represents metric dashboard to track sales performance on e-commerce website. It cover performance indicators such as sales breakdown, order breakdown, recurring sales etc. Slidegeeks is one of the best resources for PowerPoint templates. You can download easily and regulate E Commerce Operations In B2b B2b Sales Performance Tracking Dashboard Icons PDF for your personal presentations from our wonderful collection. A few clicks is all it takes to discover and get the most relevant and appropriate templates. Use our Templates to add a unique zing and appeal to your presentation and meetings. All the slides are easy to edit and you can use them even for advertisement purposes.
Key Metrics To Track SEO PR Professionals Guidelines PDF
This slide highlights key performance indicators to track, measure, and analyze SEO pr strategy in order to improve future campaigns. These KPIs include organic website traffic, keyword rankings, domain authority, backlinks, and number of referring domains. Introducing Key Metrics To Track SEO PR Professionals Guidelines PDF. to increase your presentation threshold. Encompassed with five stages, this template is a great option to educate and entice your audience. Dispence information on Keyword Rankings, Backlinks, Domain Authority, using this template. Grab it now to reap its full benefits.

Ppt Straight Explanation To Represent Seven Steps In Process PowerPoint Templates
PPT straight explanation to represent seven steps in process PowerPoint Templates-Develop competitive advantage with our above Diagram which contains a diagram of horizontal arrows. These arrows are indicators of the path you have in mind. Use them to help you organize the logic of your views-PPT straight explanation to represent seven steps in process PowerPoint Templates-above, aiming, arrow, arrowhead, balance, communicate, communication, connection, descriptive, design, designer, direct, direction, dynamic, element, graphic, high, icon, illustration, inform, internet, journey, multimedia, pointer, reflection, set, shape, sign, signal, straight, symbol, top, transportation, travel, vector
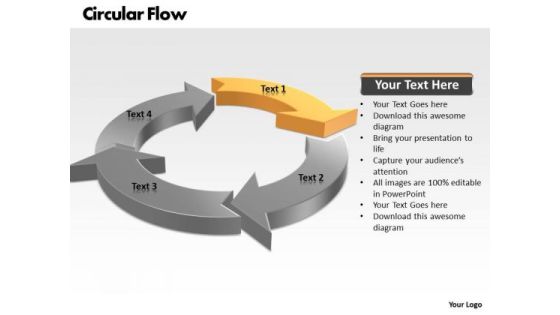
Ppt Circular Flow Process PowerPoint Presentation Chart 4 Stages Templates
PPT circular flow process powerpoint presentation chart 4 stages Templates-The diagrams are used to represent part whole relationship because results relationship etc. this is a 4 parts circle to express your ideas. They are indicators of the path you have in mind.-PPT circular flow process powerpoint presentation chart 4 stages Templates-Arrow, Chart, Circle, Circular, Circulation, Collection, Concept, Connection, Continuity, Cursor, Cycle, Cyclic, Diagram, Direction, Flow, Flowchart, Graph, Graphic, Group, Icon, Motion, Movement, Process, Progress, Recycle, Recycling, Refresh, Reload, Renew, Repetition, Return, Reuse, Ring, Rotation, Round, Sign, Six, Symbol
Flow Ppt Background Arrow Process 3 Stages Style 1 Business Management PowerPoint Image
flow PPT Background arrow process 3 stages style 1 business management powerpoint Image-Grab the attention of your team with this eye catching template presenting indicators of the path you have in mind. Use this diagram to enthuse your colleagues. You can easily edit the size, position and text and change the colors as per your need.-flow PPT Background arrow process 3 stages style 1 business management powerpoint Image-Advertisement, Aqua, Arrow, Blank, Blue, Bread-Crumbs, Business, Button, Collection, Decoration, Design, Direction, Elegance, Element, Empty, Financial, Flow, Gradient, Graph, Horizontal, Illustration, Image, Isolated, Label, Menu, Placard, Process
Sales Ppt Project Targets Process 3 Power Point Stage Business Plan PowerPoint Graphic
We present our sales PPT project targets process 3 power point stage business plan Powerpoint Graphic. Use our People PowerPoint Templates because, There are various viable propositions available to further your commercial interests. Use our Arrows PowerPoint Templates because, to go forgold and not just silver. Use our Communication PowerPoint Templates because; Use our templates for your colleagues knowledge to feed. Use our Teamwork PowerPoint Templates because, Clarity of thought has been the key to your growth. Use our Marketing PowerPoint Templates because, they are indicators of the path you have in mind. Use these PowerPoint slides for presentations relating to Business,
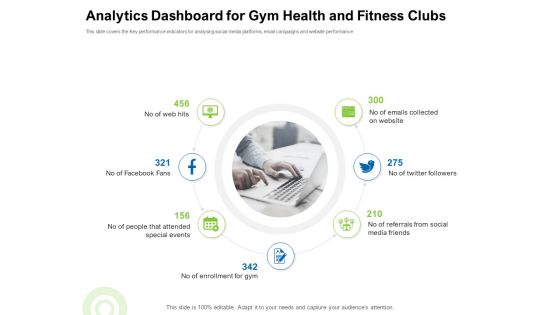
Strategies To Enter Physical Fitness Club Business Analytics Dashboard For Gym Health And Fitness Clubs Brochure PDF
This slide covers the Key performance indicators for analysing social media platforms, email campaigns and website performance This is a strategies to enter physical fitness club business analytics dashboard for gym health and fitness clubs brochure pdf template with various stages. Focus and dispense information on seven stages using this creative set, that comes with editable features. It contains large content boxes to add your information on topics like web, facebook, twitter, followers, friends. You can also showcase facts, figures, and other relevant content using this PPT layout. Grab it now.
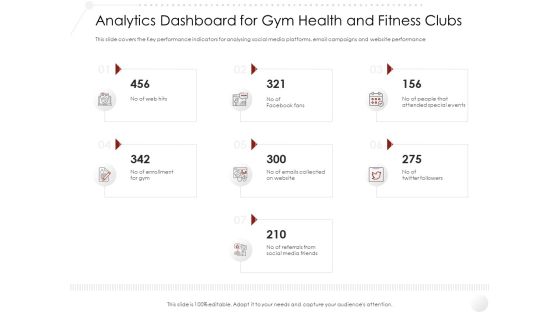
Market Entry Strategy Clubs Industry Analytics Dashboard For Gym Health And Fitness Clubs Summary PDF
This slide covers the Key performance indicators for analysing social media platforms, email campaigns and website performance. Presenting market entry strategy clubs industry analytics dashboard for gym health and fitness clubs summary pdf to provide visual cues and insights. Share and navigate important information on seven stages that need your due attention. This template can be used to pitch topics like Analytics Dashboard for Gym Health and Fitness Clubs. In addtion, this PPT design contains high-resolution images, graphics, etc, that are easily editable and available for immediate download.
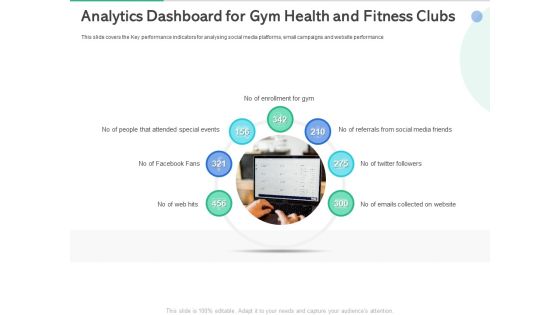
Market Overview Fitness Industry Analytics Dashboard For Gym Health And Fitness Clubs Guidelines PDF
This slide covers the Key performance indicators for analysing social media platforms, email campaigns and website performance. This is a market overview fitness industry analytics dashboard for gym health and fitness clubs guidelines pdf template with various stages. Focus and dispense information on seven stages using this creative set, that comes with editable features. It contains large content boxes to add your information on topics like attended special events, enrollment for gym, social media friends. You can also showcase facts, figures, and other relevant content using this PPT layout. Grab it now.
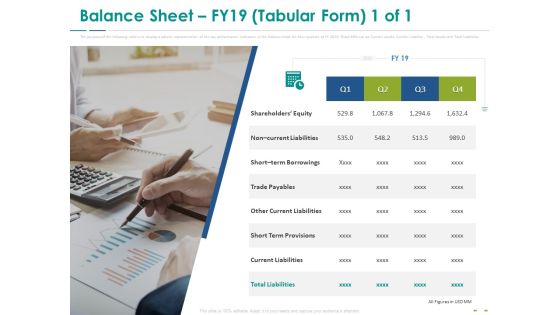
Stock Market Research Report Balance Sheet FY19 Tabular Form Equity Information PDF
The purpose of the following slide is to display the key performance indicators of the balance sheet for four quarters of FY 2019. These KPIs can be Current assets, Current Liability , Total Assets and Total Liabilities. Presenting stock market research report balance sheet fy19 tabular form equity information pdf to provide visual cues and insights. Share and navigate important information on one stages that need your due attention. This template can be used to pitch topics like non current liabilities, short term borrowings, trade payables, other current liabilities, short term provisions. In addition, this PPT design contains high-resolution images, graphics, etc, that are easily editable and available for immediate download.

Stock Market Research Report Income Statement Of Target Company Background PDF
The purpose of the following slide is to display the organizations profit and loss statements Key Performance Indicators such as Net Sales, Expenses, EBITDA and Profit before and after tax. Deliver and pitch your topic in the best possible manner with this stock market research report income statement of target company background pdf. Use them to share invaluable insights on revenue, gross profit, operating expenses, research and development, sales and marketing and impress your audience. This template can be altered and modified as per your expectations. So, grab it now.

Various Stages For Business Process Transformation Ppt PowerPoint Presentation Model Slideshow PDF
Persuade your audience using this various stages for business process transformation ppt powerpoint presentation model slideshow pdf. This PPT design covers four stages, thus making it a great tool to use. It also caters to a variety of topics including identity and communicating the need for change, create team of experts, find the inefficient processes and define key performance indicators kpi, reengineer the processes and compare kpis. Download this PPT design now to present a convincing pitch that not only emphasizes the topic but also showcases your presentation skills.
Eight Stages To Develop A CRM Plan Ppt PowerPoint Presentation Icon Picture PDF
Presenting eight stages to develop a crm plan ppt powerpoint presentation icon picture pdf to dispense important information. This template comprises eight stages. It also presents valuable insights into the topics including define your crm strategy vision and goals, define your target customer with buyer personas, define your customer journey, establish the processes for a 360 customer experience, study the market and know your positioning, knowing your product or service, invest in crm software, setting key performance indicators kpis for each team. This is a completely customizable PowerPoint theme that can be put to use immediately. So, download it and address the topic impactfully.

Cross Border Integration In Multinational Corporation Global Coordination Dashboard Download PDF
This slide provides information regarding the dashboard that contains indicators to determine the logistics performance to maintain coordination activities in various dispersed facilities in different regions across the globe. Deliver an awe-inspiring pitch with this creative cross border integration in multinational corporation global coordination dashboard download pdf bundle. Topics like loading time and weight, delivery status, avg loading, avg loading time, avg loading weight, time limit can be discussed with this completely editable template. It is available for immediate download depending on the needs and requirements of the user.
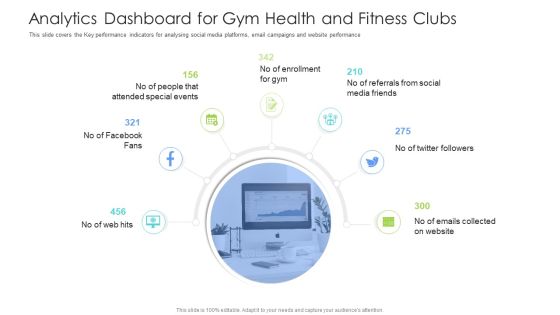
Well Being Gymnasium Sector Analytics Dashboard For Gym Health And Fitness Clubs Clipart PDF
This slide covers the Key performance indicators for analysing social media platforms, email campaigns and website performance. This is a well being gymnasium sector analytics dashboard for gym health and fitness clubs clipart pdf template with various stages. Focus and dispense information on seven stages using this creative set, that comes with editable features. It contains large content boxes to add your information on topics like special events, social media, enrollment, key performance, email campaigns. You can also showcase facts, figures, and other relevant content using this PPT layout. Grab it now.
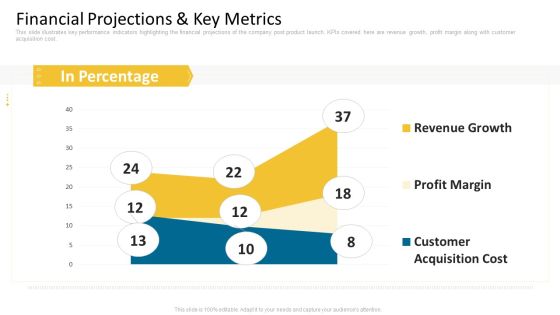
Guy Kawasaki New Venture Pitch PPT Financial Projections And Key Metrics Summary PDF
This slide illustrates key performance indicators highlighting the financial projections of the company post product launch. KPIs covered here are revenue growth, profit margin along with customer acquisition cost. Deliver and pitch your topic in the best possible manner with this guy kawasaki new venture pitch ppt financial projections and key metrics summary pdf. Use them to share invaluable insights on revenue growth, profit margin, customer acquisition cost and impress your audience. This template can be altered and modified as per your expectations. So, grab it now.
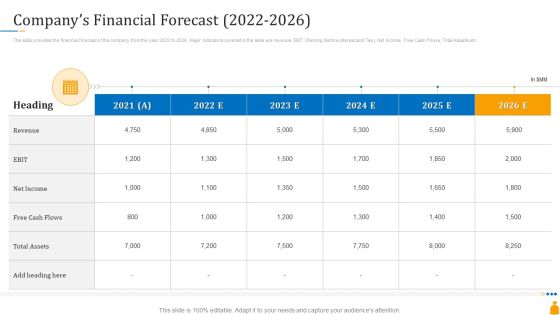
Financial Banking PPT Companys Financial Forecast 2022 To 2026 Ppt Model Show PDF
The slide provides the financial forecast of the company from the year 2022 to 2026. Major indicators covered in the slide are revenue, EBIT Earning Before interest and Tax, Net Income, Free Cash Flows, Total Assets etc. Deliver and pitch your topic in the best possible manner with this financial banking ppt companys financial forecast 2022 to 2026 ppt model show pdf. Use them to share invaluable insights on financial forecast, cash flows, revenue and impress your audience. This template can be altered and modified as per your expectations. So, grab it now.

Financial Banking PPT Competitive Environment Comparison Based On Operational And Financials Data Mockup PDF
The slide provides the operational and financial comparison of the company with its top five competitors. Key comparison indicators include total valuation, EV or EBITDA, Assets Under Management AuM, number of IPO deals, Companys strategy etc. Deliver an awe-inspiring pitch with this creative financial banking ppt competitive environment comparison based on operational and financials data mockup pdf bundle. Topics like operational, financial comparison, key comparison, management, strategy can be discussed with this completely editable template. It is available for immediate download depending on the needs and requirements of the user.

Persuasion Plan Chart To Influence Consumer Behavior Ppt PowerPoint Presentation Summary Design Templates PDF
This slide covers five persuasion techniques for encouraging sales. It also includes indicators to measure such as rational, coercive, voluntary and emotional. Persuade your audience using this persuasion plan chart to influence consumer behavior ppt powerpoint presentation summary design templates pdf. This PPT design covers four stages, thus making it a great tool to use. It also caters to a variety of topics including persuasion plan chart to influence consumer behavior. Download this PPT design now to present a convincing pitch that not only emphasizes the topic but also showcases your presentation skills.

Key Objectives Set By The Company Ppt Styles Background PDF
This slide provides the major objectives set by the company to measure the teams performance. Key KPIs key performance Indicators covered in the slide are number of customers, customer churn rate, customer retention rate etc. Deliver an awe-inspiring pitch with this creative key objectives set by the company ppt styles background pdf. bundle. Topics like key objectives set by the company can be discussed with this completely editable template. It is available for immediate download depending on the needs and requirements of the user.

Number Of Customers Projection For Next Five Years Ppt Infographics Format PDF
This slide provides the projections of key performance indicators KPIs related to customer onboarding. KPIs covered in this slide include number of customers, customer churn rate, customer retention rate etc. Deliver and pitch your topic in the best possible manner with this number of customers projection for next five years ppt infographics format pdf. Use them to share invaluable insights on number of customers projection for next five years and impress your audience. This template can be altered and modified as per your expectations. So, grab it now.
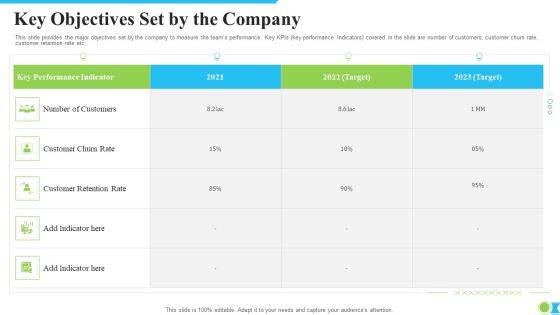
Key Objectives Set By The Company Ppt Layouts Guidelines PDF
This slide provides the major objectives set by the company to measure the teams performance. Key KPIs key performance Indicators covered in the slide are number of customers, customer churn rate, customer retention rate etc. Deliver an awe-inspiring pitch with this creative key objectives set by the company ppt layouts guidelines pdf. bundle. Topics like key objectives set by the company can be discussed with this completely editable template. It is available for immediate download depending on the needs and requirements of the user.

Commercial Banking Template Collection Companys Financial Forecast 2021 To 2025 Structure PDF
The slide provides the financial forecast of the company from the year 2021 to 2025. Major indicators covered in the slide are revenue, EBIT Earning Before interest and Tax, Net Income, Free Cash Flows, Total Assets etc. Deliver and pitch your topic in the best possible manner with this commercial banking template collection companys financial forecast 2021 to 2025 structure pdf. Use them to share invaluable insights on revenue, net income, cash flows and impress your audience. This template can be altered and modified as per your expectations. So, grab it now.
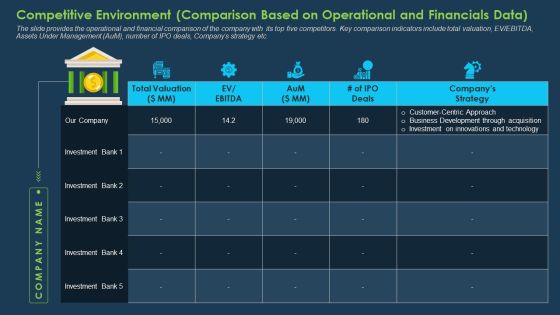
Competitive Environment Comparison Based On Operational And Financials Data Designs PDF
The slide provides the operational and financial comparison of the company with its top five competitors. Key comparison indicators include total valuation, EV or EBITDA, Assets Under Management AuM, number of IPO deals, Companys strategy etc. Deliver and pitch your topic in the best possible manner with this competitive environment comparison based on operational and financials data designs pdf. Use them to share invaluable insights on competitive environment, comparison, operational and financials data and impress your audience. This template can be altered and modified as per your expectations. So, grab it now.

Funding Pitch Book Outline Companys Financial Forecast 2021 2025 Portrait PDF
The slide provides the financial forecast of the company from the year 2022 to 2026. Major indicators covered in the slide are revenue, EBIT Earning Before interest and Tax, Net Income, Free Cash Flows, Total Assets etc. Deliver and pitch your topic in the best possible manner with this funding pitch book outline companys financial forecast 2021 2025 portrait pdf. Use them to share invaluable insights on revenue, net income, free cash flows and impress your audience. This template can be altered and modified as per your expectations. So, grab it now.

Funding Pitch Book Outline Competitive Environment Comparison Based On Operational And Financials Data Portrait PDF
The slide provides the operational and financial comparison of the company with its top five competitors. Key comparison indicators include total valuation, EV or EBITDA, Assets Under Management AuM, number of IPO deals, Companys strategy etc. Deliver an awe inspiring pitch with this creative funding pitch book outline competitive environment comparison based on operational and financials data portrait pdf bundle. Topics like investment, business, development, technology, innovations can be discussed with this completely editable template. It is available for immediate download depending on the needs and requirements of the user.

User Onboarding Process Development Key Objectives Set By The Company Download PDF
This slide provides the major objectives set by the company to measure the teams performance. Key KPIs key performance Indicators covered in the slide are number of customers, customer churn rate, customer retention rate etc. Deliver and pitch your topic in the best possible manner with this User Onboarding Process Development Key Objectives Set By The Company Download PDF. Use them to share invaluable insights on customer churn rate, customer retention rate, target and impress your audience. This template can be altered and modified as per your expectations. So, grab it now.
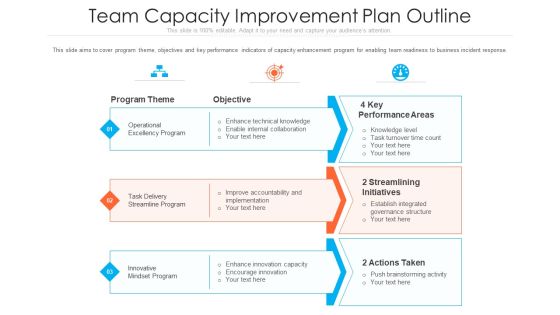
Team Capacity Improvement Plan Outline Ppt Styles Slide PDF
This slide aims to cover program theme, objectives and key performance indicators of capacity enhancement program for enabling team readiness to business incident response. Presenting team capacity improvement plan outline ppt styles slide pdf to provide visual cues and insights. Share and navigate important information on three stages that need your due attention. This template can be used to pitch topics like performance areas, innovative, implementation. In addtion, this PPT design contains high resolution images, graphics, etc, that are easily editable and available for immediate download.
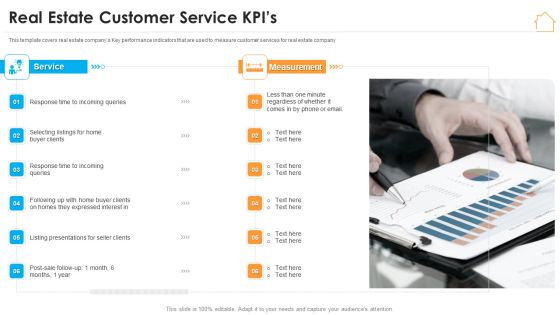
Real Estate Marketing Strategy Vendors Real Estate Customer Service Kpis Topics PDF
This template covers real estate companys Key performance indicators that are used to measure customer services for real estate company. Presenting real estate marketing strategy vendors real estate customer service kpis topics pdf to provide visual cues and insights. Share and navigate important information on six stages that need your due attention. This template can be used to pitch topics like measurement, buyer clients, service. In addtion, this PPT design contains high resolution images, graphics, etc, that are easily editable and available for immediate download.
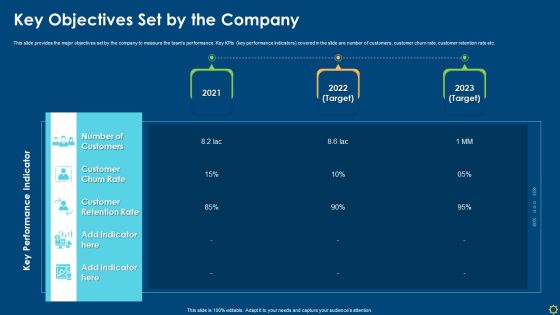
Improving Organizational Process Client Induction Procedure Key Objectives Set By The Company Mockup PDF
This slide provides the major objectives set by the company to measure the teams performance. Key KPIs key performance Indicators covered in the slide are number of customers, customer churn rate, customer retention rate etc. Deliver an awe inspiring pitch with this creative improving organizational process client induction procedure key objectives set by the company mockup pdf bundle. Topics like customer retention rate, customer churn rate, target can be discussed with this completely editable template. It is available for immediate download depending on the needs and requirements of the user.

Procedure Advancements Banking Department Financial Forecast After Process Improvement Template PDF
The slide provides the financial forecast of the company after the process improvement. Major KPIs key performance indicators covered in the slide are total revenue, interest income, number of customers, customer churn rate, online banking users, customer satisfaction rate etc. Deliver and pitch your topic in the best possible manner with this procedure advancements banking department financial forecast after process improvement template pdf. Use them to share invaluable insights on total revenue, interest income, customer satisfaction rate, customer churn rate, online banking users and impress your audience. This template can be altered and modified as per your expectations. So, grab it now.

Companys Financial Forecast 2021To 2025 Guidelines PDF
The slide provides the financial forecast of the company from the year 2021 to 2025. Major indicators covered in the slide are revenue, EBIT Earning Before interest and Tax, Net Income, Free Cash Flows, Total Assets etc.Deliver an awe inspiring pitch with this creative companys financial forecast 2021to 2025 guidelines pdf bundle. Topics like free cash flows, total assets, net income, revenue, heading can be discussed with this completely editable template. It is available for immediate download depending on the needs and requirements of the user.
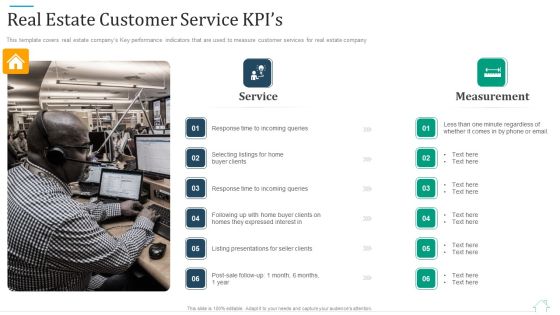
Promotional Strategy For Real Estate Project Real Estate Customer Service Kpis Rules PDF
This template covers real estate companys Key performance indicators that are used to measure customer services for real estate company. Presenting promotional strategy for real estate project real estate customer service kpis rules pdf to provide visual cues and insights. Share and navigate important information on two stages that need your due attention. This template can be used to pitch topics like expressed, measurement, service. In addtion, this PPT design contains high resolution images, graphics, etc, that are easily editable and available for immediate download.

How Our Software Is Performing In The Market Download PDF
Purpose of the following slide is to show the key performing indicators for the software as it highlights the Monthly interview request, candidate acceptance rate and Monthly average invites Deliver and pitch your topic in the best possible manner with this how our software is performing in the market download pdf. Use them to share invaluable insights on interview request, recruiter activity, increase in average salary and impress your audience. This template can be altered and modified as per your expectations. So, grab it now.
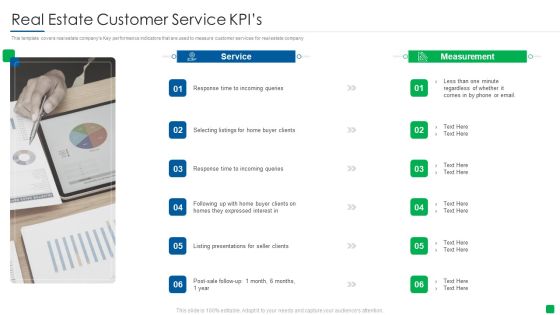
Marketing Strategy For Real Estate Property Real Estate Customer Service Kpis Information PDF
This template covers real estate companys Key performance indicators that are used to measure customer services for real estate company. This is a marketing strategy for real estate property real estate customer service kpis information pdf template with various stages. Focus and dispense information on two stages using this creative set, that comes with editable features. It contains large content boxes to add your information on topics like queries, expressed interest, post sale, service, measurement. You can also showcase facts, figures, and other relevant content using this PPT layout. Grab it now.
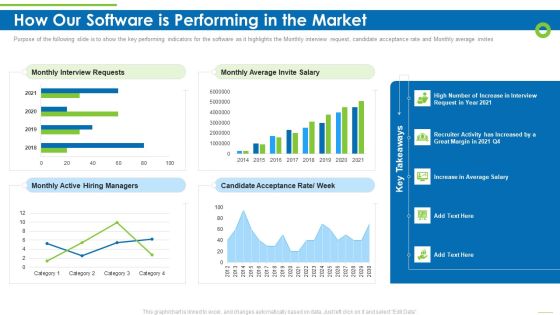
Enterprise Recruitment Industries Investor Fund Raising How Our Software Is Performing In The Market Download PDF
Purpose of the following slide is to show the key performing indicators for the software as it highlights the Monthly interview request, candidate acceptance rate and Monthly average invites Deliver and pitch your topic in the best possible manner with this enterprise recruitment industries investor fund raising how our software is performing in the market download pdf. Use them to share invaluable insights on monthly interview requests, monthly average invite salary, candidate acceptance and impress your audience. This template can be altered and modified as per your expectations. So, grab it now.
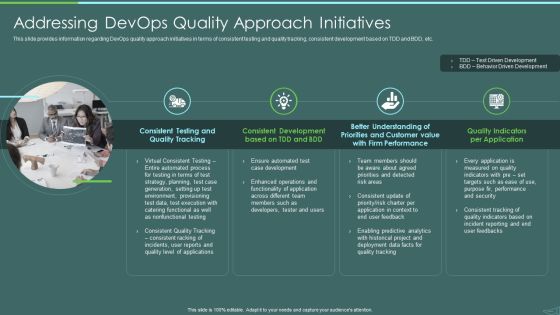
Devops Quality Assurance And Testing To Improve Speed And Quality IT Addressing Devops Quality Approach Portrait PDF
This slide provides information regarding DevOps quality approach initiatives in terms of consistent testing and quality tracking, consistent development based on TDD and BDD, etc. Presenting devops quality assurance and testing to improve speed and quality it addressing devops quality approach portrait pdf to provide visual cues and insights. Share and navigate important information on four stages that need your due attention. This template can be used to pitch topics like consistent testing and quality tracking, consistent development, performance, quality indicators per application. In addtion, this PPT design contains high resolution images, graphics, etc, that are easily editable and available for immediate download.

Strategies Create Good Proposition Latest Logistic Technologies That Can Form Unique Valuable Brochure PDF
This slide shows some of the latest Logistics Technologies in the Industry that can be valuable and beneficial for the company if adopted. Some of the technologies are Logistics Automation, Automated Smart Storage Solutions, Advanced Shipment Tracking Systems, Warehouse Robotics, Enhanced GPS Systems etc. Deliver and pitch your topic in the best possible manner with this strategies create good proposition latest logistic technologies that can form unique valuable brochure pdf. Use them to share invaluable insights on key performance indicators of hcl plus logistics company with future targets and impress your audience. This template can be altered and modified as per your expectations. So, grab it now.

Manufacturing Operation Quality Improvement Practices Tools Templates Production And Manufacturing Pictures PDF
Purpose of the following slide is to show the KPIs or key performance indicators of production and manufacturing, these KPIs can be maintenance cost and downtime. Deliver and pitch your topic in the best possible manner with this manufacturing operation quality improvement practices tools templates production and manufacturing pictures pdf. Use them to share invaluable insights on downtimes by cause, maintenance costs by month, current downtimes and impress your audience. This template can be altered and modified as per your expectations. So, grab it now.
 Home
Home