Indicators

Utilizing Neuromarketing Techniques Post Implementation Impact Ppt Styles Example Introduction PDF
This slide represents performance indicators showcasing impact of neuromarketing on brand growth. It covers lead generation, customer traffic, profit margin etc. There are so many reasons you need a Utilizing Neuromarketing Techniques Post Implementation Impact Ppt Styles Example Introduction PDF. The first reason is you cant spend time making everything from scratch, Thus, Slidegeeks has made presentation templates for you too. You can easily download these templates from our website easily.

Creating Transaction Monitoring Transaction Monitoring And Fraud Detection Software Summary PDF
This slide illustrates transaction monitoring and fraud detection software framework. It provides information about command, control, dashboards, key performance indicators KPIs, risk score, real time detection, sanction screening, etc. There are so many reasons you need a Creating Transaction Monitoring Transaction Monitoring And Fraud Detection Software Summary PDF. The first reason is you cant spend time making everything from scratch, Thus, Slidegeeks has made presentation templates for you too. You can easily download these templates from our website easily.

Key Kpis To Measure Sustainability At Organization Icons PDF
This slide highlights various performance indicators to measure sustainability performance at workplace to monitor and track practices. It includes key components such as environmental KPIs, social KPIs and economic KPIs. Presenting Key Kpis To Measure Sustainability At Organization Icons PDF to dispense important information. This template comprises three stages. It also presents valuable insights into the topics including Environmental, Social, Economic. This is a completely customizable PowerPoint theme that can be put to use immediately. So, download it and address the topic impactfully.
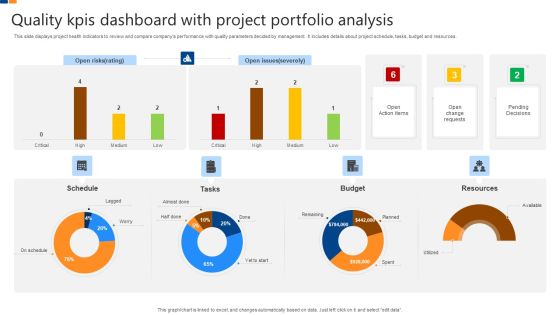
Quality Kpis Dashboard With Project Portfolio Analysis Download PDF
This slide displays project health indicators to review and compare companys performance with quality parameters decided by management. It includes details about project schedule, tasks, budget and resources. Showcasing this set of slides titled Quality Kpis Dashboard With Project Portfolio Analysis Download PDF. The topics addressed in these templates are Schedule, Tasks, Budget, Resources. All the content presented in this PPT design is completely editable. Download it and make adjustments in color, background, font etc. as per your unique business setting.

Content Advertising Campaign Measuring Campaign Results Background PDF
This slide provides an overview of the dashboard depicting performance indicators used to measure success of the campaign. Metrics covered are page views, new visitors, social shares, CTR, blog subscribers, conversion, new blog subscribers, etc. There are so many reasons you need a Content Advertising Campaign Measuring Campaign Results Background PDF. The first reason is you cannot spend time making everything from scratch, Thus, Slidegeeks has made presentation templates for you too. You can easily download these templates from our website easily.
Project Management Tracking Dashboard To Review Decision Download PDF
The below slide depicts the key performing indicators in project decision making. It includes elements such as overall status, progress, progress, time, cost and work volume. Pitch your topic with ease and precision using this Project Management Tracking Dashboard To Review Decision Download PDF. This layout presents information on Progress, Activity Status, Overall Status. It is also available for immediate download and adjustment. So, changes can be made in the color, design, graphics or any other component to create a unique layout.

Managing Hybrid Waterfall Business Approach Project Dashboard Summary PDF
This slide illustrates agile key performance indicators for individual sprints. It includes tasks, story points, bugs, burndown charts, statistics etc. Showcasing this set of slides titled Managing Hybrid Waterfall Business Approach Project Dashboard Summary PDF. The topics addressed in these templates are Tasks, Story Points, Bugs. All the content presented in this PPT design is completely editable. Download it and make adjustments in color, background, font etc. as per your unique business setting.
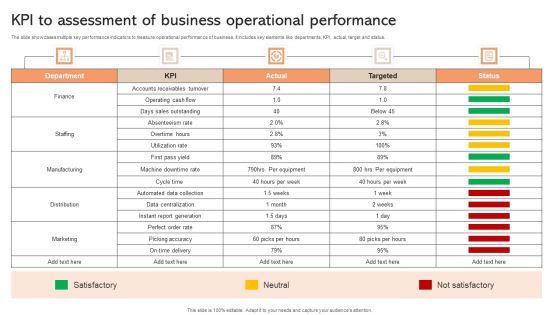
KPI To Assessment Of Business Operational Performance Brochure PDF
The slide showcases multiple key performance indicators to measure operational performance of business. It includes key elements like departments, KPI, actual, target and status. Showcasing this set of slides titled KPI To Assessment Of Business Operational Performance Brochure PDF. The topics addressed in these templates are Satisfactory, Neutral, Not Satisfactory. All the content presented in this PPT design is completely editable. Download it and make adjustments in color, background, font etc. as per your unique business setting.
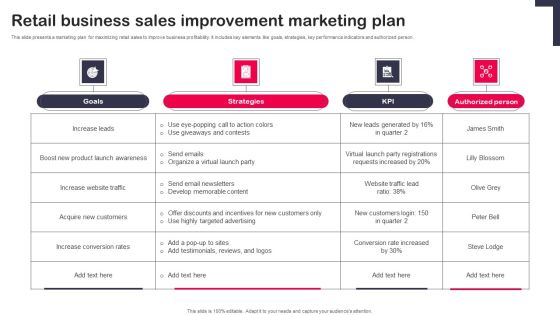
Retail Business Sales Improvement Marketing Plan Guidelines PDF
This slide presents a marketing plan for maximizing retail sales to improve business profitability. It includes key elements like goals, strategies, key performance indicators and authorized person. Pitch your topic with ease and precision using this Retail Business Sales Improvement Marketing Plan Guidelines PDF. This layout presents information on Goals, Strategies, Authorized Person. It is also available for immediate download and adjustment. So, changes can be made in the color, design, graphics or any other component to create a unique layout.
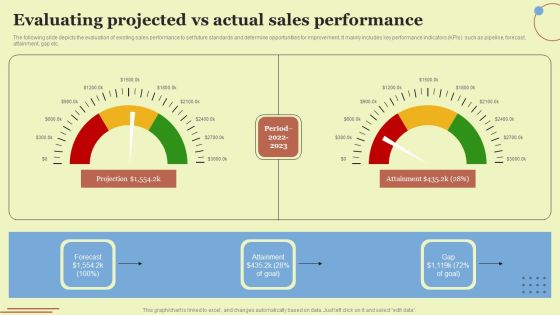
Evaluating Projected Vs Actual Sales Performance Diagrams PDF
The following slide depicts the evaluation of existing sales performance to set future standards and determine opportunities for improvement. It mainly includes key performance indicators KPIs such as pipeline, forecast, attainment, gap etc. There are so many reasons you need a Evaluating Projected Vs Actual Sales Performance Diagrams PDF. The first reason is you can not spend time making everything from scratch, Thus, Slidegeeks has made presentation templates for you too. You can easily download these templates from our website easily.

Business Sales Optimization Advertisement Campaign Kpis To Track Success Of Email Marketing Campaign Guidelines PDF
This slide showcases improvement in performance indicators post advertising campaign. The metrics covered are email ROI, open, clickthrough, bounce and unsubscribe rate. There are so many reasons you need a Business Sales Optimization Advertisement Campaign Kpis To Track Success Of Email Marketing Campaign Guidelines PDF. The first reason is you cannot spend time making everything from scratch, Thus, Slidegeeks has made presentation templates for you too. You can easily download these templates from our website easily.

Enterprise Cyber Risk Management Dashboard Sample PDF
This slide represents the key metrics dashboard representing details related to management of cyber security incidents by an enterprise. It includes key performance indicators such as risk analysis progress, risk rating breakdown etc. There are so many reasons you need a Enterprise Cyber Risk Management Dashboard Sample PDF. The first reason is you cannot spend time making everything from scratch, Thus, Slidegeeks has made presentation templates for you too. You can easily download these templates from our website easily.
Performance Tracking Kpi Dashboard For Digital Marketing Strategy Ppt Styles Templates PDF
Mentioned slide provides information about the key performance indicators that can be used by managers to measure the success of digital marketing strategy, KPIs covered are status, progress, priority and timeline. There are so many reasons you need a Performance Tracking Kpi Dashboard For Digital Marketing Strategy Ppt Styles Templates PDF. The first reason is you can not spend time making everything from scratch, Thus, Slidegeeks has made presentation templates for you too. You can easily download these templates from our website easily.

Managers Scorecard For Online Business Structure PDF
This slide depicts balanced scorecard used by e businesses for efficient management. It includes objectives and goals needed to be achieved, initiatives taken for the same and indicators to track progress. Showcasing this set of slides titled Managers Scorecard For Online Business Structure PDF. The topics addressed in these templates are Focus Areas, Business, Objectives. All the content presented in this PPT design is completely editable. Download it and make adjustments in color, background, font etc. as per your unique business setting.
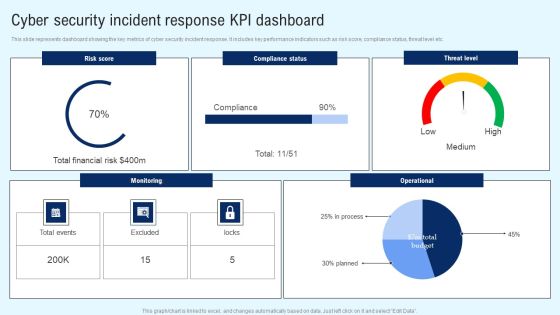
Implementing Cyber Security Incident Cyber Security Incident Response KPI Dashboard Clipart PDF
This slide represents dashboard showing the key metrics of cyber security incident response. It includes key performance indicators such as risk score, compliance status, threat level etc. There are so many reasons you need a Implementing Cyber Security Incident Cyber Security Incident Response KPI Dashboard Clipart PDF. The first reason is you cannot spend time making everything from scratch, Thus, Slidegeeks has made presentation templates for you too. You can easily download these templates from our website easily.
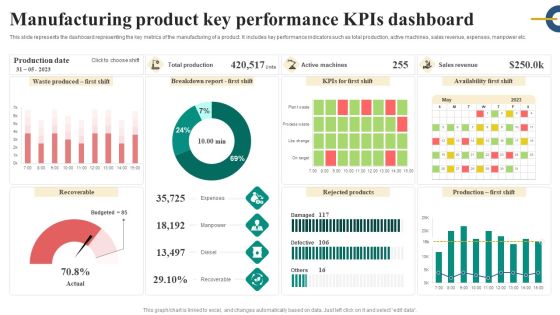
Manufacturing Product Key Performance Kpis Dashboard Inspiration PDF
This slide represents the dashboard representing the key metrics of the manufacturing of a product. It includes key performance indicators such as total production, active machines, sales revenue, expenses, manpower etc. Showcasing this set of slides titled Manufacturing Product Key Performance Kpis Dashboard Inspiration PDF. The topics addressed in these templates are Expenses, Manpower, Diesel, Recoverable. All the content presented in this PPT design is completely editable. Download it and make adjustments in color, background, font etc. as per your unique business setting.
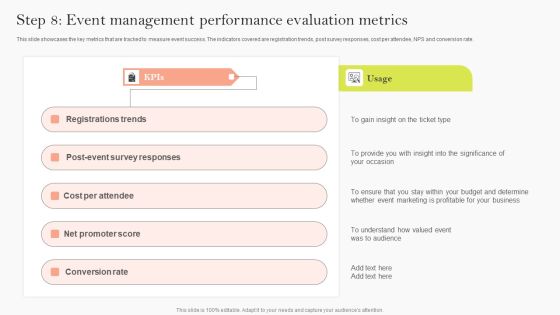
Step 8 Event Management Performance Evaluation Metrics Ppt Gallery Designs Download PDF
This slide showcases the key metrics that are tracked to measure event success. The indicators covered are registration trends, post survey responses, cost per attendee, NPS and conversion rate. There are so many reasons you need a Step 8 Event Management Performance Evaluation Metrics Ppt Gallery Designs Download PDF. The first reason is you can not spend time making everything from scratch, Thus, Slidegeeks has made presentation templates for you too. You can easily download these templates from our website easily.

Step 8 Event Management Performance Evaluation Metrics Inspiration PDF
This slide showcases the key metrics that are tracked to measure event success. The indicators covered are registration trends, post survey responses, cost per attendee, NPS and conversion rate. There are so many reasons you need a Step 8 Event Management Performance Evaluation Metrics Inspiration PDF. The first reason is you can not spend time making everything from scratch, Thus, Slidegeeks has made presentation templates for you too. You can easily download these templates from our website easily.
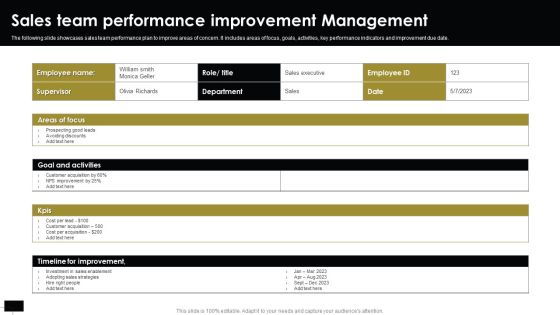
Sales Team Performance Improvement Management Brochure PDF
The following slide showcases sales team performance plan to improve areas of concern. It includes areas of focus, goals, activities, key performance indicators and improvement due date. Showcasing this set of slides titled Sales Team Performance Improvement Management Brochure PDF. The topics addressed in these templates are Customer Acquisition, Goal And Activities, Sales Strategies. All the content presented in this PPT design is completely editable. Download it and make adjustments in color, background, font etc. as per your unique business setting.

Purpose And Scope Of Data Enablement Framework Platform Demonstration PDF
This slide illustrates purpose, key performance indicators and scope of data enablement platform. It includes system reliability, data self service adoption, etc. Presenting Purpose And Scope Of Data Enablement Framework Platform Demonstration PDF to dispense important information. This template comprises three stages. It also presents valuable insights into the topics including Data Enablement Purpose, Data Enablement Kpis, Data Enablement Scope. This is a completely customizable PowerPoint theme that can be put to use immediately. So, download it and address the topic impactfully.

Shiny Bar Graph Business PowerPoint Template 0910
Shiny colorful abstract bar graph indicating growth
Online Risk Management Dashboard For Tracking Threats And Attacks Icons PDF
The purpose of this slide is to represent dashboard to monitor risks and cyber threats for efficient risk management. It includes various types of key performance indicators such as types of risks, severities, sources and risk meter. Showcasing this set of slides titled Online Risk Management Dashboard For Tracking Threats And Attacks Icons PDF. The topics addressed in these templates are Attack, Indication Severities, Sources. All the content presented in this PPT design is completely editable. Download it and make adjustments in color, background, font etc. as per your unique business setting.

Customer Decline Of Sales Analysis Dashboard Rules PDF
The following slide presents a key performance indicating dashboards that can be used by managers in order to analyse customer-lost sales. Major key performance indicators are lost deals rate, lost sales rate, customer data analytics, etc. Pitch your topic with ease and precision using this Customer Decline Of Sales Analysis Dashboard Rules PDF. This layout presents information on Customer Data Analytics. It is also available for immediate download and adjustment. So, changes can be made in the color, design, graphics or any other component to create a unique layout.
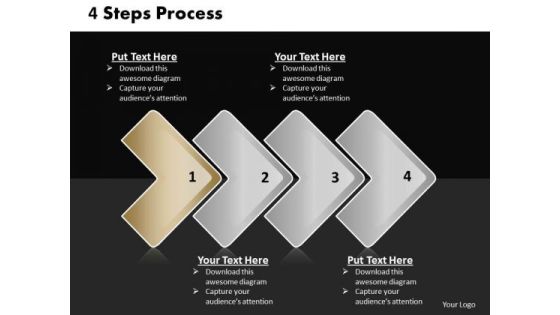
Ppt Direct Description Of 4 PowerPoint Slide Numbers Included A Task Templates
PPT direct description of 4 powerpoint slide numbers included a task Templates-Use above diagram to illustrate a stepwise process or a phase structure. Grab the attention of your team with this eye catching template presenting indicators of the path you have in mind. Use this diagram to enthuse your colleagues-PPT direct description of 4 powerpoint slide numbers included a task Templates-Aim, Arrow, Arrowheads, Badge, Border, Click, Connection, Curve, Design, Direction, Download, Element, Fuchsia, Icon, Illustration, Indicator, Internet, Magenta, Mark, Object, Orientation, Pointer, Shadow, Shape, Sign
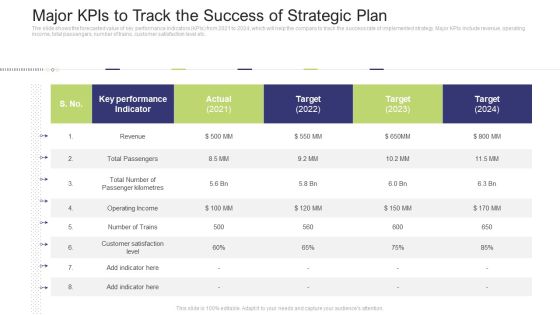
Major Kpis To Track The Success Of Strategic Plan Ideas PDF
The slide shows the forecasted value of key performance indicators KPIs from 2021 to 2024, which will help the company to track the success rate of implemented strategy. Major KPIs include revenue, operating income, total passengers, number of trains, customer satisfaction level etc.Deliver and pitch your topic in the best possible manner with this major kpis to track the success of strategic plan ideas pdf. Use them to share invaluable insights on key performance indicator, actual 2021 and impress your audience. This template can be altered and modified as per your expectations. So, grab it now.
Projection Of Major Kpis Related To Customer Onboarding Ppt Icon Example PDF
This slide provides the projections of key performance indicators KPIs related to customer onboarding. KPIs covered in this slide include number of customers, customer churn rate, customer retention rate etc. Deliver an awe-inspiring pitch with this creative projection of major kpis related to customer onboarding ppt icon example pdf. bundle. Topics like customer churn rate, customer retention rate, indicator, number of customers can be discussed with this completely editable template. It is available for immediate download depending on the needs and requirements of the user.

Projection Of Major Kpis Related To Customer Onboarding Ppt Infographic Template Designs Download PDF
This slide provides the projections of key performance indicators KPIs related to customer onboarding. KPIs covered in this slide include number of customers, customer churn rate, customer retention rate etc. Deliver and pitch your topic in the best possible manner with this projection of major kpis related to customer onboarding ppt infographic template designs download pdf. Use them to share invaluable insights on number of customers, customer churn rate, customer retention rate, indicator and impress your audience. This template can be altered and modified as per your expectations. So, grab it now.
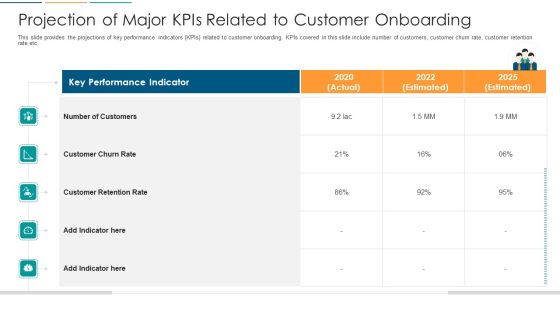
Projection Of Major Kpis Related To Customer Onboarding Ppt File Templates PDF
This slide provides the projections of key performance indicators KPIs related to customer onboarding. KPIs covered in this slide include number of customers, customer churn rate, customer retention rate etc. Deliver an awe-inspiring pitch with this creative projection of major kpis related to customer onboarding ppt file templates pdf. bundle. Topics like customer retention rate, customer churn rate, number of customers, key performance indicator can be discussed with this completely editable template. It is available for immediate download depending on the needs and requirements of the user.

User Onboarding Process Development Projection Of Major Kpis Related To Customer Onboarding Guidelines PDF
This slide provides the projections of key performance indicators KPIs related to customer onboarding. KPIs covered in this slide include number of customers, customer churn rate, customer retention rate etc. Deliver an awe-inspiring pitch with this creative User Onboarding Process Development Projection Of Major Kpis Related To Customer Onboarding Guidelines PDF bundle. Topics like customer churn rate, customer retention rate, key performance indicator can be discussed with this completely editable template. It is available for immediate download depending on the needs and requirements of the user.

Financial Forecast After Process Improvement Develop Organizational Productivity By Enhancing Business Process Brochure PDF
The slide provides the financial forecast of the company after the process improvement. Major KPIs key performance indicators covered in the slide are total revenue, interest income, number of customers, customer churn rate, online banking users, customer satisfaction rate etc. Deliver an awe inspiring pitch with this creative financial forecast after process improvement develop organizational productivity by enhancing business process brochure pdf bundle. Topics like revenue, interest income, performance indicator, actual, target can be discussed with this completely editable template. It is available for immediate download depending on the needs and requirements of the user.
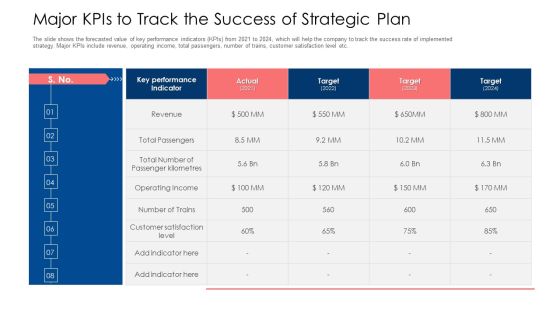
Major Kpis To Track The Success Of Strategic Plan Ppt Summary Influencers PDF
The slide shows the forecasted value of key performance indicators KPIs from 2021 to 2024, which will help the company to track the success rate of implemented strategy. Major KPIs include revenue, operating income, total passengers, number of trains, customer satisfaction level etc. Deliver an awe inspiring pitch with this creative major kpis to track the success of strategic plan ppt summary influencers pdf bundle. Topics like revenue, key performance indicator, target can be discussed with this completely editable template. It is available for immediate download depending on the needs and requirements of the user.
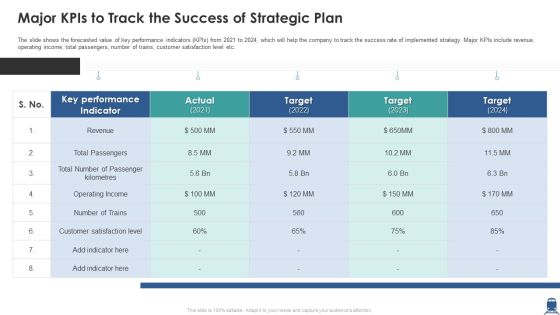
Major Kpis To Track The Success Of Strategic Plan Download PDF
The slide shows the forecasted value of key performance indicators KPIs from 2021 to 2024, which will help the company to track the success rate of implemented strategy. Major KPIs include revenue, operating income, total passengers, number of trains, customer satisfaction level etc. Deliver and pitch your topic in the best possible manner with this major kpis to track the success of strategic plan download pdf. Use them to share invaluable insights on revenue, key performance indicator, customer satisfaction level and impress your audience. This template can be altered and modified as per your expectations. So, grab it now.
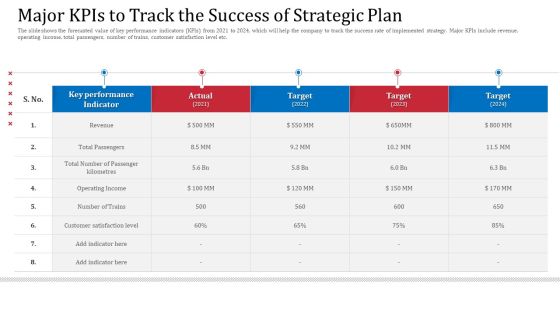
Major Kpis To Track The Success Of Strategic Plan Designs PDF
The slide shows the forecasted value of key performance indicators KPIs from 2021 to 2024, which will help the company to track the success rate of implemented strategy. Major KPIs include revenue, operating income, total passengers, number of trains, customer satisfaction level etc.Deliver an awe inspiring pitch with this creative major kpis to track the success of strategic plan designs pdf bundle. Topics like total passengers, operating income, performance indicator can be discussed with this completely editable template. It is available for immediate download depending on the needs and requirements of the user.
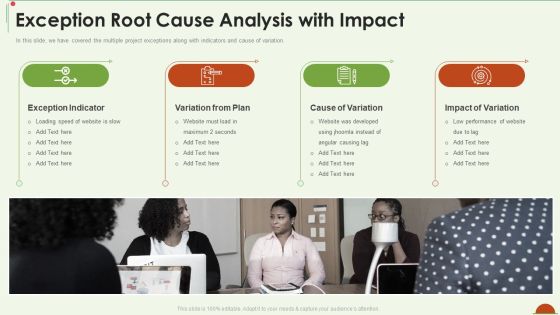
Project Management Under Supervision Exception Root Cause Analysis With Impact Topics PDF
In this slide, we have covered the multiple project exceptions along with indicators and cause of variation. Presenting project management under supervision exception root cause analysis with impact topics pdf to provide visual cues and insights. Share and navigate important information on four stages that need your due attention. This template can be used to pitch topics like exception indicator, variation from plan, cause of variation, impact of variation. In addtion, this PPT design contains high resolution images, graphics, etc, that are easily editable and available for immediate download.

Financial Fundamental Metrics Infrastructure Unit Costs Vs Target Benchmarks Ppt Professional Example PDF
These indicators assist IT leaders in stewarding technology expenditures and investments, and they are essential to managing the IT company. These measures aid in the management of the departments financial health and may indicate levers for cost reduction, improved resource allocation, and enhanced accountability. Deliver and pitch your topic in the best possible manner with this financial fundamental metrics infrastructure unit costs vs target benchmarks ppt professional example pdf. Use them to share invaluable insights on outsourcing, organizations, budget and impress your audience. This template can be altered and modified as per your expectations. So, grab it now.

Communicate Company Value To Your Stakeholders Financial Fundamental Metrics Graphics PDF
These indicators assist IT leaders in stewarding technology expenditures and investments, and they are essential to managing the IT company. These measures aid in the management of the departments financial health and may indicate levers for cost reduction, improved resource allocation, and enhanced accountability. Deliver and pitch your topic in the best possible manner with this communicate company value to your stakeholders financial fundamental metrics graphics pdf. Use them to share invaluable insights on organizations, budget, protect and impress your audience. This template can be altered and modified as per your expectations. So, grab it now.

How To Evaluate And Develop The Organizational Value Of IT Service Financial Fundamental Metrics Slides PDF
These indicators assist IT leaders in stewarding technology expenditures and investments, and they are essential to managing the IT company. These measures aid in the management of the departments financial health and may indicate levers for cost reduction, improved resource allocation, and enhanced accountability. Deliver and pitch your topic in the best possible manner with this how to evaluate and develop the organizational value of it service financial fundamental metrics slides pdf. Use them to share invaluable insights on organizations, budget, business, efficiency and impress your audience. This template can be altered and modified as per your expectations. So, grab it now.
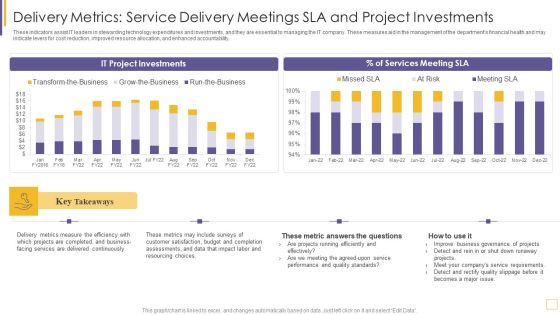
Guidelines For Exhibiting Business Value Of Information And Technology Delivery Metrics Service Portrait PDF
These indicators assist IT leaders in stewarding technology expenditures and investments, and they are essential to managing the IT company. These measures aid in the management of the departments financial health and may indicate levers for cost reduction, improved resource allocation, and enhanced accountability. Deliver and pitch your topic in the best possible manner with this guidelines for exhibiting business value of information and technology delivery metrics service portrait pdf. Use them to share invaluable insights on metrics measure, services, budget, resourcing and impress your audience. This template can be altered and modified as per your expectations. So, grab it now.

Guidelines For Exhibiting Business Value Of Information And Technology Financial Fundamental Metrics IT Spend Mockup PDF
These indicators assist IT leaders in stewarding technology expenditures and investments, and they are essential to managing the IT company. These measures aid in the management of the departments financial health and may indicate levers for cost reduction, improved resource allocation, and enhanced accountability. Deliver an awe inspiring pitch with this creative guidelines for exhibiting business value of information and technology financial fundamental metrics it spend mockup pdf bundle. Topics like metric, organizations, budget, demonstrate can be discussed with this completely editable template. It is available for immediate download depending on the needs and requirements of the user.

IT Value Story Significant To Corporate Leadership Financial Fundamental Metrics Diagrams PDF
These indicators assist IT leaders in stewarding technology expenditures and investments, and they are essential to managing the IT company. These measures aid in the management of the departments financial health and may indicate levers for cost reduction, improved resource allocation, and enhanced accountability. Deliver and pitch your topic in the best possible manner with this it value story significant to corporate leadership financial fundamental metrics diagrams pdf. Use them to share invaluable insights on organizations, budget, metric, cost and impress your audience. This template can be altered and modified as per your expectations. So, grab it now.
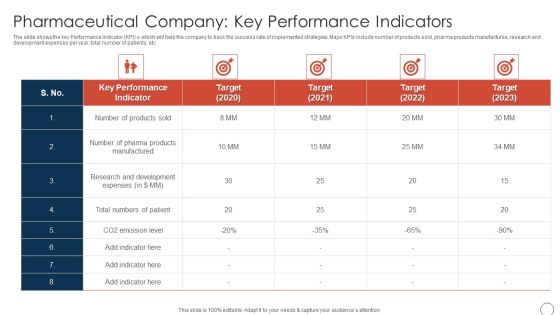
Pharmaceutical Company Key Performance Obtaining Sustainability Growing Pharmaceutical Organization Slides PDF
The slide shows the key Performance Indicator KPI s which will help the company to track the success rate of implemented strategies. Major KPIs include number of products sold, pharma products manufactures, research and development expenses per year, total number of patients, etc Deliver and pitch your topic in the best possible manner with this pharmaceutical company key performance obtaining sustainability growing pharmaceutical organization slides pdf. Use them to share invaluable insights on pharmaceutical company key performance indicators and impress your audience. This template can be altered and modified as per your expectations. So, grab it now.

Corporate Physical Health And Fitness Culture Playbook Health And Fitness Program Overall Portrait PDF
Following slide highlights an employees overall performance summary after completing health and fitness program. Performance indicators covered in the slide are physical activity, sleep, stress management, water intake and emotions. Deliver an awe inspiring pitch with this creative corporate physical health and fitness culture playbook health and fitness program overall portrait pdf bundle. Topics like tims performance summary indicates, physical activity, nutrition management can be discussed with this completely editable template. It is available for immediate download depending on the needs and requirements of the user.
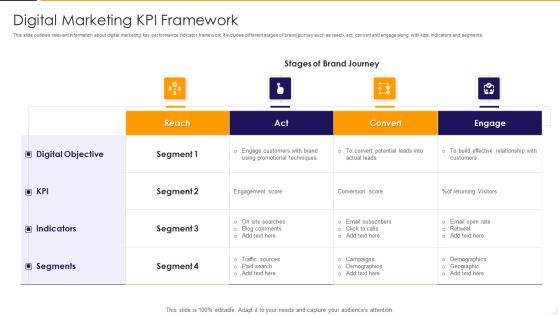
Digital Marketing KPI Framework Ppt PowerPoint Presentation File Slides PDF
This slide outlines relevant information about digital marketing key performance indicator framework. It includes different stages of brand journey such as reach, act, convert and engage along with kips, indicators and segments. Pitch your topic with ease and precision using this digital marketing kpi framework ppt powerpoint presentation file slides pdf This layout presents information on techniques, demographics, customers It is also available for immediate download and adjustment. So, changes can be made in the color, design, graphics or any other component to create a unique layout.

KPI Framework For Fast Moving Consumer Goods Ppt PowerPoint Presentation File Show PDF
The below mentioned slide highlights key performance indicator framework for measuring fast moving consumer goods. This includes indicators like out of stock, supply chain cost, carrying cost of inventory and average time taken to sell the goods to the ultimate consumers. Pitch your topic with ease and precision using this kpi framework for fast moving consumer goods ppt powerpoint presentation file show pdf This layout presents information on average, stock rate, cost It is also available for immediate download and adjustment. So, changes can be made in the color, design, graphics or any other component to create a unique layout.
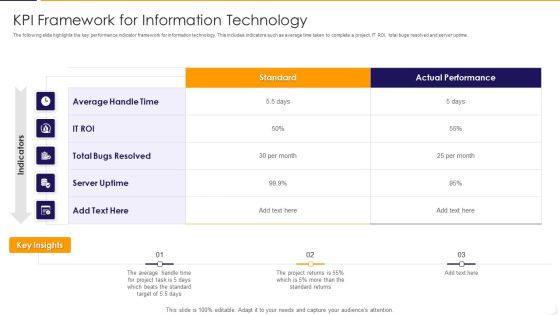
KPI Framework For Information Technology Ppt PowerPoint Presentation Gallery Clipart Images PDF
The following slide highlights the key performance indicator framework for information technology. This includes indicators such as average time taken to complete a project, IT ROI, total bugs resolved and server uptime. Showcasing this set of slides titled kpi framework for information technology ppt powerpoint presentation gallery clipart images pdf The topics addressed in these templates are average, target, performance All the content presented in this PPT design is completely editable. Download it and make adjustments in color, background, font etc. as per your unique business setting.
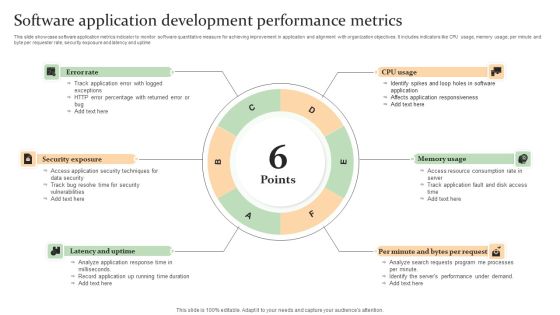
Software Application Development Performance Metrics Mockup PDF
This slide showcase software application metrics indicator to monitor software quantitative measure for achieving improvement in application and alignment with organization objectives. It includes indicators like CPU usage, memory usage, per minute and byte per requester rate, security exposure and latency and uptime Persuade your audience using this Software Application Development Performance Metrics Mockup PDF. This PPT design covers Six stages, thus making it a great tool to use. It also caters to a variety of topics including Latency And Uptime, Memory Usage, Security Exposure . Download this PPT design now to present a convincing pitch that not only emphasizes the topic but also showcases your presentation skills.

Inventory Stock Out And Decline Of Sales Analysis Dashboard Inspiration PDF
Following slide presents a key performance indicating dashboard that can be used by businesses to track Inventory stock out and lost sales. Major key performance indicators are percentage stockouts, amount of sales, lost sales accountability, etc. Pitch your topic with ease and precision using this Inventory Stock Out And Decline Of Sales Analysis Dashboard Inspiration PDF. This layout presents information on Lost Sales Summary, Stock Out Details It is also available for immediate download and adjustment. So, changes can be made in the color, design, graphics or any other component to create a unique layout.

Key Customer Satisfaction Index Strategy For Experience Upgradation In Automotive Industry Download PDF
Following slide provides information regarding customer satisfaction index improvement employed by automotive organizations for business upliftment and value creation. Essential approaches, action steps, key performing indicators and outcome are the elements demonstrated in this slide. Showcasing this set of slides titled Key Customer Satisfaction Index Strategy For Experience Upgradation In Automotive Industry Download PDF. The topics addressed in these templates are Understand Buyer Journey, Prioritize Customers. All the content presented in this PPT design is completely editable. Download it and make adjustments in color, background, font etc. as per your unique business setting.
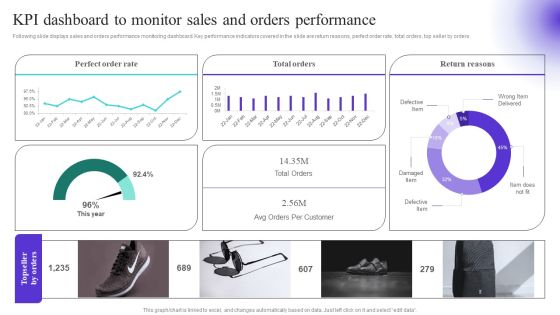
KPI Dashboard To Monitor Sales And Orders Performance Diagrams PDF
Following slide displays sales and orders performance monitoring dashboard. Key performance indicators covered in the slide are return reasons, perfect order rate, total orders, top seller by orders. Create an editable KPI Dashboard To Monitor Sales And Orders Performance Diagrams PDF that communicates your idea and engages your audience. Whether you are presenting a business or an educational presentation, pre designed presentation templates help save time. KPI Dashboard To Monitor Sales And Orders Performance Diagrams PDF is highly customizable and very easy to edit, covering many different styles from creative to business presentations. Slidegeeks has creative team members who have crafted amazing templates. So, go and get them without any delay.

Automated Dashboard To Track Status Of Order Request Themes PDF
The following slide highlights automated dashboard which can be used to track the status of pleased orders, and manage the inventory across various outlets. The key performance indicators are order, summary, inventory, summary, cost of goods sold, financial statement. Showcasing this set of slides titled Automated Dashboard To Track Status Of Order Request Themes PDF. The topics addressed in these templates are Inventory Value, Inventory Summary, Cost. All the content presented in this PPT design is completely editable. Download it and make adjustments in color, background, font etc. as per your unique business setting.

Tactical Brand Extension Launching Kpi Dashboard To Monitor Sales And Orders Formats PDF
Following slide displays sales and orders performance monitoring dashboard. Key performance indicators covered in the slide are return reasons, perfect order rate, total orders, top seller by orders. From laying roadmaps to briefing everything in detail, our templates are perfect for you. You can set the stage with your presentation slides. All you have to do is download these easy-to-edit and customizable templates. Tactical Brand Extension Launching Kpi Dashboard To Monitor Sales And Orders Formats PDF will help you deliver an outstanding performance that everyone would remember and praise you for. Do download this presentation today.
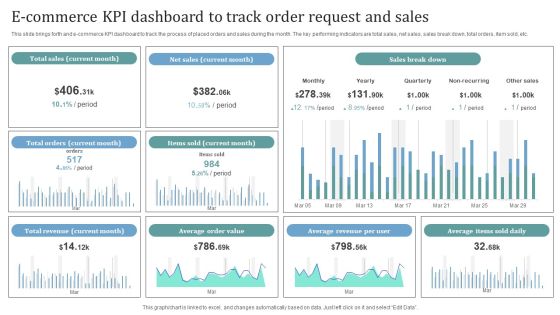
E Commerce KPI Dashboard To Track Order Request And Sales Introduction PDF
This slide brings forth and e commerce KPI dashboard to track the process of placed orders and sales during the month. The key performing indicators are total sales, net sales, sales break down, total orders, item sold, etc. Showcasing this set of slides titled E Commerce KPI Dashboard To Track Order Request And Sales Introduction PDF. The topics addressed in these templates are Total Sales, Net Sales, Sales Break Down. All the content presented in this PPT design is completely editable. Download it and make adjustments in color, background, font etc. as per your unique business setting.

Business Unit Valuation And Development Dashboard Ppt Professional Graphic Tips PDF
This slide shows key performance indicators dashboard which represents number of assets along with their stages of development. It also includes estimated development cost and production index comparison. Pitch your topic with ease and precision using this Business Unit Valuation And Development Dashboard Ppt Professional Graphic Tips PDF. This layout presents information on Estimated Development Cost, Production Index, Development Stage. It is also available for immediate download and adjustment. So, changes can be made in the color, design, graphics or any other component to create a unique layout.

Automation Project Status Dashboard Of Consulting Firm Report Background PDF
This slide showcases project status dashboard that provides a concise visual of key indicators progress and allow to compare actual performance with pre-built objectives. Key metrics covered are cost performance, time v or s project phase, timeline v or s resource capacity. Showcasing this set of slides titled Automation Project Status Dashboard Of Consulting Firm Report Background PDF. The topics addressed in these templates are Project Phase, Planned Value, Cost Performance Index. All the content presented in this PPT design is completely editable. Download it and make adjustments in color, background, font etc. as per your unique business setting.

Consumer Partition Dashboard For Email Campaigns Infographics PDF
The following slide depicts a dashboard which can be used by marketers for sending targeted mails to customers and enhance customer retention. The key performing indicators are number of customers, average value or orders, number of orders, top ten percent customers etc. Showcasing this set of slides titled Consumer Partition Dashboard For Email Campaigns Infographics PDF. The topics addressed in these templates are Average Life Time Value, Average Value Of Orders, Returns, Average Number Of Orders. All the content presented in this PPT design is completely editable. Download it and make adjustments in color, background, font etc. as per your unique business setting.

Event Logistic Plan Kpis With Expected Outcome Infographics PDF
This slide showcases important key performance indicators of supply chain also essential for event planning. It includes order management, supply, inventory and distribution.Persuade your audience using this Event Logistic Plan Kpis With Expected Outcome Infographics PDF This PPT design covers four stages, thus making it a great tool to use. It also caters to a variety of topics including Order Management, Inventory Turnover, Distribution Download this PPT design now to present a convincing pitch that not only emphasizes the topic but also showcases your presentation skills.

Supply Chain Management Analyzing Impact Of Iot On Major Logistics Kpis Information PDF
The following slide showcases impact analysis of IoT on major logistics key performance indicators KPIs. It provides information about shipping time, order accuracy, average customer satisfaction rate, lead time, capacity utilization, etc. Deliver and pitch your topic in the best possible manner with this Supply Chain Management Analyzing Impact Of Iot On Major Logistics Kpis Information PDF. Use them to share invaluable insights on Shipping Time, Order Accuracy, Lead Time and impress your audience. This template can be altered and modified as per your expectations. So, grab it now.

Supply Chain Strategic Planning Dashboard Showing Shipping Status Structure PDF
This slide showcase supply chain planning dashboard showing shipping status which includes orders, present data, worldwide financial levels, monthly key performance indicators KPIs, etc. This can be beneficial for order management department for efficient delivery of products. Showcasing this set of slides titled Supply Chain Strategic Planning Dashboard Showing Shipping Status Structure PDF. The topics addressed in these templates are Worldwide Financial Levels, Present Data, Customer. All the content presented in this PPT design is completely editable. Download it and make adjustments in color, background, font etc. as per your unique business setting.

Decreased Shipping And Logistics Management Performance Efficiency Slides PDF
This slide covers the reasons why company wants to implement automation in business as current shipping and Logistics Management System Efficiency is decreasing compared for 3 years. Some indicators are order accuracy rate, on time delivery, average cycle time , inventory accuracy, perfect order rate, overall integrated logistics efficiency etc. Deliver an awe inspiring pitch with this creative Decreased Shipping And Logistics Management Performance Efficiency Slides PDF bundle. Topics like Accuracy Rate, Inventory, Average can be discussed with this completely editable template. It is available for immediate download depending on the needs and requirements of the user.
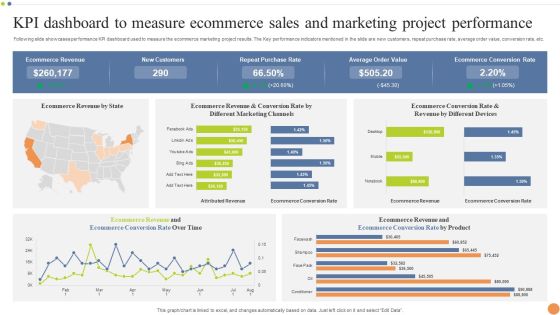
KPI Dashboard To Measure Ecommerce Sales And Marketing Project Performance Portrait PDF
Following slide showcases performance KPI dashboard used to measure the ecommerce marketing project results. The Key performance indicators mentioned in the slide are new customers, repeat purchase rate, average order value, conversion rate, etc. Pitch your topic with ease and precision using this KPI Dashboard To Measure Ecommerce Sales And Marketing Project Performance Portrait PDF. This layout presents information on Purchase Rate, Average Order Value, Ecommerce Conversion Rate. It is also available for immediate download and adjustment. So, changes can be made in the color, design, graphics or any other component to create a unique layout.

 Home
Home