Indicators

Customer Satisfaction Levels High Medium Low Indicator Dashboard Ppt PowerPoint Presentation Icon Show
This is a customer satisfaction levels high medium low indicator dashboard ppt powerpoint presentation icon show. This is a six stage process. The stages in this process are performance dashboard, performance meter, performance kpi.

Low High Performance Measurement Indicator Dashboard Ppt PowerPoint Presentation Summary Images
This is a low high performance measurement indicator dashboard ppt powerpoint presentation summary images. This is a five stage process. The stages in this process are performance dashboard, performance meter, performance kpi.
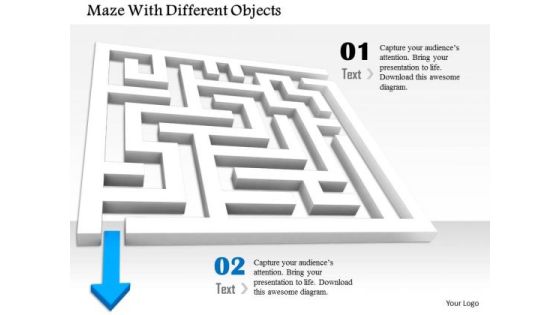
Stock Photo Blue Arrow Indicating Way Out From Maze PowerPoint Slide
This image is designed with blue arrow indication way out of maze. Use this professional image to demonstrate concepts of problem solving and finding solution. Use this theme of maze to give unified look to your presentations.

Business Diagram Yellow Warning Board For Fire Hazard Indication Presentation Template
Display the warning of fire hazard and its indication for safety. These measures may be well explained with this exclusive diagram template. Use this slide to build professional presentations for your audience.
Stock Photo 3d Mouse Cursor For Data Indication Image Graphics For PowerPoint
This Power Point image template has been crafted with graphic of 3d mouse cursor. This image template contains the concept of data indication on computer. Use this image template for your computer technology related presentations.

Reaching Business Goals Performance Indicator Ppt PowerPoint Presentation Pictures Infographic Template
This is a reaching business goals performance indicator ppt powerpoint presentation pictures infographic template. This is a one stage process. The stages in this process are sales objectives, sales goal, achieving sales target.

Key Performance Indicator Analytics Dashboard Ppt PowerPoint Presentation Model Example Topics
This is a key performance indicator analytics dashboard ppt powerpoint presentation model example topics. This is a five stage process. The stages in this process are kpi proposal, kpi plan, kpi scheme.
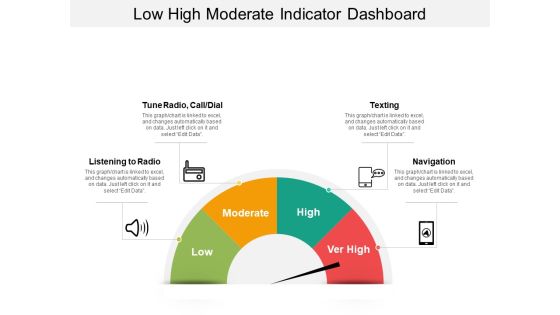
Low High Moderate Indicator Dashboard Ppt Powerpoint Presentation Infographic Template Example 2015
This is a low high moderate indicator dashboard ppt powerpoint presentation infographic template example 2015. This is a four stage process. The stages in this process are disturbance, distraction, interruption, diversion.
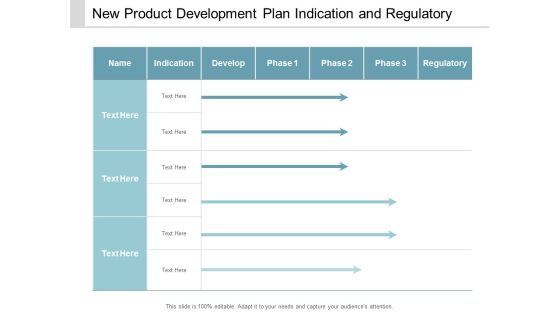
New Product Development Plan Indication And Regulatory Ppt Powerpoint Presentation Ideas Design Ideas
This is a new product development plan indication and regulatory ppt powerpoint presentation ideas design ideas. This is a three stage process. The stages in this process are product development pipeline, product development line, product development channel.

Availability Key Performance Indicator Inventory Turnover Ratio Ppt Powerpoint Presentation Layouts Graphics Download
This is a availability key performance indicator inventory turnover ratio ppt powerpoint presentation layouts graphics download. This is a two stage process. The stages in this process are availability kpi, availability dashboard, availability metrics.

Vector Indicating 14 Steps Business Process Cycle Ppt PowerPoint Presentation Gallery Background Images PDF
Persuade your audience using this vector indicating 14 steps business process cycle ppt powerpoint presentation gallery background images pdf. This PPT design covers three stages, thus making it a great tool to use. It also caters to a variety of topics including vector indicating 14 steps business process cycle. Download this PPT design now to present a convincing pitch that not only emphasizes the topic but also showcases your presentation skills.

Downturn Graph Indicating Growth Rate In Various Countries Ppt PowerPoint Presentation Layouts Design Templates PDF
Pitch your topic with ease and precision using this downturn graph indicating growth rate in various countries ppt powerpoint presentation layouts design templates pdf. This layout presents information on downturn graph indicating growth rate in various countries. It is also available for immediate download and adjustment. So, changes can be made in the color, design, graphics or any other component to create a unique layout.
Graph Indicating Business Sales Growth Trend Ppt PowerPoint Presentation File Slide Portrait PDF
Persuade your audience using this graph indicating business sales growth trend ppt powerpoint presentation file slide portrait pdf. This PPT design covers three stages, thus making it a great tool to use. It also caters to a variety of topics including graph indicating business sales growth trend. Download this PPT design now to present a convincing pitch that not only emphasizes the topic but also showcases your presentation skills.

Three Circular Steps Indicating Business Product Lines Ppt PowerPoint Presentation File Shapes PDF
Persuade your audience using this three circular steps indicating business product lines ppt powerpoint presentation file shapes pdf. This PPT design covers three stages, thus making it a great tool to use. It also caters to a variety of topics including three circular steps indicating business product lines. Download this PPT design now to present a convincing pitch that not only emphasizes the topic but also showcases your presentation skills.

Chart Indicating United States Marine Corps Yearly Attrition Rate Ppt PowerPoint Presentation File Background Images PDF
Pitch your topic with ease and precision using this chart indicating united states marine corps yearly attrition rate ppt powerpoint presentation file background images pdf. This layout presents information on hart indicating united states marine corps yearly attrition rate. It is also available for immediate download and adjustment. So, changes can be made in the color, design, graphics or any other component to create a unique layout.
Client Satisfaction Survey With Performance Indicator Icon Ppt PowerPoint Presentation Gallery Backgrounds PDF
Persuade your audience using this client satisfaction survey with performance indicator icon ppt powerpoint presentation gallery backgrounds pdf. This PPT design covers three stages, thus making it a great tool to use. It also caters to a variety of topics including client satisfaction survey with performance indicator icon. Download this PPT design now to present a convincing pitch that not only emphasizes the topic but also showcases your presentation skills.
Financial Risk Indicator With Threat Symbol Vector Icon Ppt PowerPoint Presentation Summary PDF
Persuade your audience using this financial risk indicator with threat symbol vector icon ppt powerpoint presentation summary pdf. This PPT design covers three stages, thus making it a great tool to use. It also caters to a variety of topics including financial risk indicator with threat symbol vector icon. Download this PPT design now to present a convincing pitch that not only emphasizes the topic but also showcases your presentation skills.
Group Presentation Indicating Roles And Responsibilities Ppt PowerPoint Presentation Icon Styles PDF
Persuade your audience using this group presentation indicating roles and responsibilities ppt powerpoint presentation icon styles pdf. This PPT design covers four stages, thus making it a great tool to use. It also caters to a variety of topics including group presentation indicating roles and responsibilities. Download this PPT design now to present a convincing pitch that not only emphasizes the topic but also showcases your presentation skills.

Five Steps Indicating Presentation To International Business Ppt PowerPoint Presentation File Inspiration PDF
Persuade your audience using this five steps indicating presentation to international business ppt powerpoint presentation file inspiration pdf. This PPT design covers five stages, thus making it a great tool to use. It also caters to a variety of topics including five steps indicating presentation to international business. Download this PPT design now to present a convincing pitch that not only emphasizes the topic but also showcases your presentation skills.
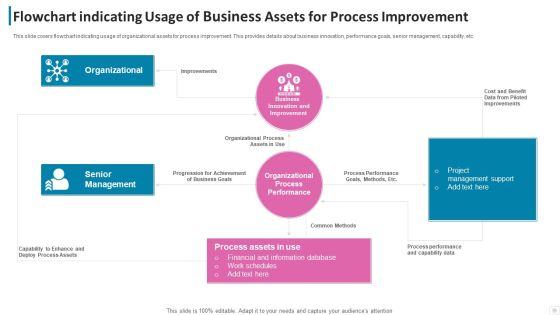
Flowchart Indicating Usage Of Business Assets For Process Improvement Formats PDF
This slide covers flowchart indicating usage of organizational assets for process improvement. This provides details about business innovation, performance goals, senior management, capability, etc. Pitch your topic with ease and precision using this flowchart indicating usage of business assets for process improvement formats pdf. This layout presents information on organizational, senior management, organizational process. It is also available for immediate download and adjustment. So, changes can be made in the color, design, graphics or any other component to create a unique layout.

Supplier Scorecard Supplier Comparison Scorecard With Key Performance Indicator Chart Formats PDF
This is a supplier scorecard supplier comparison scorecard with key performance indicator chart formats pdf template with various stages. Focus and dispense information on one stages using this creative set, that comes with editable features. It contains large content boxes to add your information on topics like supplier comparison scorecard, key performance, indicator chart. You can also showcase facts, figures, and other relevant content using this PPT layout. Grab it now.

Dashboard Indicating Funding Request Capital Raising Stages Ppt Show Infographics PDF
This slide showcases dashboard indicating status of multiple stages in funding ask. It provides information about valuation, discount, investors, seed round, angel, previous funding, etc. Showcasing this set of slides titled dashboard indicating funding request capital raising stages ppt show infographics pdf. The topics addressed in these templates are previous funding, building expenses, resource requirement. All the content presented in this PPT design is completely editable. Download it and make adjustments in color, background, font etc. as per your unique business setting.
Icon Indicating Cloud Platform Migration Service For User Platform Designs PDF
Persuade your audience using this Icon Indicating Cloud Platform Migration Service For User Platform Designs PDF. This PPT design covers four stages, thus making it a great tool to use. It also caters to a variety of topics including Icon Indicating Cloud Platform Migration Service For User Platform. Download this PPT design now to present a convincing pitch that not only emphasizes the topic but also showcases your presentation skills.

Change Management Leadership Icon Indicating Manager Developing Team Skills Infographics PDF
Persuade your audience using this Change Management Leadership Icon Indicating Manager Developing Team Skills Infographics PDF This PPT design covers four stages, thus making it a great tool to use. It also caters to a variety of topics including Change Management, Leadership Icon, Indicating Manager Download this PPT design now to present a convincing pitch that not only emphasizes the topic but also showcases your presentation skills.
Icon Indicating Trainer Conducting Leader Training And Development Program Designs PDF
Persuade your audience using this Icon Indicating Trainer Conducting Leader Training And Development Program Designs PDF. This PPT design covers three stages, thus making it a great tool to use. It also caters to a variety of topics including Icon Indicating Trainer, Conducting Leader ,Training And Development, Program. Download this PPT design now to present a convincing pitch that not only emphasizes the topic but also showcases your presentation skills.
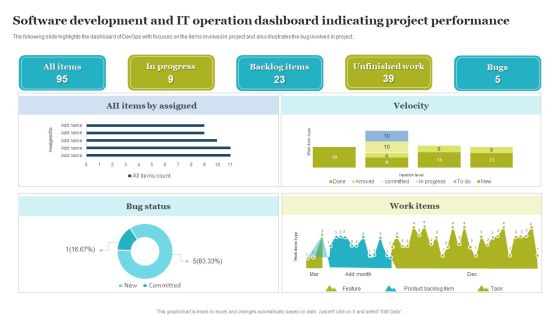
Software Development And IT Operation Dashboard Indicating Project Performance Demonstration PDF
The following slide highlights the dashboard of DevOps with focuses on the items involved in project and also illustrates the bug involved in project. Showcasing this set of slides titled Software Development And IT Operation Dashboard Indicating Project Performance Demonstration PDF. The topics addressed in these templates are Software Development, IT Operation Dashboard, Indicating Project Performance. All the content presented in this PPT design is completely editable. Download it and make adjustments in color, background, font etc. as per your unique business setting.

Market Growth And Development Tactics Icon Indicating Business Opportunity Template PDF
Persuade your audience using this Market Growth And Development Tactics Icon Indicating Business Opportunity Template PDF. This PPT design covers three stages, thus making it a great tool to use. It also caters to a variety of topics including Market Growth, Development Tactics Icon, Indicating Business Opportunity. Download this PPT design now to present a convincing pitch that not only emphasizes the topic but also showcases your presentation skills.

Workplace Risk Key Performance Indicator Dashboard Icon Ppt Inspiration Slides PDF
Persuade your audience using this Workplace Risk Key Performance Indicator Dashboard Icon Ppt Inspiration Slides PDF. This PPT design covers four stages, thus making it a great tool to use. It also caters to a variety of topics including Workplace Risk, Key Performance, Indicator Dashboard, Icon. Download this PPT design now to present a convincing pitch that not only emphasizes the topic but also showcases your presentation skills.

Internal Hiring Icon Indicating Job Promotion Ppt Infographic Template Portfolio PDF
Persuade your audience using this Internal Hiring Icon Indicating Job Promotion Ppt Infographic Template Portfolio PDF. This PPT design covers three stages, thus making it a great tool to use. It also caters to a variety of topics including Internal, Hiring Icon, Indicating Job Promotion. Download this PPT design now to present a convincing pitch that not only emphasizes the topic but also showcases your presentation skills.

Wastewater Treatment Workflow Diagram Indicating Batch Process Model Ppt Icon Example PDF
This slide showcase plant management workflow diagram indicating batch process model. It provides information about procedural model, physical model and process model. Pitch your topic with ease and precision using this Wastewater Treatment Workflow Diagram Indicating Batch Process Model Ppt Icon Example PDF. This layout presents information on Operations, Physical Model, Process Model, Procedural Model. It is also available for immediate download and adjustment. So, changes can be made in the color, design, graphics or any other component to create a unique layout.

Customer NPS Metric Dashboard Indicating Customer Satisfaction And Agent Performance Template PDF
This slide shows net promoter score dashboard indicating customer satisfaction and agent performance which includes medium wise satisfaction, customer satisfaction, consumer loyalty, etc. Showcasing this set of slides titled Customer NPS Metric Dashboard Indicating Customer Satisfaction And Agent Performance Template PDF. The topics addressed in these templates are Net Promoter Score, Consumer Loyalty, Top 5 Agents. All the content presented in this PPT design is completely editable. Download it and make adjustments in color, background, font etc. as per your unique business setting.

Customer Effort Score Indicator Icon To Measure Required Actions Ppt File Sample PDF
Persuade your audience using this Customer Effort Score Indicator Icon To Measure Required Actions Ppt File Sample PDF. This PPT design covers four stages, thus making it a great tool to use. It also caters to a variety of topics including Customer, Effort Score Indicator, Icon To Measure, Required Actions. Download this PPT design now to present a convincing pitch that not only emphasizes the topic but also showcases your presentation skills.

Dashboard Indicating Status Of Change Requests For Effective Leadership Decisions Themes PDF
This slide showcase leadership dashboard indicating status of change requests for effective leadership decisions which can benefit organizations in earning additional revenues and stimulate employee performance. It contains change request due in a week, change request due in month, open changes, waiting for approval, open changes by risk, change requests by status and change requests by due date.Showcasing this set of slides titled Dashboard Indicating Status Of Change Requests For Effective Leadership Decisions Themes PDF The topics addressed in these templates are Dashboard Indicating, Requests Effective, Leadership Decisions All the content presented in this PPT design is completely editable. Download it and make adjustments in color, background, font etc. as per your unique business setting.
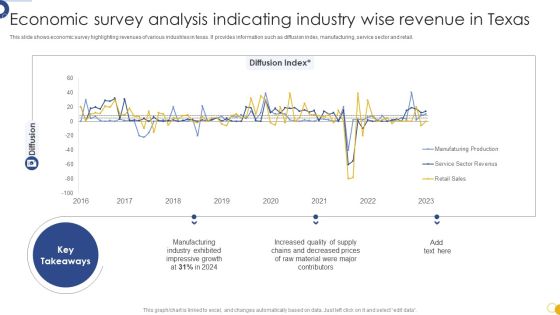
Economic Survey Analysis Indicating Industry Wise Revenue In Texas Portrait PDF
This slide shows economic survey highlighting revenues of various industries in texas. It provides information such as diffusion index, manufacturing, service sector and retail. Showcasing this set of slides titled Economic Survey Analysis Indicating Industry Wise Revenue In Texas Portrait PDF. The topics addressed in these templates are Economic Survey Analysis, Indicating Industry Wise, Revenue In Texas. All the content presented in this PPT design is completely editable. Download it and make adjustments in color, background, font etc. as per your unique business setting.

Statistics Indicating Risk Assessment Approaches Followed In Supply Chain Supplier Designs PDF
This slide. Delineates statistics indicating risk assessment approaches followed in supply chain procurement. It contains details such as initiating, standard processes, site inspection, supplier feedback, etc. Pitch your topic with ease and precision using this statistics indicating risk assessment approaches followed in supply chain supplier designs pdf. This layout presents information on key takeaways, approaches, respondents. It is also available for immediate download and adjustment. So, changes can be made in the color, design, graphics or any other component to create a unique layout.

Customer Texting Platforms Dashboard Indicating Conversation Stats And Sources Details Ideas PDF
This slide showcase customer messaging platform dashboard indicating conversation stats and sources details beneficial for companies to make any changes or improvements in prevailing bulk texts being sent to consumers. It contains information about assigned, unanswered, operators online, average response time, duration of conversation, users, message sources, etc.Showcasing this set of slides titled customer texting platforms dashboard indicating conversation stats and sources details ideas pdf The topics addressed in these templates are total conversations, total assigned, total unanswered All the content presented in this PPT design is completely editable. Download it and make adjustments in color, background, font etc. as per your unique business setting.
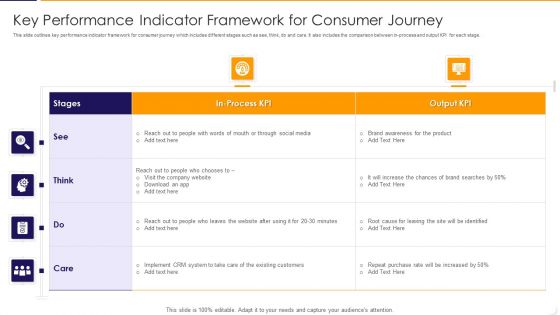
Key Performance Indicator Framework For Consumer Journey Ppt PowerPoint Presentation Gallery Good PDF
This slide outlines key performance indicator framework for consumer journey which includes different stages such as see, think, do and care. It also includes the comparison between in process and output KPI for each stage. Pitch your topic with ease and precision using this key performance indicator framework for consumer journey ppt powerpoint presentation gallery good pdf This layout presents information on social media, system, implement. It is also available for immediate download and adjustment. So, changes can be made in the color, design, graphics or any other component to create a unique layout.

Procedure Dashboard Indicating Integration Of Home Activities With Automation Ppt PowerPoint Presentation File Files PDF
This slide shows process dashboard indicating integration of home activities with automation which contains temperature, average humidity, intensity of light, bedroom, kitchen and dining. It can be beneficial for households who have transformed their homes into smart integrated systems and manage various priorities in one touch.Showcasing this set of slides titled Procedure Dashboard Indicating Integration Of Home Activities With Automation Ppt PowerPoint Presentation File Files PDF. The topics addressed in these templates are Average Humidity, Temperature, Intensity Light. All the content presented in this PPT design is completely editable. Download it and make adjustments in color, background, font etc. as per your unique business setting.
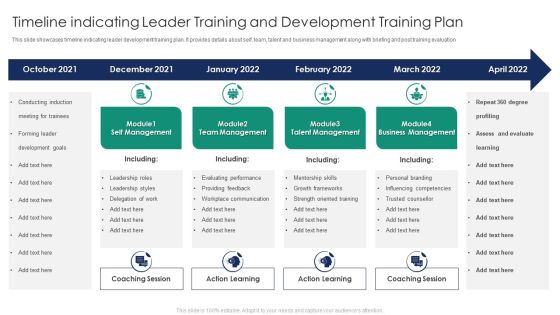
Timeline Indicating Leader Training And Development Training Plan Slides Structure PDF
This slide showcases timeline indicating leader development training plan. It provides details about self, team, talent and business management along with briefing and post training evaluation. Pitch your topic with ease and precision using this Timeline Indicating Leader Training And Development Training Plan Slides Structure PDF. This layout presents information on Self Management, Team Management, Talent Management. It is also available for immediate download and adjustment. So, changes can be made in the color, design, graphics or any other component to create a unique layout.

Comparative Health And Risk Key Performance Indicator Dashboard Ppt Portfolio Slide PDF
The slide highlights the comparative health and safety key performance indicator dashboard. It shows current year and previous events, safety incident classification, safety cases by place, map and safety consequence. Showcasing this set of slides titled Comparative Health And Risk Key Performance Indicator Dashboard Ppt Portfolio Slide PDF. The topics addressed in these templates are Safety Consequence, Safety Incidents Classification, Map. All the content presented in this PPT design is completely editable. Download it and make adjustments in color, background, font etc. as per your unique business setting.

Employee Health And Risk Key Performance Indicator Dashboard Ppt Layouts Brochure PDF
The following slide highlights the employee health and safety key performance indicator dashboard illustrating narrow escapes, potential hazards, improvement opportunity, total incidents, health and safety learning, safety visit by management, ltir and trir, severe injuries and fatalities and safety goals. Showcasing this set of slides titled Employee Health And Risk Key Performance Indicator Dashboard Ppt Layouts Brochure PDF. The topics addressed in these templates are Narrow Escapes, Potential Hazards, Improvement Opportunity. All the content presented in this PPT design is completely editable. Download it and make adjustments in color, background, font etc. as per your unique business setting.

Employee Risk Key Performance Indicator Dashboard With Case Incident Rate Ppt Professional Information PDF
The following slide highlights the employee safety key performance indicator dashboard with case incident rate illustrating total case occurrence rate, last reported case, days without reported, causing items, corrective actions, incident pyramid, incident by month and major causes. Pitch your topic with ease and precision using this Employee Risk Key Performance Indicator Dashboard With Case Incident Rate Ppt Professional Information PDF. This layout presents information on Total Case, Incident Rate, Last Incident Reported, Incident Causing Items. It is also available for immediate download and adjustment. So, changes can be made in the color, design, graphics or any other component to create a unique layout.
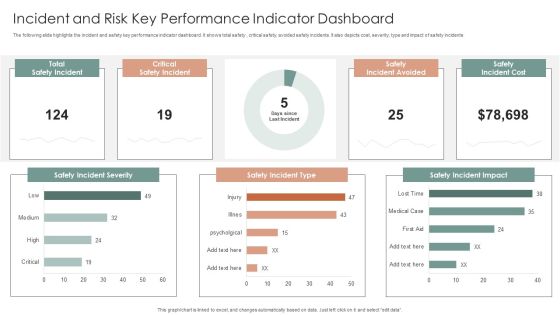
Incident And Risk Key Performance Indicator Dashboard Ppt Gallery Mockup PDF
The following slide highlights the incident and safety key performance indicator dashboard. It shows total safety, critical safety, avoided safety incidents. It also depicts cost, severity, type and impact of safety incidents. Showcasing this set of slides titled Incident And Risk Key Performance Indicator Dashboard Ppt Gallery Mockup PDF. The topics addressed in these templates are Safety Incident Severity, Safety Incident Type, Safety Incident Impact. All the content presented in this PPT design is completely editable. Download it and make adjustments in color, background, font etc. as per your unique business setting.

Patient Health And Risk Key Performance Indicator Dashboard Ppt Infographic Template Summary PDF
The following slide highlights the patient health and safety key performance indicator dashboard illustrating admission by department, admission by cost, patient satisfaction, total patients, operations cost, patient density, total staff, waiting time, treatment satisfaction and treatment confidence. Pitch your topic with ease and precision using this Patient Health And Risk Key Performance Indicator Dashboard Ppt Infographic Template Summary PDF. This layout presents information on Admission By Department, Admission Vs Cost, Patient Satisfaction. It is also available for immediate download and adjustment. So, changes can be made in the color, design, graphics or any other component to create a unique layout.

Risk Awareness And Risk Key Performance Indicator Dashboard Ppt Inspiration Ideas PDF
The following slide highlights the risk awareness and safety key performance indicator dashboard illustrating risk awareness, clear leadership, risk mitigation preparedness, risk incidents last month, safety incidents last months, inspection plan adherence, risk and safety quality training, trained people last month, monitoring, safety tools change on and risk awareness. Showcasing this set of slides titled Risk Awareness And Risk Key Performance Indicator Dashboard Ppt Inspiration Ideas PDF. The topics addressed in these templates are Safety Incident Avoided, Safety Incidents, Safety Incident, Accumulated Total. All the content presented in this PPT design is completely editable. Download it and make adjustments in color, background, font etc. as per your unique business setting.

Risk Key Performance Indicator Dashboard For Manufacturing Company Ppt Gallery Graphics Design PDF
The following slide highlights the safety key performance indicator dashboard for manufacturing company. It showcases safety incident per employee, total number of cases, safety events avoided, accumulated total and safety incidents. Pitch your topic with ease and precision using this Risk Key Performance Indicator Dashboard For Manufacturing Company Ppt Gallery Graphics Design PDF. This layout presents information on Safety Incidents, Safety Incident Avoided, Safety Incident Accumulated. It is also available for immediate download and adjustment. So, changes can be made in the color, design, graphics or any other component to create a unique layout.
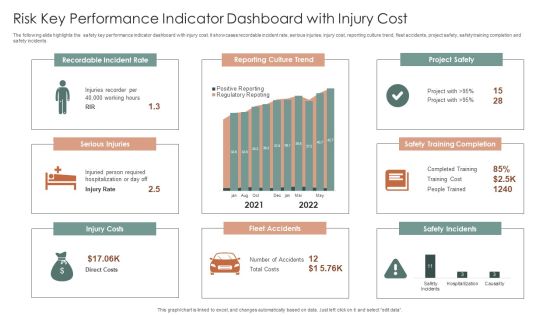
Risk Key Performance Indicator Dashboard With Injury Cost Ppt Summary Brochure PDF
The following slide highlights the safety key performance indicator dashboard with injury cost. It showcases recordable incident rate, serious injuries, injury cost, reporting culture trend, fleet accidents, project safety, safety training completion and safety incidents. Pitch your topic with ease and precision using this Risk Key Performance Indicator Dashboard With Injury Cost Ppt Summary Brochure PDF. This layout presents information on Recordable Incident Rate, Reporting Culture Trend, Project Safety. It is also available for immediate download and adjustment. So, changes can be made in the color, design, graphics or any other component to create a unique layout.
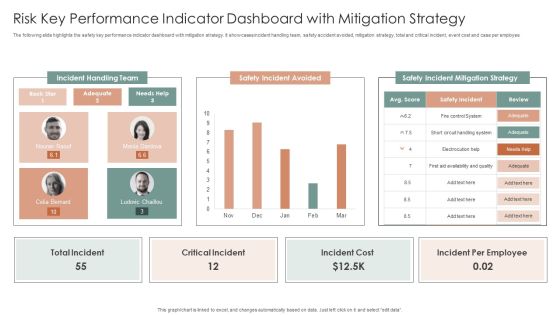
Risk Key Performance Indicator Dashboard With Mitigation Strategy Ppt Inspiration Design Templates PDF
The following slide highlights the safety key performance indicator dashboard with mitigation strategy. It showcases incident handling team, safety accident avoided, mitigation strategy, total and critical incident, event cost and case per employee. Showcasing this set of slides titled Risk Key Performance Indicator Dashboard With Mitigation Strategy Ppt Inspiration Design Templates PDF. The topics addressed in these templates are Incident Handling Team, Safety Incident Avoided, Safety Incident. All the content presented in this PPT design is completely editable. Download it and make adjustments in color, background, font etc. as per your unique business setting.
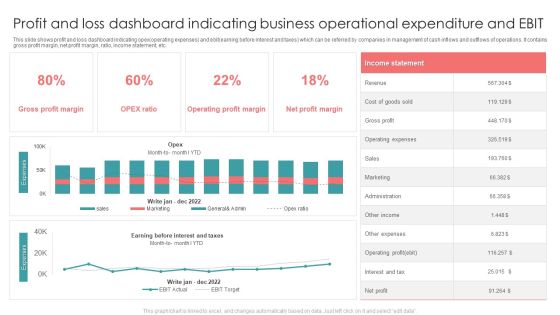
Profit And Loss Dashboard Indicating Business Operational Expenditure And EBIT Formats PDF
This slide shows profit and loss dashboard indicating opex operating expenses and ebit earning before interest and taxes which can be referred by companies in management of cash inflows and outflows of operations. It contains gross profit margin, net profit margin, ratio, income statement, etc. Showcasing this set of slides titled Profit And Loss Dashboard Indicating Business Operational Expenditure And EBIT Formats PDF. The topics addressed in these templates are Revenue, Gross Profit, Sales. All the content presented in this PPT design is completely editable. Download it and make adjustments in color, background, font etc. as per your unique business setting.
Statistics Indicating Recurring Business Operational Expenditure In Telecom Operations Icons PDF
This slide shows statistics indicating recurring operating expenditure OPEX in telecom operations which can benefit their executives in evaluating the current expenses and make cost effective amendments for future operations. It includes information about maintenance, repair, network charging and billing, customer support, marketing and operational planning costs. Pitch your topic with ease and precision using this Statistics Indicating Recurring Business Operational Expenditure In Telecom Operations Icons PDF. This layout presents information on Company, Costs, Marketing Costs. It is also available for immediate download and adjustment. So, changes can be made in the color, design, graphics or any other component to create a unique layout.

Business Operational Expenditure Dashboard Indicating Revenue And Costs Metrics Pictures PDF
This slide shows operating expenses OPEX dashboard indicating revenue and costs metrics which can be referred by companies to manage various operating expenses of various departments. It contains information about cost center, revenue per company, company code, etc. Pitch your topic with ease and precision using this Business Operational Expenditure Dashboard Indicating Revenue And Costs Metrics Pictures PDF. This layout presents information on Business Operational, Costs Metrics, Revenue. It is also available for immediate download and adjustment. So, changes can be made in the color, design, graphics or any other component to create a unique layout.

Statistics Indicating Changing Landscape Of Business Threats Ppt Model Design Templates PDF
This slide showcases statistics indicating changing landscape of business risk which can be referred by executives and managers to make decisions regarding their upcoming strategies and opportunities for risks. It includes information about cybersecurity breaches, business interruption, new technologies, climatic change, Persuade your audience using this Statistics Indicating Changing Landscape Of Business Threats Ppt Model Design Templates PDF. This PPT design covers one stages, thus making it a great tool to use. It also caters to a variety of topics including Cyber Security Breaches, Business Interruption, New Technologies. Download this PPT design now to present a convincing pitch that not only emphasizes the topic but also showcases your presentation skills.

Data Profiling Solutions Dashboard Indicating Row And Column Analysis Summary PDF
This slide illustrates data profiling dashboard indicating row and column analysis which can be referred by IT managers to manager to maintain quality and consistency of data. It contains information about reports, checking, evolution, overview, comparative, etc. Showcasing this set of slides titled Data Profiling Solutions Dashboard Indicating Row And Column Analysis Summary PDF. The topics addressed in these templates are Overview Analysis, Column Evaluation, Comparative Evaluation. All the content presented in this PPT design is completely editable. Download it and make adjustments in color, background, font etc. as per your unique business setting.
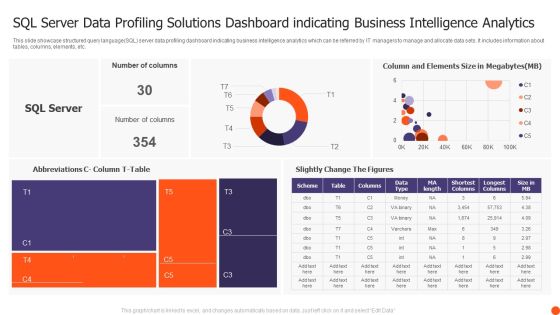
SQL Server Data Profiling Solutions Dashboard Indicating Business Intelligence Analytics Structure PDF
This slide showcase structured query language SQL server data profiling dashboard indicating business intelligence analytics which can be referred by IT managers to manage and allocate data sets. It includes information about tables, columns, elements, etc. Showcasing this set of slides titled SQL Server Data Profiling Solutions Dashboard Indicating Business Intelligence Analytics Structure PDF. The topics addressed in these templates are Number Columns, Slightly Change Figures, SQL Server. All the content presented in this PPT design is completely editable. Download it and make adjustments in color, background, font etc. as per your unique business setting.

Automated Testing Framework Dashboard Indicating Reported Issues And Results Ideas PDF
This slide showcase test automation framework dashboard indicating reported issues and results which can benefit IT firms in quick resolution of these problems. It contains information about weekly total, test results and details. It also includes information about passed, known issue, avoided, ended, queued, etc. Showcasing this set of slides titled Automated Testing Framework Dashboard Indicating Reported Issues And Results Ideas PDF. The topics addressed in these templates are Weekly Total, Test Results, Last 7 Days. All the content presented in this PPT design is completely editable. Download it and make adjustments in color, background, font etc. as per your unique business setting.

Investment Crowdfunding Platforms Data Indicating Equity And Debt Raised For Real Estate Diagrams PDF
This slide exhibits crowdfunding platforms data indicating equity and debt raised for real estate. It includes information about platforms and amount collected which can be referred by investors to choose best platforms to gain maximum ROI.Showcasing this set of slides titled Investment Crowdfunding Platforms Data Indicating Equity And Debt Raised For Real Estate Diagrams PDF. The topics addressed in these templates are Collected Financed, Highest Amount, Estate Industry. All the content presented in this PPT design is completely editable. Download it and make adjustments in color, background, font etc. as per your unique business setting.

Economic Survey Analysis Depicting Performance Of Major US Stock Indices Summary PDF
This slide shows economic survey highlighting performance of US stock exchange. It provides information about NASDAQ, S and P 500, dow jones, closing price, IT companies, stock price, etc. Showcasing this set of slides titled Economic Survey Analysis Depicting Performance Of Major US Stock Indices Summary PDF. The topics addressed in these templates are Economic Survey Analysis, Depicting Performance Major, US Stock Indices. All the content presented in this PPT design is completely editable. Download it and make adjustments in color, background, font etc. as per your unique business setting.
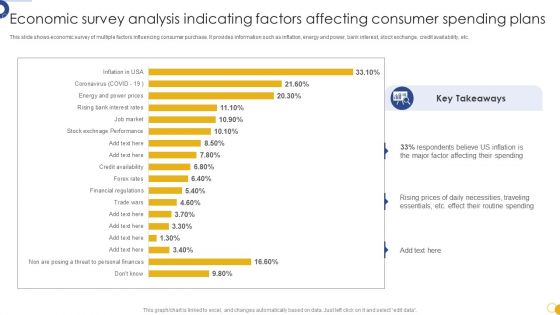
Economic Survey Analysis Indicating Factors Affecting Consumer Spending Plans Download PDF
This slide shows economic survey of multiple factors influencing consumer purchase. It provides information such as inflation, energy and power, bank interest, stock exchange, credit availability, etc. Pitch your topic with ease and precision using this Economic Survey Analysis Indicating Factors Affecting Consumer Spending Plans Download PDF. This layout presents information on Economic Survey Analysis, Indicating Factors Affecting, Consumer Spending Plans. It is also available for immediate download and adjustment. So, changes can be made in the color, design, graphics or any other component to create a unique layout.

Cloud Data Transformation Dashboard Indicating Project And Provision Status Formats PDF
This slide showcase data migration best practices dashboard indicating overall project and provision status. It contains information about contains user, group and resource provision status. Showcasing this set of slides titled Cloud Data Transformation Dashboard Indicating Project And Provision Status Formats PDF. The topics addressed in these templates are Data Migration Status, Overall Project Status, Group Provision Status. All the content presented in this PPT design is completely editable. Download it and make adjustments in color, background, font etc. as per your unique business setting.

Sales By Lead Source Performance Indicator Ppt Show Visual Aids PDF
Create an editable Sales By Lead Source Performance Indicator Ppt Show Visual Aids PDF that communicates your idea and engages your audience. Whether you are presenting a business or an educational presentation, pre designed presentation templates help save time. Sales By Lead Source Performance Indicator Ppt Show Visual Aids PDF is highly customizable and very easy to edit, covering many different styles from creative to business presentations. Slidegeeks has creative team members who have crafted amazing templates. So, go and get them without any delay.

 Home
Home