Improvement Chart

Bar Chart Ppt PowerPoint Presentation Model Professional
This is a bar chart ppt powerpoint presentation model professional. This is a three stage process. The stages in this process are business, marketing, strategy, finance, growth.

Stacked Line Chart Ppt PowerPoint Presentation Outline
This is a stacked line chart ppt powerpoint presentation outline. This is a two stage process. The stages in this process are business, marketing, product, line chart, management.

Column Chart Ppt PowerPoint Presentation Styles Outline
This is a column chart ppt powerpoint presentation styles outline. This is a two stage process. The stages in this process are business, marketing, strategy, finance, planning.
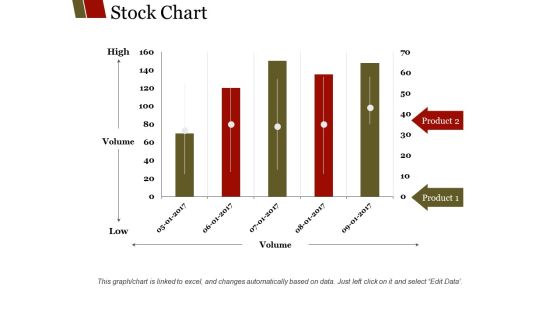
Stock Chart Ppt PowerPoint Presentation Outline Slideshow
This is a stock chart ppt powerpoint presentation outline slideshow. This is a five stage process. The stages in this process are high, volume, low, product, finance.
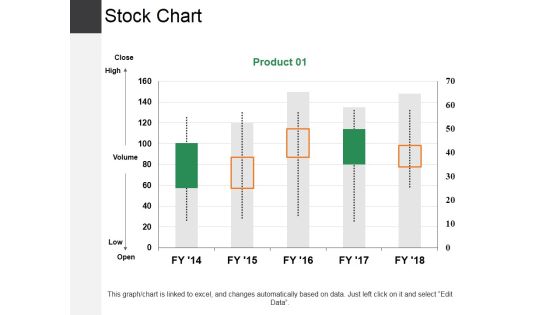
Stock Chart Ppt PowerPoint Presentation Slides Outline
This is a stock chart ppt powerpoint presentation slides outline. This is a one stage process. The stages in this process are high, low, business, marketing, graph.

Column Chart Ppt PowerPoint Presentation Outline Clipart
This is a column chart ppt powerpoint presentation outline clipart. This is a two stage process. The stages in this process are finance, analysis, business, marketing, strategy.
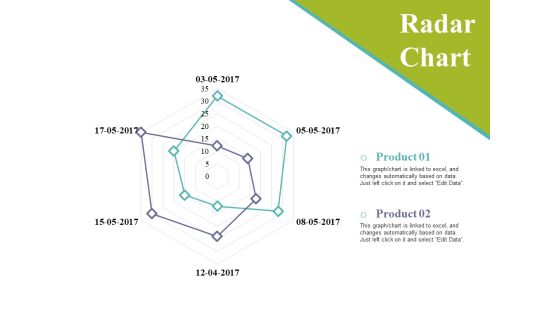
Radar Chart Ppt PowerPoint Presentation Outline Ideas
This is a radar chart ppt powerpoint presentation outline ideas. This is a two stage process. The stages in this process are business, marketing, finance, strategy, graph.

Area Chart Ppt PowerPoint Presentation Outline Examples
This is a area chart ppt powerpoint presentation outline examples. This is a two stage process. The stages in this process are business, marketing, graph, finance, strategy.

Column Chart Ppt PowerPoint Presentation Outline Deck
This is a column chart ppt powerpoint presentation outline deck. This is a two stage process. The stages in this process are business, marketing, expenditure in, years, graph.

Representing Diverging Circular Flow Chart PowerPoint Templates
We present our representing diverging circular flow chart PowerPoint templates.Present our Ring charts PowerPoint Templates because this PPt slide helps you to measure key aspects of the current process and collect relevant data. Download our Circle charts PowerPoint Templates because the mind is always whirring with new ideas. Download our Process and Flows PowerPoint Templates because you have a clear vision of the cake you want. Download our Business PowerPoint Templates because you can Flutter your wings and enchant the world. Impress them with the innate attractiveness of your thoughts and words. Download our Marketing PowerPoint Templates because with the help of our Slides you can Illustrate your ideas one by one and demonstrate how each is an important cog in running the entire wheel.Use these PowerPoint slides for presentations relating to Circle, circulation, cobalt,colorful, cyan, cycle, element,emblem, grayshadow, green,icon, indicator, interface, internet, label,link, load, marker, motion, movement,navigationpanel, next, orientation, pagsite, pink, pointer, previous, process, reload, rotation, satined, sign, signpost,smooth, sticker, sticky, symbol. The prominent colors used in the PowerPoint template are Green, Black, White. Customers tell us our representing diverging circular flow chart PowerPoint templates will make the presenter successul in his career/life. We assure you our cobalt PowerPoint templates and PPT Slides are Nifty. PowerPoint presentation experts tell us our representing diverging circular flow chart PowerPoint templates are Fabulous. People tell us our grayshadow PowerPoint templates and PPT Slides will help you be quick off the draw. Just enter your specific text and see your points hit home. We assure you our representing diverging circular flow chart PowerPoint templates are Excellent. Use our cobalt PowerPoint templates and PPT Slides have awesome images to get your point across.

Organization Chart Ppt PowerPoint Presentation Layout
This is a organization chart ppt powerpoint presentation layout. This is a three stage process. The stages in this process are managing director, executive director, head projects, production, head customer relations, quality control.

Combo Chart Ppt PowerPoint Presentation Samples
This is a combo chart ppt powerpoint presentation samples. This is a four stage process. The stages in this process are business, marketing, strategy, success, growth.

PowerPoint Designs Company Cycle Chart Ppt Process
PowerPoint Designs Company Cycle Chart PPT Process-Cycle Diagrams are a type of graphics that shows how items are related to one another in a repeating cycle. In a cycle diagram, you can explain the main events in the cycle, how they interact, and how the cycle repeats. These Diagrams can be used to interact visually and logically with audiences. -PowerPoint Designs Company Cycle Chart PPT Process
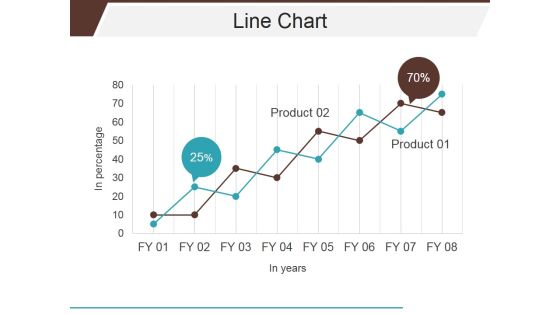
Line Chart Ppt PowerPoint Presentation Layouts Gridlines
This is a line chart ppt powerpoint presentation layouts gridlines. This is a two stage process. The stages in this process are business, marketing, line chart, analysis, growth.

Stock Chart Ppt PowerPoint Presentation Backgrounds
This is a stock chart ppt powerpoint presentation backgrounds. This is a five stage process. The stages in this process are high, volume, low, close.

Combo Chart Ppt PowerPoint Presentation Ideas Portrait
This is a combo chart ppt powerpoint presentation ideas portrait. This is a three stage process. The stages in this process are product, business, finance, growth.

Bar Chart Ppt PowerPoint Presentation Microsoft
This is a bar chart ppt powerpoint presentation microsoft. This is a eleven stage process. The stages in this process are sales in percentage, fy, graph, success, business.

Bar Chart Ppt PowerPoint Presentation Model Good
This is a bar chart ppt powerpoint presentation model good. This is a seven stage process. The stages in this process are business, marketing, bar, success, finance.

Combo Chart Ppt PowerPoint Presentation Template
This is a combo chart ppt powerpoint presentation template. This is a four stage process. The stages in this process are product, growth, graph, management, business.

5s Sample Score Chart Presentation Pictures
This is a 5s sample score chart presentation pictures. This is a five stage process. The stages in this process are radar chart, sustain, standardize, shine, straighten.
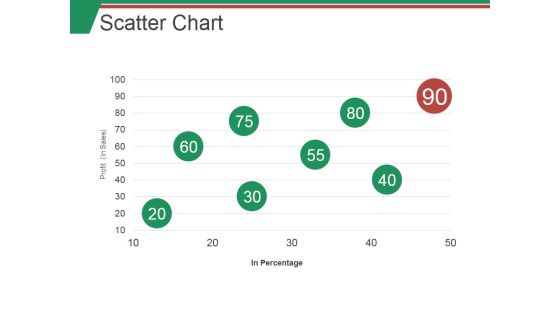
Scatter Chart Ppt PowerPoint Presentation Model Themes
This is a scatter chart ppt powerpoint presentation model themes. This is a eight stage process. The stages in this process are business, scatter, bubble, graph, marketing.

Hierarchy Chart Ppt PowerPoint Presentation Styles Files
This is a hierarchy chart ppt powerpoint presentation styles files. This is a four stage process. The stages in this process are chief executive, general manager, marketing manager, head of designer, finance manager, social marketing team, design and development.
Pie Chart Ppt PowerPoint Presentation Icon Example
This is a pie chart ppt powerpoint presentation icon example. This is a three stage process. The stages in this process are pie chart, marketing, strategy, analysis, business.
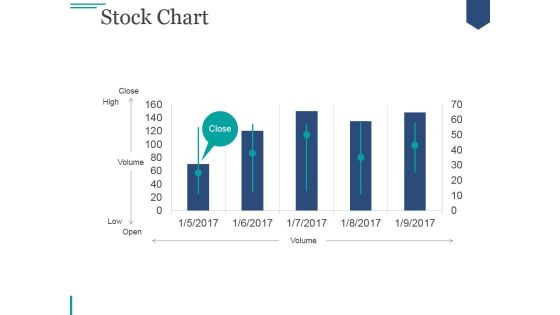
Stock Chart Ppt PowerPoint Presentation Diagrams
This is a stock chart ppt powerpoint presentation diagrams. This is a five stage process. The stages in this process are close, high, volume, low, open.

Pie Chart Ppt PowerPoint Presentation Show
This is a pie chart ppt powerpoint presentation show. This is a four stage process. The stages in this process are pie chart, business, marketing, success, circular.
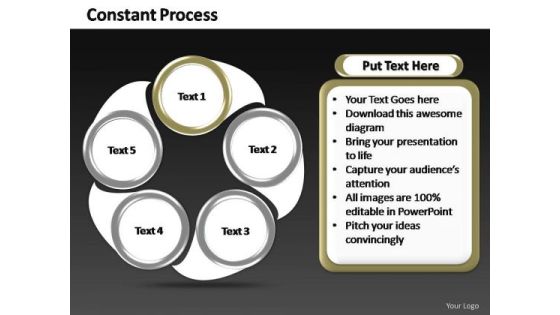
PowerPoint Slide Chart Constant Process Ppt Design
PowerPoint Slide Chart Constant Process PPT Design-PowerPoint Slide Designs Teamwork Round Moving PPT Slide Designs-Explore the various directions and layers existing in your in your plans and processes. Unravel the desired and essential elements of your overall strategy. Explain the relevance of the different layers and stages and directions in getting down to your core competence, ability and desired result.-PowerPoint Slide Chart Constant Process PPT Design

Radar Chart Ppt PowerPoint Presentation Styles Infographics
This is a radar chart ppt powerpoint presentation styles infographics. This is a six stage process. The stages in this process are business, marketing, product, radar chart, strategy.

PowerPoint Backgrounds Chart Cycle Process Ppt Themes
PowerPoint Backgrounds Chart Cycle Process PPT Themes-Cycle Diagrams are a type of graphics that shows how items are related to one another in a repeating cycle. In a cycle diagram, you can explain the main events in the cycle, how they interact, and how the cycle repeats. These Diagrams can be used to interact visually and logically with audiences.-PowerPoint Backgrounds Chart Cycle Process PPT Themes

Radar Chart Ppt PowerPoint Presentation Gallery Show
This is a radar chart ppt powerpoint presentation gallery show. This is a two stage process. The stages in this process are radar chart, business, marketing, success, strategy.

Pie Chart Ppt PowerPoint Presentation Summary
This is a pie chart ppt powerpoint presentation summary. This is a four stage process. The stages in this process are pie chart, marketing, strategy, analysis, investment, business.

Bar Chart Ppt PowerPoint Presentation File Templates
This is a bar chart ppt powerpoint presentation file templates. This is a four stage process. The stages in this process are business, marketing, strategy, finance, planning.
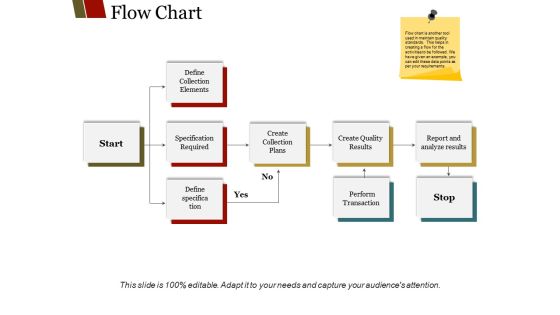
Flow Chart Ppt PowerPoint Presentation Infographic Template
This is a flow chart ppt powerpoint presentation infographic template. This is a four stage process. The stages in this process are define collection elements, specification required, create collection plans, create quality results, report and analyze results.

Financial Marketing Organization Chart Presentation Ideas
This is a financial marketing organization chart presentation ideas. This is a five stage process. The stages in this process are financial system, financial institutions, financial markets, financial instruments, financial services.\n\n
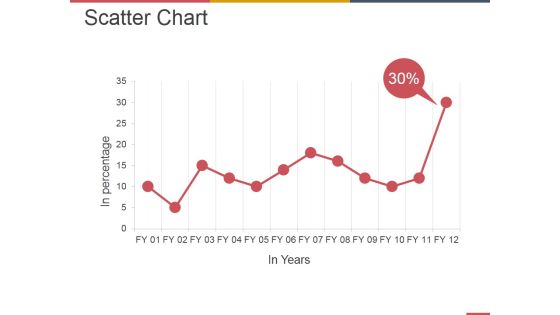
Scatter Chart Ppt PowerPoint Presentation File Example
This is a scatter chart ppt powerpoint presentation file example. This is a twelve stage process. The stages in this process are business, strategy, marketing, analysis, finance.

Area Chart Ppt PowerPoint Presentation Professional
This is a area chart ppt powerpoint presentation professional. This is a one stage process. The stages in this process are product, in percentage, jan, feb, mar, apr.

Area Chart Ppt PowerPoint Presentation Samples
This is a area chart ppt powerpoint presentation samples. This is a two stage process. The stages in this process are financial year, sales in percentage, jan, feb.

Combo Chart Finance Ppt PowerPoint Presentation Clipart
This is a combo chart finance ppt powerpoint presentation pictures show. This is a two stage process. The stages in this process are finance, marketing, management, investment, analysis.
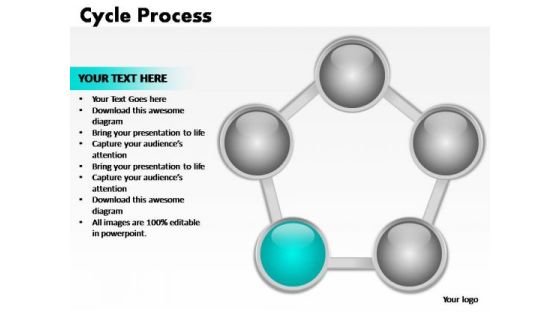
PowerPoint Design Chart Cycle Process Ppt Backgrounds
PowerPoint Design Chart Cycle Process PPT Backgrounds-Cycle Diagrams are a type of graphics that shows how items are related to one another in a repeating cycle. In a cycle diagram, you can explain the main events in the cycle, how they interact, and how the cycle repeats. These Diagrams can be used to interact visually and logically with audiences.-PowerPoint Design Chart Cycle Process PPT Backgrounds

Bar Chart Ppt PowerPoint Presentation File Rules
This is a bar chart ppt powerpoint presentation file rules. This is a two stage process. The stages in this process are bar graph, finance, marketing, strategy, analysis.

Combo Chart Ppt PowerPoint Presentation Tips
This is a combo chart ppt powerpoint presentation tips. This is a eight stage process. The stages in this process are product, growth, marketing, management.

Bar Chart Ppt PowerPoint Presentation Pictures Inspiration
This is a bar chart ppt powerpoint presentation pictures inspiration. This is a seven stage process. The stages in this process are in percentage, business, marketing, finance, graph.
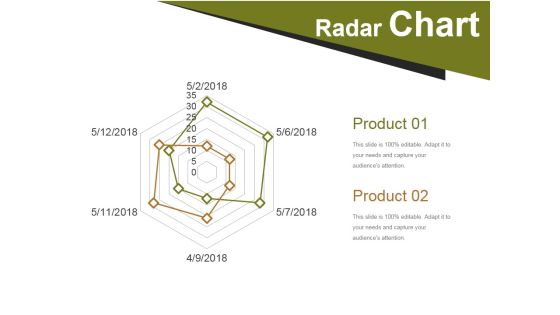
Radar Chart Ppt PowerPoint Presentation Summary Templates
This is a radar chart ppt powerpoint presentation summary templates. This is a two stage process. The stages in this process are business, management, radar chart, strategy, success.

Flow Chart Ppt PowerPoint Presentation Show Brochure
This is a flow chart ppt powerpoint presentation show brochure. This is a three stage process. The stages in this process are define collection elements, specification required, define specification, create collection plans, create quality results.
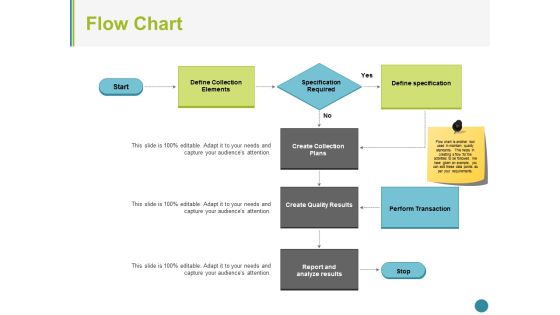
Flow Chart Ppt PowerPoint Presentation Model Skills
This is a Flow Chart Ppt PowerPoint Presentation Model Skills. This is a four stage process. The stages in this process are define collection elements, specification required, define specification, create collection plans, create quality results, perform transaction.

Bar Chart Ppt PowerPoint Presentation Infographics Skills
This is a bar chart ppt powerpoint presentation infographics skills. This is a seven stage process. The stages in this process are business, marketing, strategy, finance, bar.

Bar Chart Ppt PowerPoint Presentation Show Slides
This is a bar chart ppt powerpoint presentation show slides. This is a three stage process. The stages in this process are business, marketing, strategy, bar, finance.

Bar Chart Ppt PowerPoint Presentation Professional Examples
This is a bar chart ppt powerpoint presentation professional examples. This is a four stage process. The stages in this process are percentage, marketing, management, product.

Bar Chart Ppt PowerPoint Presentation Show Deck
This is a bar chart ppt powerpoint presentation show deck. This is a two stage process. The stages in this process are percentage, product, business, marketing.

Area Chart Ppt PowerPoint Presentation Show
This is a area chart ppt powerpoint presentation show. This is a two stage process. The stages in this process are sales in percentage, business, marketing, analysis, success.

Area Chart Ppt PowerPoint Presentation Picture
This is a area chart ppt powerpoint presentation picture. This is a two stage process. The stages in this process are product, in percentage, graph, management, business.
Donut Chart Ppt PowerPoint Presentation Icon Rules
This is a donut chart ppt powerpoint presentation icon rules. This is a four stage process. The stages in this process are donut chart, percentage, business, management, process.

PowerPoint Designs Business Cycle Chart Ppt Slides
PowerPoint Designs Business Cycle Chart PPT Slides-Cycle Diagrams are a type of graphics that shows how items are related to one another in a repeating cycle. In a cycle diagram, you can explain the main events in the cycle, how they interact, and how the cycle repeats. These Diagrams can be used to interact visually and logically with audiences. -PowerPoint Designs Business Cycle Chart PPT Slides
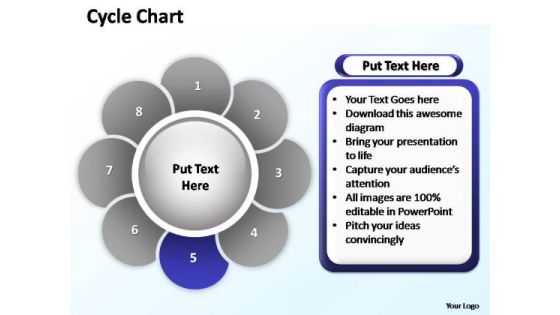
PowerPoint Designs Image Cycle Chart Ppt Layout
PowerPoint Designs Image Cycle Chart PPT Layout-Cycle Diagrams are a type of graphics that shows how items are related to one another in a repeating cycle. In a cycle diagram, you can explain the main events in the cycle, how they interact, and how the cycle repeats. These Diagrams can be used to interact visually and logically with audiences. -PowerPoint Designs Image Cycle Chart PPT Layout

PowerPoint Themes Growth Ring Chart Ppt Design
PowerPoint Themes Growth Ring Chart PPT Design-These high quality powerpoint pre-designed slides and powerpoint templates have been carefully created by our professional team to help you impress your audience. All slides have been created and are 100% editable in powerpoint. Each and every property of any graphic - color, size, orientation, shading, outline etc. can be modified to help you build an effective powerpoint presentation. Any text can be entered at any point in the powerpoint template or slide. Simply DOWNLOAD, TYPE and PRESENT!
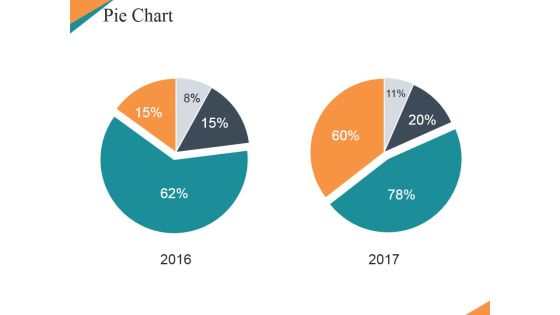
Pie Chart Ppt PowerPoint Presentation Portfolio Pictures
This is a pie chart ppt powerpoint presentation portfolio pictures. This is a two stage process. The stages in this process are pie chart, planning, management, strategy, marketing.

Column Chart Ppt PowerPoint Presentation Summary Introduction
This is a column chart ppt powerpoint presentation summary introduction. This is a two stage process. The stages in this process are business, marketing, bar, graph, finance.

Column Chart Ppt PowerPoint Presentation Summary Maker
This is a column chart ppt powerpoint presentation summary maker. This is a two stage process. The stages in this process are business, marketing, product, bar graph, years.

Management Organizational Chart Diagram Powerpoint Ideas
This is a management organizational chart diagram powerpoint ideas. This is a five stage process. The stages in this process are executive director, senior sales manager, senior marketing manager, marketing staff, sales person.

Column Chart Ppt PowerPoint Presentation Show Model
This is a column chart ppt powerpoint presentation show model. This is a six stage process. The stages in this process are business, marketing, bar, planning, strategy.

Combo Chart Ppt PowerPoint Presentation Show Summary
This is a combo chart ppt powerpoint presentation show summary. This is a three stage process. The stages in this process are bar, marketing, strategy, finance, planning.

 Home
Home