Improvement Chart

Column Chart Ppt PowerPoint Presentation Layouts Clipart
This is a column chart ppt powerpoint presentation layouts clipart. This is a two stage process. The stages in this process are column chart, finance, marketing, strategy, investment.

Area Chart Ppt PowerPoint Presentation Summary Guidelines
This is a area chart ppt powerpoint presentation summary guidelines. This is a two stage process. The stages in this process are area chart, finance, analysis, investment, marketing.

Area Chart Ppt PowerPoint Presentation Model Example
This is a area chart ppt powerpoint presentation model example. This is a two stage process. The stages in this process are area chart, finance, marketing, management, strategy.
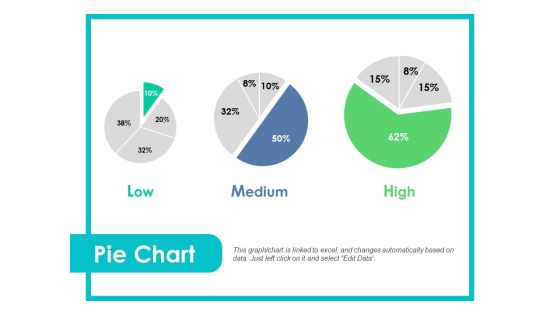
Pie Chart Ppt PowerPoint Presentation Gallery Brochure
This is a pie chart ppt powerpoint presentation gallery brochure. This is a three stages process. The stages in this process are low, medium, high, pie chart.

Bubble Chart Ppt PowerPoint Presentation Summary Background
This is a bubble chart ppt powerpoint presentation summary background. This is a two stage process. The stages in this process are bubble chart, profit, product, finance, business.

Bubble Chart Ppt PowerPoint Presentation Slides Portrait
This is a bubble chart ppt powerpoint presentation slides portrait. This is a two stage process. The stages in this process are bubble chart, product, finance, business, marketing.

Scatter Chart Ppt PowerPoint Presentation Styles Guidelines
This is a scatter chart ppt powerpoint presentation styles guidelines. This is a two stage process. The stages in this process are scatter chart, percentage, product.

Radar Chart Ppt PowerPoint Presentation Professional Ideas
This is a radar chart ppt powerpoint presentation professional ideas. This is a two stage process. The stages in this process are product, percentage, management, marketing, chart.

Radar Chart Ppt PowerPoint Presentation Pictures Guidelines
This is a radar chart ppt powerpoint presentation pictures guidelines. This is a two stage process. The stages in this process are business, strategy, marketing, analysis, radar chart.

Column Chart Ppt PowerPoint Presentation Influencers
This is a column chart ppt powerpoint presentation influencers. This is a two stage process. The stages in this process are column chart, finance, marketing, strategy, analysis, business.

Area Chart Ppt PowerPoint Presentation Outline Deck
This is a area chart ppt powerpoint presentation outline deck. This is a two stage process. The stages in this process are area chart, finance, marketing, analysis, business.
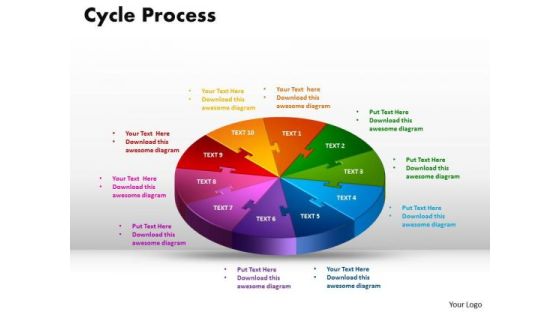
PowerPoint Backgrounds Cycle Process Chart Ppt Theme
PowerPoint Backgrounds Cycle Process Chart PPT Theme-Use this diagram to show a progression or a sequence of stages, tasks, or events in a circular flow. Emphasizes the interconnected pieces.-PowerPoint Backgrounds Cycle Process Chart PPT Theme
Pie Chart Ppt PowerPoint Presentation Outline Icons
This is a pie chart ppt powerpoint presentation outline icons. This is a three stage process. The stages in this process are pie chart, finance, marketing, strategy, business.
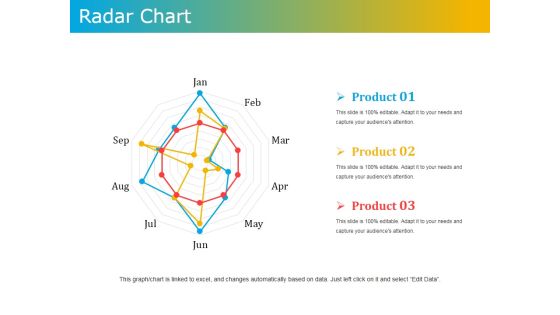
Radar Chart Ppt PowerPoint Presentation Outline Model
This is a radar chart ppt powerpoint presentation outline model. This is a three stage process. The stages in this process are radar chart, product, business, marketing, management.

Pie Chart Ppt PowerPoint Presentation Outline Gallery
This is a pie chart ppt powerpoint presentation outline gallery. This is a five stage process. The stages in this process are pie chart, finance, marketing, strategy, analysis.

Area Chart Ppt PowerPoint Presentation Professional Infographics
This is a area chart ppt powerpoint presentation professional infographics. This is a two stage process. The stages in this process are business, strategy, analysis, planning, area chart.
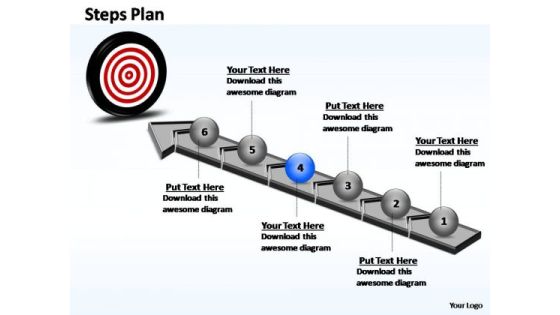
PowerPoint Process Chart Steps Plan Ppt Designs
PowerPoint Process Chart Steps Plan PPT Designs-This PowerPoint template shows Step Plan which consists of 6 Stages. It can be used to to show grouped or related information.-PowerPoint Process Chart Steps Plan PPT Designs
PowerPoint Template Chart Circular Process Ppt Template
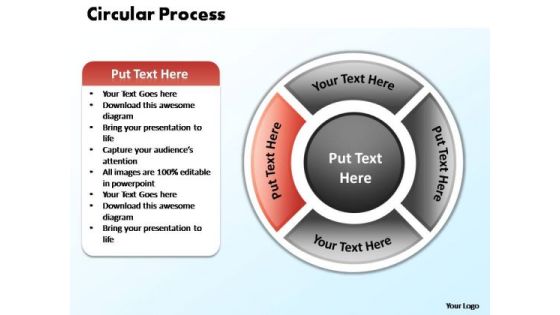
PowerPoint Template Chart Circular Process PPT Template-Highlight the key components of your entire manufacturing/ business process. Illustrate how each element flows seamlessly onto the next stage. Emphasise on any critical or key factors within them. Demonstrate how they all combine to form the final product.-PowerPoint Template Chart Circular Process PPT Template
PowerPoint Designs Chart Steps Plan Ppt Theme
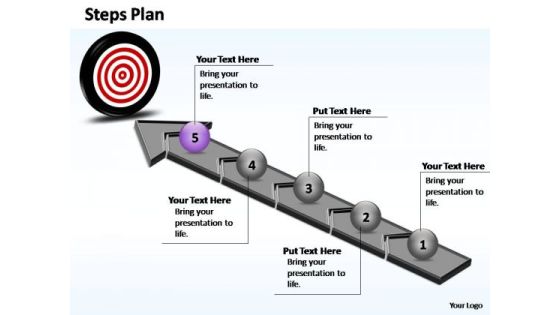
PowerPoint Designs Chart Steps Plan PPT Theme-This PowerPoint template shows Step Plan which consists of 5 Stages. It can be used to to show grouped or related information.-PowerPoint Designs Chart Steps Plan PPT Theme
PowerPoint Slides Circular Flow Chart Ppt Theme
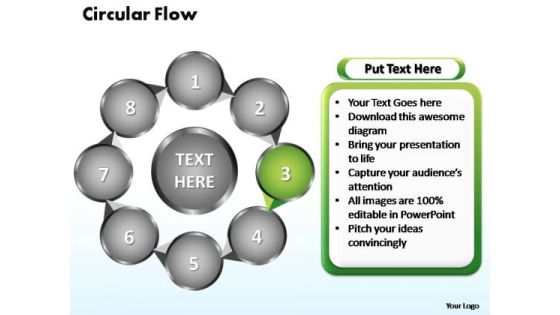
PowerPoint Slides Circular Flow Chart PPT Theme-Flowchart is a simple mapping tool that shows the sequence of actions within a process. Flowchart is widely used in business, education and economic presentations to help the audience visualize the content better, or to find flaws in a process.-PowerPoint Slides Circular Flow Chart PPT Theme
PowerPoint Slides Circular Flow Chart Ppt Themes
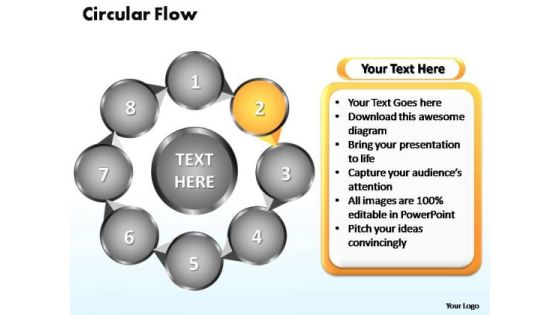
PowerPoint Slides Circular Flow Chart PPT Themes-Flowchart is a simple mapping tool that shows the sequence of actions within a process. Flowchart is widely used in business, education and economic presentations to help the audience visualize the content better, or to find flaws in a process.-PowerPoint Slides Circular Flow Chart PPT Themes

PowerPoint Design Cycle Process Chart Ppt Design
PowerPoint Design Cycle Process Chart PPT Design-This Cycle process diagram depicts process stages in a more understandable and vivid manner. Use this diagram to represent data that is easy to comprehend and analyze.-PowerPoint Design Cycle Process Chart PPT Design

PowerPoint Slides Circular Flow Chart Ppt Template
PowerPoint Slides Circular Flow Chart PPT Template-Flowchart is a simple mapping tool that shows the sequence of actions within a process. Flowchart is widely used in business, education and economic presentations to help the audience visualize the content better, or to find flaws in a process.-PowerPoint Slides Circular Flow Chart PPT Template
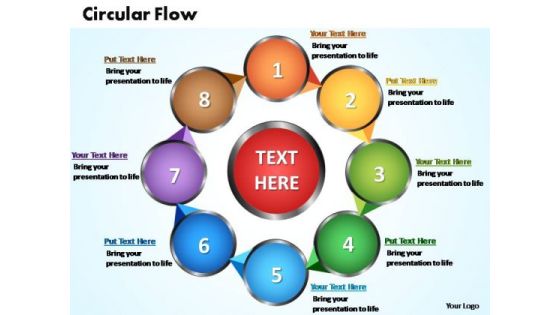
PowerPoint Slides Circular Flow Chart Ppt Templates
PowerPoint Slides Circular Flow Chart PPT Templates-Flowchart is a simple mapping tool that shows the sequence of actions within a process. Flowchart is widely used in business, education and economic presentations to help the audience visualize the content better, or to find flaws in a process.-PowerPoint Slides Circular Flow Chart PPT Templates

Area Chart Ppt PowerPoint Presentation Icon Microsoft
This is a area chart ppt powerpoint presentation icon microsoft. This is a two stage process. The stages in this process are business, strategy, analysis, planning, area chart.

Pie Chart Ppt PowerPoint Presentation Example 2015
This is a pie chart ppt powerpoint presentation example 2015. This is a five stage process. The stages in this process are pie chart, percentage, business, marketing, management.
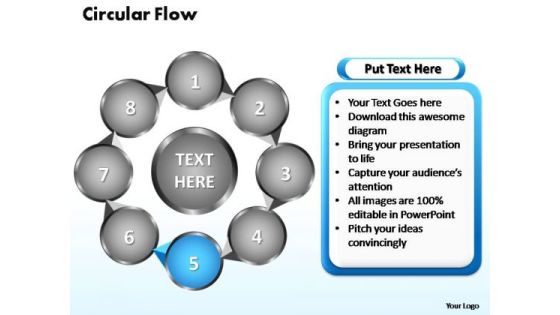
PowerPoint Slides Circular Flow Chart Ppt Design
PowerPoint Slides Circular Flow Chart PPT Design-Flowchart is a simple mapping tool that shows the sequence of actions within a process. Flowchart is widely used in business, education and economic presentations to help the audience visualize the content better, or to find flaws in a process.-PowerPoint Slides Circular Flow Chart PPT Design
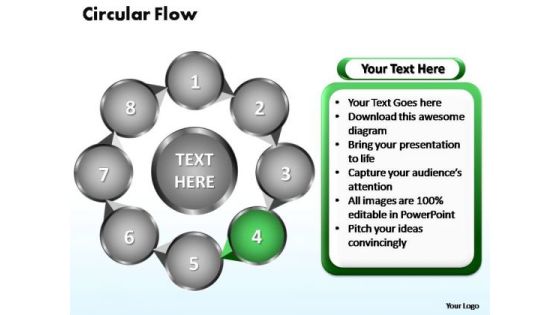
PowerPoint Slides Circular Flow Chart Ppt Designs
PowerPoint Slides Circular Flow Chart PPT Designs-Flowchart is a simple mapping tool that shows the sequence of actions within a process. Flowchart is widely used in business, education and economic presentations to help the audience visualize the content better, or to find flaws in a process.-PowerPoint Slides Circular Flow Chart PPT Designs
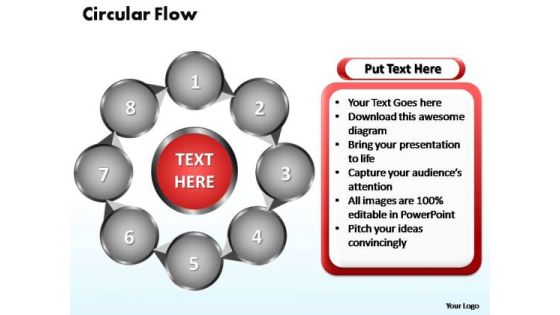
PowerPoint Slides Circular Flow Chart Ppt Layout
PowerPoint Slides Circular Flow Chart PPT Layout-Flowchart is a simple mapping tool that shows the sequence of actions within a process. Flowchart is widely used in business, education and economic presentations to help the audience visualize the content better, or to find flaws in a process.-PowerPoint Slides Circular Flow Chart PPT Layout

PowerPoint Slides Circular Flow Chart Ppt Layouts
PowerPoint Slides Circular Flow Chart PPT Layouts-Flowchart is a simple mapping tool that shows the sequence of actions within a process. Flowchart is widely used in business, education and economic presentations to help the audience visualize the content better, or to find flaws in a process.-PowerPoint Slides Circular Flow Chart PPT Layouts

PowerPoint Slides Circular Flow Chart Ppt Slide
PowerPoint Slides Circular Flow Chart PPT Slide-Flowchart is a simple mapping tool that shows the sequence of actions within a process. Flowchart is widely used in business, education and economic presentations to help the audience visualize the content better, or to find flaws in a process.-PowerPoint Slides Circular Flow Chart PPT Slide

PowerPoint Slides Circular Flow Chart Ppt Slides
PowerPoint Slides Circular Flow Chart PPT Slides-Flowchart is a simple mapping tool that shows the sequence of actions within a process. Flowchart is widely used in business, education and economic presentations to help the audience visualize the content better, or to find flaws in a process.-PowerPoint Slides Circular Flow Chart PPT Slides
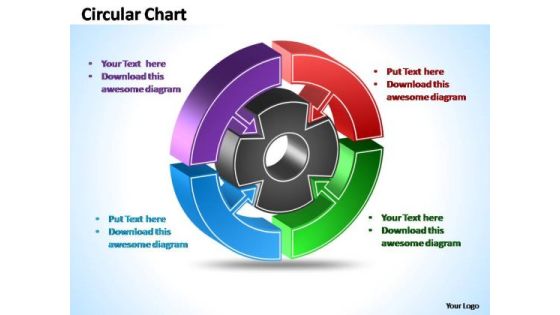
PowerPoint Templates Strategy Interconnected Circular Chart Themes
Analyze the seven success factors of your business with this circular business chart for Microsoft PowerPoint presentations

Bubble Chart Ppt PowerPoint Presentation Portfolio Files
This is a bubble chart ppt powerpoint presentation portfolio files. This is a five stage process. The stages in this process are profit, bubble chart, in percentage.

Stock Chart Ppt PowerPoint Presentation Slides Guidelines
This is a stock chart ppt powerpoint presentation slides guidelines. This is a five stage process. The stages in this process are stock chart, volume, low, close, open.
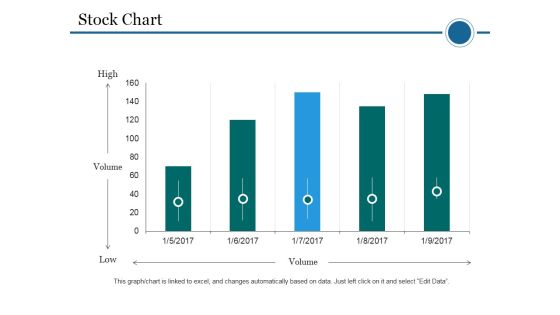
Stock Chart Ppt PowerPoint Presentation Professional Vector
This is a stock chart ppt powerpoint presentation professional vector. This is a five stage process. The stages in this process are stock chart, volume, high, low.

Area Chart Ppt PowerPoint Presentation Inspiration Images
This is a area chart ppt powerpoint presentation inspiration images. This is a two stage process. The stages in this process are area chart, product, sales in percentage.
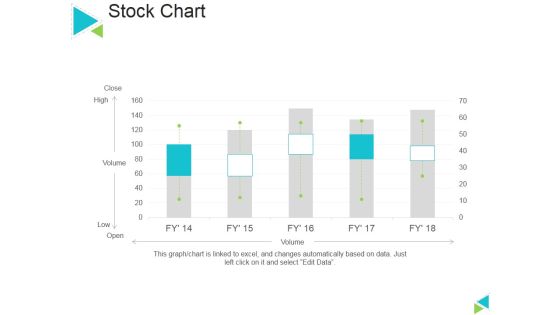
Stock Chart Ppt PowerPoint Presentation Ideas Slideshow
This is a stock chart ppt powerpoint presentation ideas slideshow. This is a five stage process. The stages in this process are stock chart, close, volume, open.

Bubble Chart Ppt PowerPoint Presentation Slide
This is a bubble chart ppt powerpoint presentation slide. This is a eight stage process. The stages in this process are business, marketing, finance, chart, management.

Pie Chart Ppt PowerPoint Presentation Ideas Microsoft
This is a pie chart ppt powerpoint presentation ideas microsoft. This is a four stage process. The stages in this process are pie chart, finance, marketing, strategy, business.
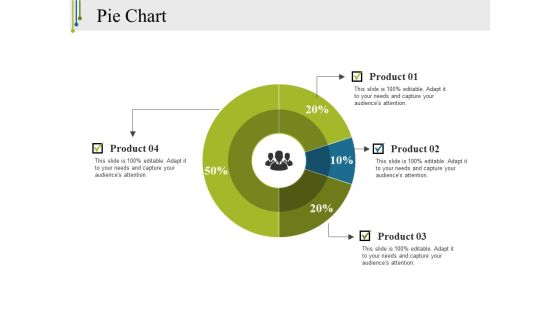
Pie Chart Ppt PowerPoint Presentation Infographics Clipart
This is a pie chart ppt powerpoint presentation infographics clipart. This is a four stage process. The stages in this process are pie chart, finance, marketing, strategy, business.

PowerPoint Templates Circular Process Chart Ppt Design
PowerPoint Templates Circular Process Chart PPT Design-This Diagram shows interrelated concepts in a circular flow . An excellent graphic to attract the attention of and understanding by your audience -PowerPoint Templates Circular Process Chart PPT Design-Cycle, Design, Diagram, Element, Graph, Business, Chart, Circular, Connect, Connection, Puzzle, Round, Solving, Step, Together, Putting, Mystery, Linking, Infographic, Icon,

Combo Chart Ppt PowerPoint Presentation Portfolio Template
This is a combo chart ppt powerpoint presentation portfolio template. This is a three stage process. The stages in this process are product, business, marketing, combo chart, percentage.
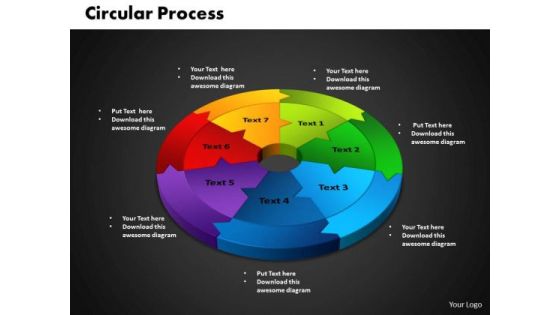
PowerPoint Backgrounds Circular Process Chart Ppt Backgrounds
PowerPoint Backgrounds Circular Process Chart PPT Backgrounds-Use this graphic to represent a continuing sequence of stages, tasks, or events in a circular flow and emphasize the connection between all components. -PowerPoint Backgrounds Circular Process Chart PPT Backgrounds-Cycle, Design, Diagram, Element, Graph, Business, Chart, Circular, Connect, Connection, Puzzle, Round, Solving, Step, Together, Putting, Mystery, Linking, Infographic, Icon,
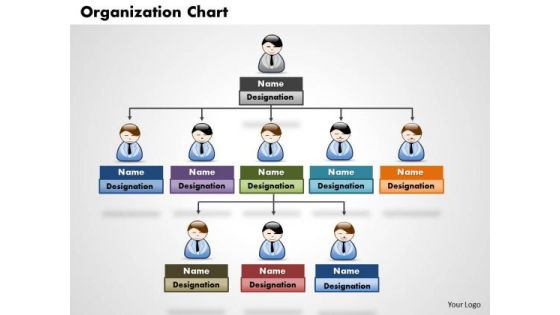
Business Diagram Organization Chart PowerPoint Ppt Presentation
Open Up Doors That Lead To Success. Our Business Diagram Organization chart PowerPoint PPT Presentation PowerPoint Templates Provide The Handles.
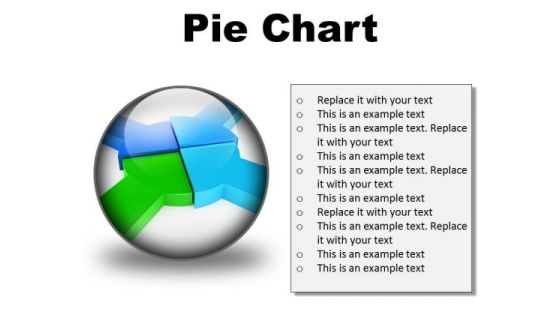
Pie Chart Business PowerPoint Presentation Slides C
Microsoft PowerPoint Slides and Backgrounds with render illustration of equal partnership pie chart

Pie Chart Business PowerPoint Presentation Slides Cc
Microsoft PowerPoint Slides and Backgrounds with render illustration of equal partnership pie chart
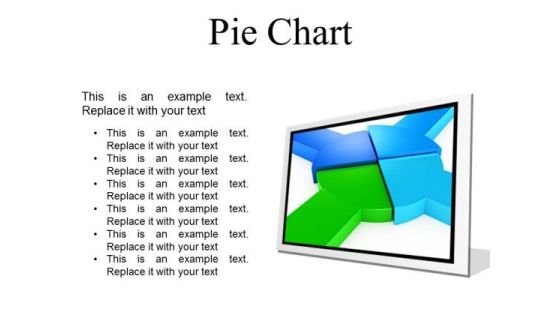
Pie Chart Business PowerPoint Presentation Slides F
Microsoft PowerPoint Slides and Backgrounds with render illustration of equal partnership pie chart

Pie Chart Business PowerPoint Presentation Slides R
Microsoft PowerPoint Slides and Backgrounds with render illustration of equal partnership pie chart

Pie Chart Business PowerPoint Presentation Slides S
Microsoft PowerPoint Slides and Backgrounds with render illustration of equal partnership pie chart
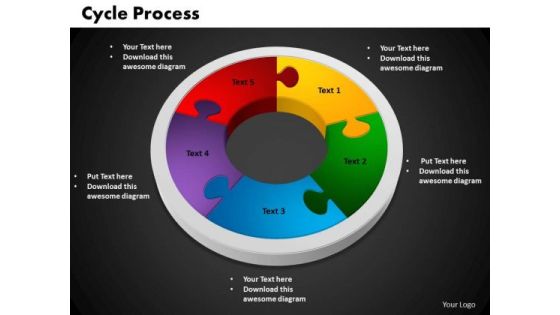
PowerPoint Slides Cycle Process Chart Ppt Template
PowerPoint Slides Cycle Process Chart PPT Template-Cycle Diagrams are a type of graphics that shows how items are related to one another in a repeating cycle. In a cycle diagram, you can explain the main events in the cycle, how they interact, and how the cycle repeats.-PowerPoint Slides Cycle Process Chart PPT Template-Cycle, Design, Diagram, Element, Graph, Business, Chart, Circular, Connect, Connection, Puzzle, Round, Solving, Step, Together, Putting, Mystery, Linking, Infographic, Icon,

PowerPoint Template Round Chart Sales Ppt Templates
PowerPoint Template Round Chart Sales PPT Templates-This Appealing PowerPoint Diagram consists of our pre-designed circle organized charts for you. This PowerPoint Diagram is particularly suitable for displaying contexts, relations and individual steps of a concept or consecutive items. This Diagram will fit for Business Presentations.-PowerPoint Template Round Chart Sales PPT Templates
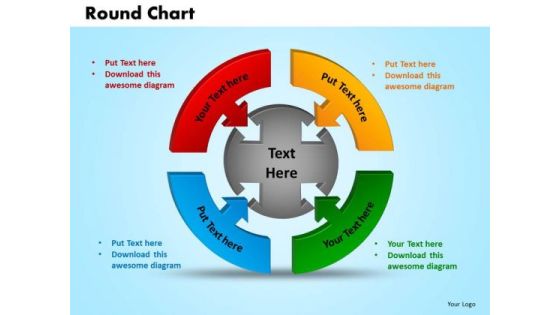
PowerPoint Presentation Round Chart Sales Ppt Themes
PowerPoint Presentation Round Chart Sales PPT Themes-This PowerPoint Diagram represents the Round Sales Chart in which four different approaches which results in one common Outcome. It Imitates the concept of Teamwork as they are inter-related to each other.-PowerPoint Presentation Round Chart Sales PPT Themes
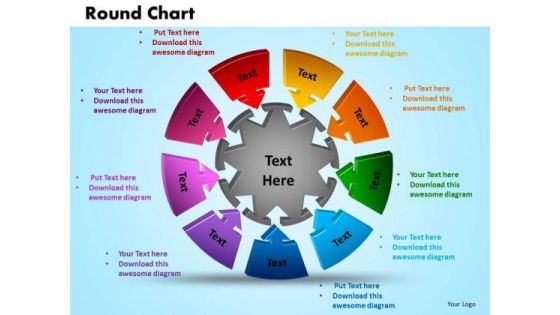
PowerPoint Presentation Round Chart Sales Ppt Template
PowerPoint Presentation Round Chart Sales PPT template-This PowerPoint Diagram represents the Round Sales Chart in which nine different problems or issues results in one common Outcome. It Portrays the concept of Teamwork as they are interconnected to each other.-PowerPoint Presentation Round Chart Sales PPT template

Table Chart For Project Status Presentation Template
This pre-designed slide displays table chart. This slide has been carefully designed with graphics of table chart. Use this chart to display projects status.

Chart Growth Business PowerPoint Template 0910
Arrow pointing to the higher financial chart bar 3d illustration
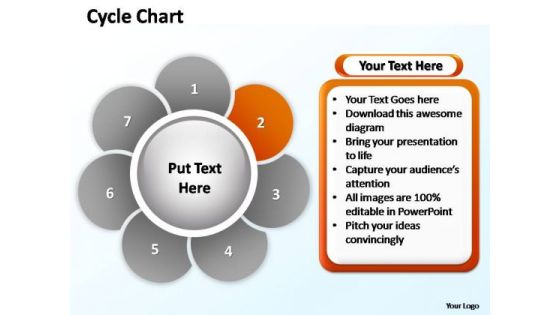
PowerPoint Slides Growth Cycle Chart Ppt Presentation
PowerPoint Slides Growth Cycle Chart PPT Presentation-Cycle Diagrams are a type of graphics that shows how items are related to one another in a repeating cycle. In a cycle diagram, you can explain the main events in the cycle, how they interact, and how the cycle repeats. These Diagrams can be used to interact visually and logically with audiences. -PowerPoint Slides Growth Cycle Chart PPT Presentation

Organizational Chart Ppt PowerPoint Presentation Pictures
This is a organizational chart ppt powerpoint presentation pictures. This is a three stage process. The stages in this process are management, marketing, business, chart, organizational chart.
Scatter Chart Ppt PowerPoint Presentation Icon Smartart
This is a scatter chart ppt powerpoint presentation icon smartart. This is a one stage process. The stages in this process are scatter chart, finance, business, planning, marketing, management.

Area Chart Ppt PowerPoint Presentation Icon Summary
This is a area chart ppt powerpoint presentation icon summary. This is a two stage process. The stages in this process are financial year, area chart, in percentage, product.

 Home
Home